the Creative Commons Attribution 4.0 License.
the Creative Commons Attribution 4.0 License.
 | 01 Feb 2018
Land susceptibility to soil erosion in Orashi Catchment, Nnewi South, Anambra State, Nigeria
Shakirudeen Odunuga
Abiodun Ajijola
Nkechi Igwetu
Olubunmi Adegun
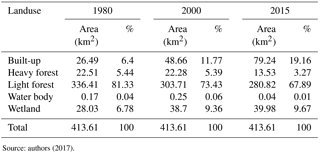
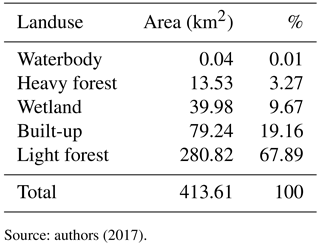
Soil erosion is one of the most critical environmental hazards that causes land degradation and water quality challenges. Specifically, this phenomenon has been linked, among other problems, to river sedimentation, groundwater pollution and flooding. This paper assesses the susceptibility of Orashi River Basin (ORB) to soil erosion for the purpose of erosion control measures. Located in the South Eastern part of Nigeria, the ORB which covers approximately 413.61 km2 is currently experiencing one of the fastest population growth rate in the region. Analysis of the soil erosion susceptibility of the basin was based on four factors including; rainfall, Land use/Land cover change (LULC), slope and soil erodibility factor (k). The rainfall was assumed to be a constant and independent variable, slope and soil types were categorised into ten (10) classes each while the landuse was categorised into five classes. Weight was assigned to the classes based on the degree of susceptibility to erosion. An overlay of the four variables in a GIS environment was used to produce the basin susceptibility to soil erosion. This was based on the weight index of each factors. The LULC analysis revealed that built-up land use increased from 26.49 km2 (6.4 %) in year 1980 to 79.24 km2 (19.16 %) in 2015 at an average growth rate of 1.51 km2 per annum while the light forest decreased from 336.41 km2 (81.33 %) in 1980 to 280.82 km2 (67.89 %) in 2015 at an average rate 1.59 km2 per annum. The light forest was adjudged to have the highest land cover soil erosion susceptibility. The steepest slope ranges between 70 and 82∘ (14.34 % of the total land area) and was adjudged to have the highest soil susceptibility to erosion. The total area covered of the loamy soil is 112.37 km2 (27.07 %) with erodibility of 0.7. In all, the overlay of all the variables revealed that 106.66 km2 (25.70 %) and 164.80 km2 (39.7 %) of the basin has a high and very high susceptibility to soil erosion. The over 50 % high susceptibility of catchment has serious negative implications on the surface water in terms of water quality and downstream siltation with great consequences on biodiversity and ecosystem services including domestic and industrial usage.
- Article
(7786 KB) - Full-text XML
- BibTeX
- EndNote


Soil erosion is one of the most critical environmental hazards that causes land degradation and water quality challenges. Several lands had been abandoned in most of the eastern states of Nigeria including Nnewi South owing to a combination of reasons championed by soil erosion. This singular environmental problem is the most prominent hazard in most eastern states of Nigeria where for instance more than 10 % of land resources in Nnewi South is already lost to erosion (Nwajide and Hoque, 1979). Soil erosion is exacerbated due to the decrease in the erosional resistance of the land surface or there is an increase in the erosivity factors acting on the land (Ofomata, 2000). The lost land resources is at the detriment of the local people (peasant farmers) who depend on them for sustainability and livelihood. But these set of people may have ignorantly created or aided the erosion by landuse practice which perhaps was based on their level of understanding. The actions of the highly erosive rainfall energy on the land as well as the topography and soil characteristics with the interferences of humans continues to scar the land, and the effects are cumulatively seen in the sedimentation of rivers, land degradation, pollution of groundwater, land subsidence, flooding etc. However, the process of soil erosion and sediment transport are strongly influenced by landuse changes.
Land use describes the various ways in which humans make use of and manage the land as a resource. It is characterized by the arrangement; activities and inputs people undertake in a certain land cover type to produce, change or maintain it (FAO/UNEP, 1999). A more inclusive definition of land use is often used in practice. The earth surface is shaped by a combination of physical processes, including earthquakes and volcanoes, shifting rocks and sediments, and flows of water and ice. Humans also shape the land through increasing populations and agricultural expansion, mineral, and forest resource excavation, changing the flow of rivers and with layers of industrial and urban infrastructures. Viewed from a holistic perspective, land use concerns the products and/or benefits obtained from the use of land as well as the land management actions carried out by humans to produce those products and benefits.
Land use and land management practices have a major impact on the natural resources including water, soil, nutrient, plants and animals. In addition to the soil erosion, other significant effect of land use includes urban sprawl, land degradation, salinization, and densification. Land degradation has been exacerbated where there has been an absence of any land use planning or one-sided central planning. This has further led to the over-utilization of land resources, for instance, for immediate production at all costs. Consequently, the result has often been a misery for large segment of local population and destruction of valuable ecosystem (Karamouz et al., 2006). Such narrow approaches should be replaced by techniques incorporating planning and management of land resources in an integrated way that ensure the long-term quality of land for human use. Unsustainable land use practices culminating in environmental challenge of soil erosion are often aided by anthropogenic actions earlier mentioned on land, particularly in developing countries.
Rather than battling with the menace of soil erosion, preventing unsustainable and or unfriendly environmental activities on fragile land that could lead to this challenge would be more appropriate particularly in areas of fragile soils such as mid or eastern Nigeria.
It is pertinent also to ask if land resistant or susceptibility to soil erosion is considered before any activity on them is embarked on. The inability to consider this vital question would be synonymous to deliberate attempt on environmental degradation of soil erosion. Soils within the ORB are fertile (which encourages agricultural practices) but also highly erodible due to lack of conservation practice. The susceptibility of the ORB – a region currently experiencing one of the fastest population growth rates in the south-eastern Nigeria requires an erosion control measures which formed the basis of this paper. Soil erosion in the scarp land of the south-eastern Nigeria is generally attributed to man's interference with nature's balance in the soil in addition to the application of destructive methods of land cultivation such as making ridges along slopes (Ofomata, 1985; Oyegun, 1990).
Orashi River Basin (ORB) – a tributary of the River Niger drains Orlu, Orsu, Ideato north and south local government areas of Imo state and Ihiala, Aguata, Ekwusigo, and Nnewi north and south of Anambra state, south-east Nigeria (Fig. 1a). Its geographic limit extends from longitude 6∘49′18 to 7∘9′29 and latitude 5∘45′39 to 50∘59′41. The study area falls within the tropical rainforest vegetative zone; dominant type of trees are oil palm (Elaeisguineensis) and mahogany (Swieteniamacrophylla) meanwhile shrubs and trees often build-up to thick forest along the Orashi river banks (Fig. 1b). Humid tropical climate with annual rainfall from 1750 to 2500 mm characterized the catchment while the soil types are lateritic in nature, derived from the underlying sandstone and shale units. The soils derived from shale are on the lower slope where drainage is poor, although the occurrences of loamy and humus soils have enhanced the cultivation of crops. Nnewi, Ukporaku, Ubu-Ihembosi, Idemili, Ubu-Otih, Ebubedike, Uchu, and Aghomili streams are the tributaries of the catchment. Orashi basin is an emerging and leading centre for entrepreneurial activities, development of commerce and industry among the people of the south-eastern states of Nigeria. Other economic activities include agriculture, hunting, trading, fishing, craft making, and cottage industries. However, farming activities is dominated by subsistence shifting cultivation where vegetables, corn, cassava, yam, melon and cocoyam are grown.
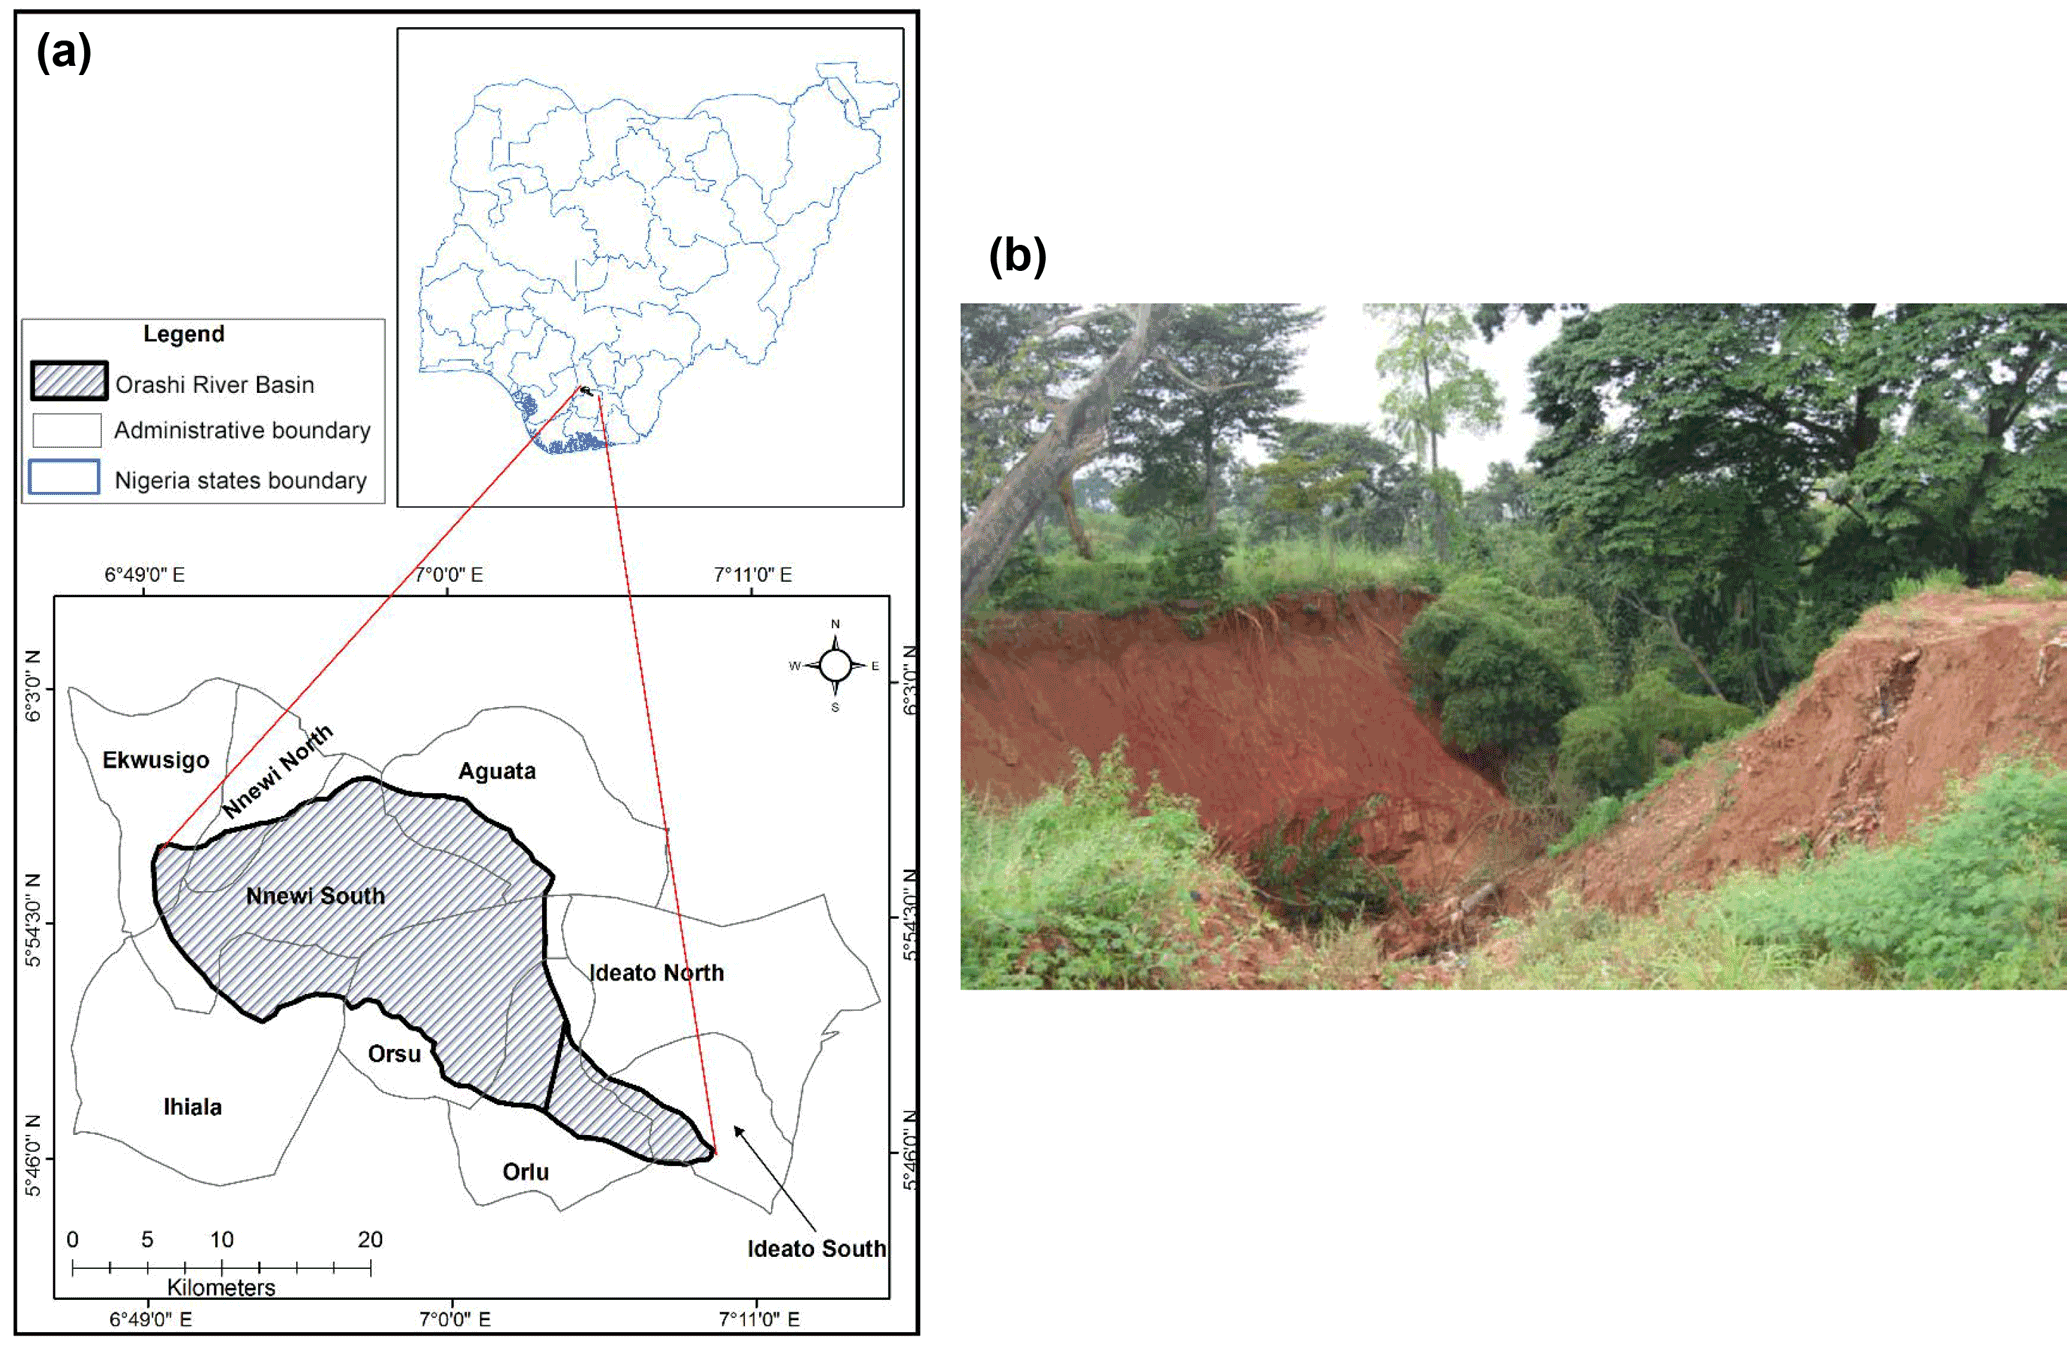
Figure 1(a) Location of study area, Nigeria map inset. (b) View of eroded land within the study area.
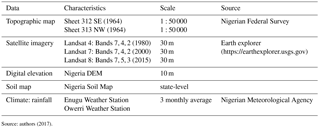
Table 1Data sources, characteristics and processes.
Source: authors (2017).
Data types, characteristics, and sources are shown in Table 1. Based on expert judgment (Tsangaratos and Rozos, 2013), field knowledge and experience, land susceptibility to soil erosion was analysed using the Multi criteria decision analysis (MCDA) (Tsangaratos and Rozos, 2013). This is done by scoring three environmental parameters (slope, soil and land use) based on pre-defined rating. The rating for the class categories (slope, soil and land use) was based on the relative importance of the class or group with respect to soil erosion. The study area was earlier divided into regular grid cells (raster) of 400 m2 each. In addition, the operational susceptibility score of individual parameter (slope, soil and land use) for each cell is taken as the score for the class with the highest coverage within the cell area. In other words, the cell form the mapping unit for land susceptibility to erosion.
3.1 Rainfall data and landuse/landcover
Climatic characteristics affect soil loss/sediment yield within a basin (Suresh, 2008). Rainfall is an important factor affecting erosion owing to its power to detach the soil particles and its ability to produce runoff, which causes erosion and transportation of the eroded material. Rainfall was held constant in our analysis so that other variables would form the basis of our assessment of erosion susceptibility across the basin. As shown in Table 1, the 2015 data was obtained from two nearby weather stations of Enugu and Owerri and were used to interpolate the spatial pattern of the rainfall through the categorization of weather records into four (4) periods based on the wet and dry seasons (DJF, MAM, JJA, and SON). The average aggregate of each of these periods was used to determine the rainfall pattern. The wettest period was subsequently used to determine the susceptibility of the basin to soil erosion.
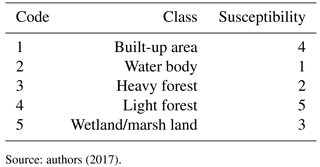
The USGS landuse classification scheme was adopted to classify the various types of landuse/landcover classes on the Landsat imageries. The classification was used for the three periods (scenarios) under investigation (1980, 2000 and 2015). Training dataset was randomly sampled from the spectral signature of each of the imagery to define their respective landuse/landcover type. Five primary classes extracted from the imageries are shown in Table 2. The change detection analysis was performed. The ENVI analytical tool was used to extract the image difference between two periods of time. The five (5) identified land use classes were assigned susceptibility values of 1 to 5 (ranking) where 1 is least susceptible and 5 is highly susceptible land use (Table 2) based on expert judgment.
3.1.1 Slope and soil erodibility factor k
Basin hydrology and flow characteristics by terrain morphologies of aspect, slope, hill shading, elevation, and curvature and drainage pattern were identified using the “Surface Analysis” toolbox. The raster DEM pixels of each of these parameters were extracted using the surface algorithms to quantify and characterize the morphologolic parameter of the basin. Other quantitative variables determined within study area include bifurcation ratio, stream length, stream frequency, circulatory ratio.
Erosion increases with the increase in slope and length of the slope (Garde and Kathyari, 1990); this is due to corresponding increase in the velocity and volume of surface runoff. The slope of the basin was classified into ranges and further reclassified according to their degree of the susceptibility as shown in Table 5. Soil erodibility depends on the texture, aggregate stability, shear strength, infiltration capacity, and organic and chemical contents. The coarser the particles the smaller the value of their erodibility. Similarly, the greater the relative density the less the erodibility (Garde and Kathyari, 1990). Table 3 shows soil erodibility Factor adopted from Garde and Kathyari (1990), while Table 6 shows the erosion susceptibility classification of soil erodibility factor used for this study.
Table 2Classification of the landuse at Orashi River Basin.
Source: authors (2017).
Table 3Soil erodibility factor k.
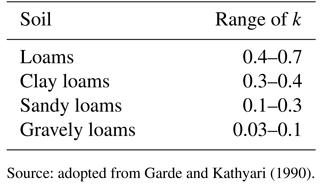
Source: adopted from Garde and Kathyari (1990).
3.1.2 Factor of soil erosion susceptibility integration
Rainfall parameter was held as a constant among the other variables considered for the susceptibility of the basin to erosion. The slope of the basin was classified into ranges and further reclassified according to their degree of susceptibility while the landuse parameter was obtained from the current landuse/landcover pattern. Each of the classes of the landuse was reclassified based on the rate of the sediment generated. The rating of the classes within each parameter was based on the relative importance of each class obtained from field experience and expert knowledge. However, the maximum susceptibility weight/score obtainable for land use was 5, slope was 10 and soil erodibility factor was also10 for each cell. This was based on the fact that both slope and soil erodibility factors are predominantly the physical attributes of the environment while land use on the other hand is human induced catchment management. Any alteration (natural or human) on the physical attribute of the terrain can trigger erosion while landuse can be managed and controlled not to induce erosion. Also, landuse activities that cause erosion do so by impacting either slope or soil erodibility factor. It is based on this domineering impact of slope and erodibility factor in erosion, especially gullying that the score range of slope and erodibility factor were twice that of the land use. The influence of each parameter on the erosion has already been weighted through the expert judgments class scores. The scores were reclasified to a uniform susceptibility rating scale through a combination of the scores at the cell level (i.e. the total susceptibility is the sum of the ranking scores for each component at each grid). Five (5) classes (Table 8) of soil susceptibility (very low susceptibility, low susceptibility, medium susceptibility, high susceptibility and very high susceptibility) were generated and used for mapping. This linear combination approach is one of the best known and most commonly used MCDA methods (Malczewski, 1999; Ayalew et al., 2004; Tsangaratos and Rozos, 2013) for susceptibility analysis. The summing ranking-based scores at cell unit provide the level of exposure of the unit area taken into consideration all parameters leading to erosion at this micro-unit while maintaining the variation in the spatial interplay of the parameters at the macro-level.
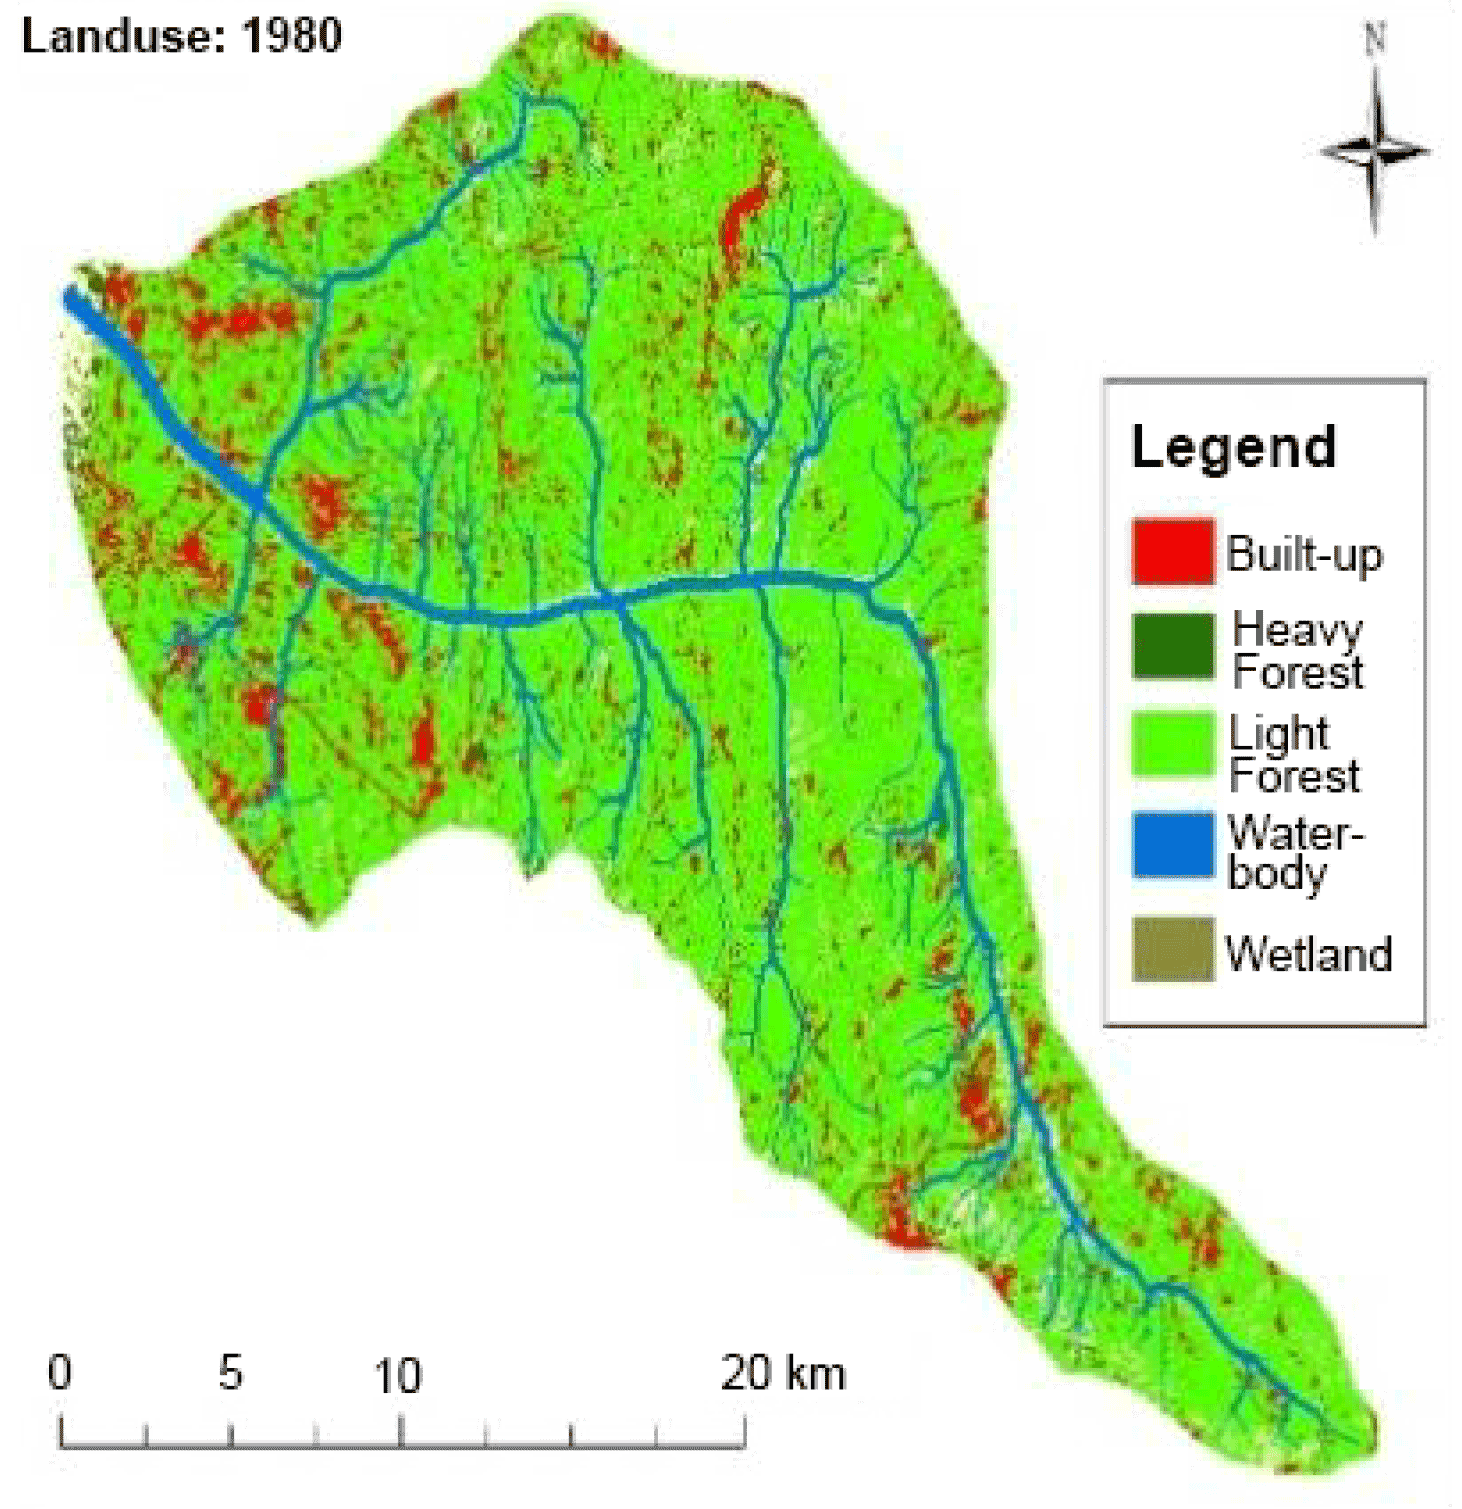
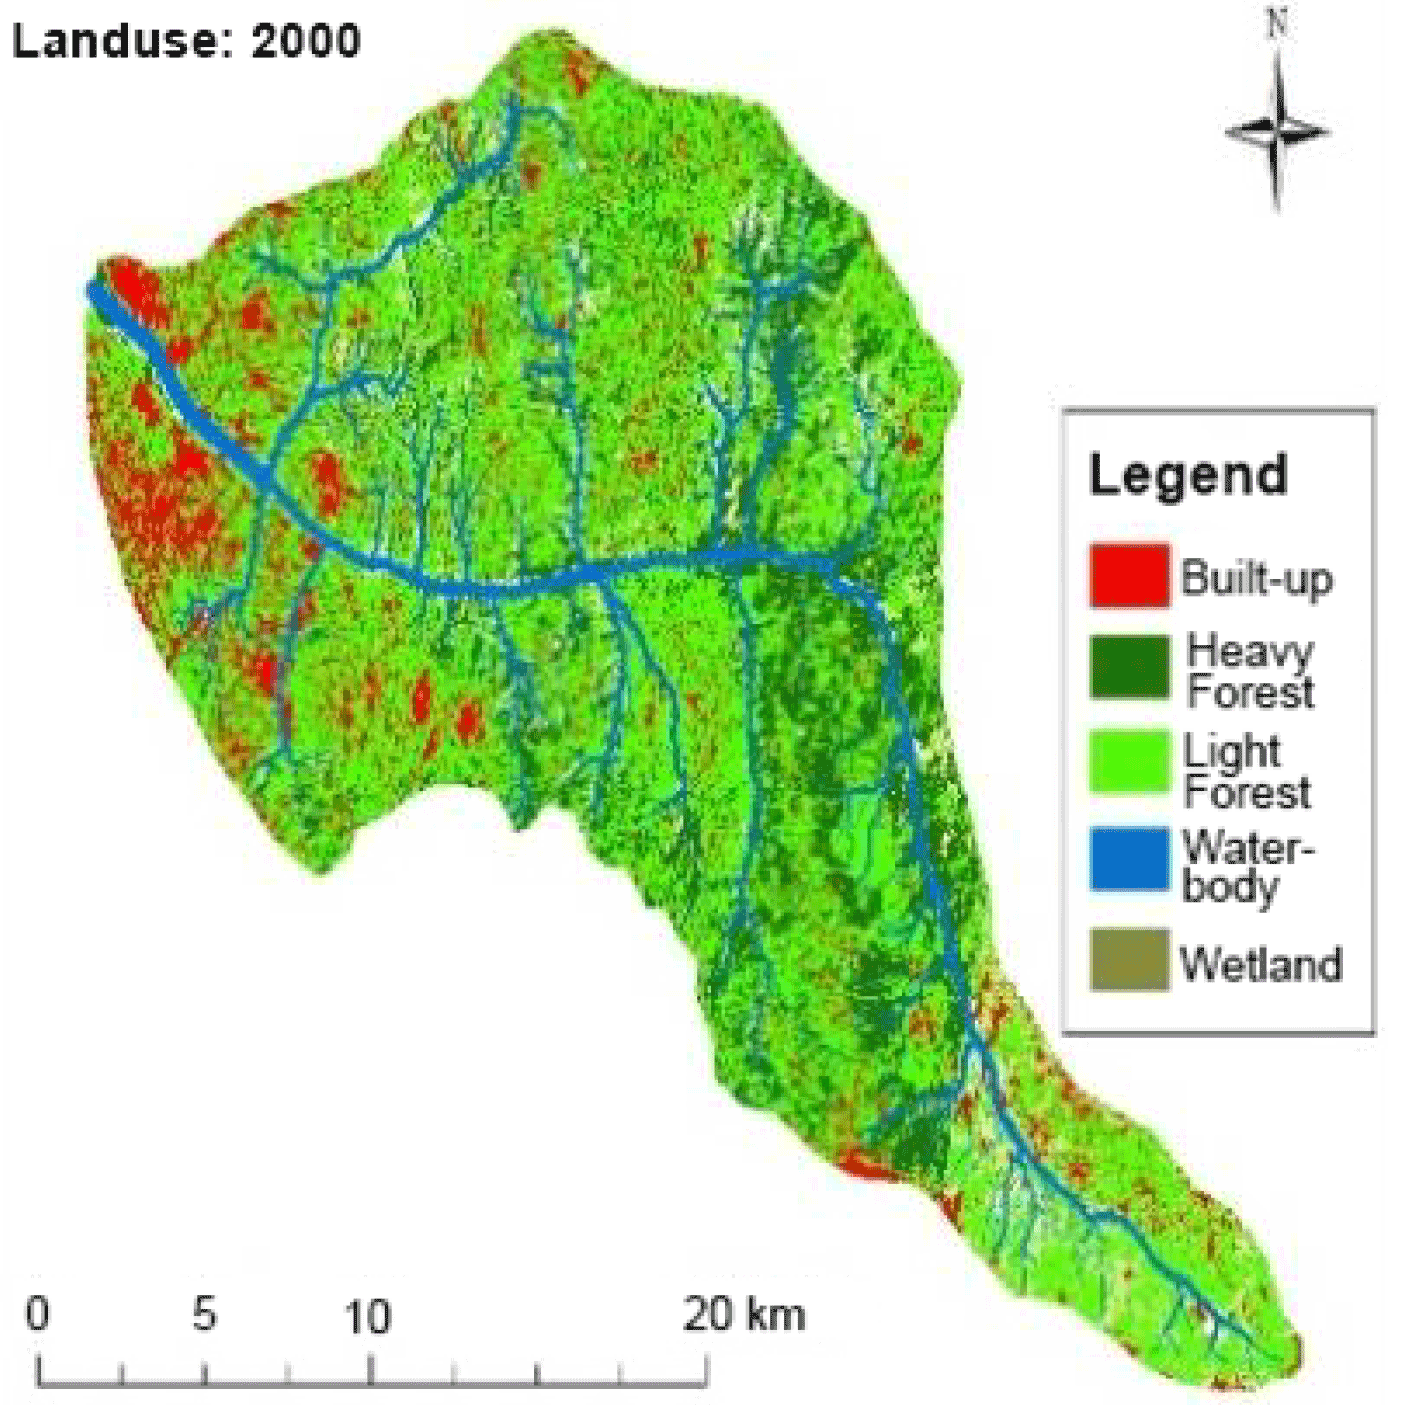
4.1 Analysis of Orashi River Basin landuse/landcover change trajectory
Table 4 shows the landuse/landcover dynamics of the ORB while Figs. 2–4 graphical display the LULC pattern. Five classes of land uses; built-up (area), water body, wetland, light and heavy forest vegetations were identified. The Dominant light forest vegetation at the base year had witnessed a continuous decrease (Ochege and Okpala-Okaka, 2017) from 336.41 km2 (81.33 %) to 303.71 km2 (73.43 %) and 280.82 km2 (67.89 %) in 2000 and 2015 respectively. Massive decrease occurred between 1980 and 2000 (2 decades) with an annual decline of about 1.65 km2. Between 2000 and 2015, about 23 km2 was lost with an annual decrease of 1.53 km2. The decrease in the forest vegetation is strongly connected to the increase in the population of the study basin, hence, the high demand for residential and arable lands (Lal et al., 1992) as reflected in the built-up areas which increased in a trajectory mode from 26.49 km2 in 1980 to 79.24 km2 in 2015. Within 35 years (1980–2015), the light forest vegetation decreased from 81.33 to 67.89 % of the total land area of ORB.
Conversely, the increase in the wetland from 6.78 % (1980) to 9.67 % (2015) could be linked to bank erosion where areas that were either light forest or heavy forest are eroded to become wetland. Also, river siltation increases wetland area by depositing sediments from the upland in the river course, thereby, reducing the water body to the wetland area. In other words, the increase in the expanse of the wetland must have been aided by floodplain deposition of the eroded soil due to the reduced velocity that decreases the transportation potency of the rivers. The increase in the built-up lands from 26.29 km2 (6.4 %) in 1980 to 79.24 km2 (19.2 %) in 2015 at an annual growth rate of 1.51 km2 shows an evidence increase in population (Igbokwe et al., 2013). Significant and highest annual growth rate of 2.04 km2 occurs between 2000 and 2015 without predesign layout or any form of developmental plan whatsoever. This, however, has increased the contribution of anthropogenic activities especially the built-up landuse to soil erosion in the environment.
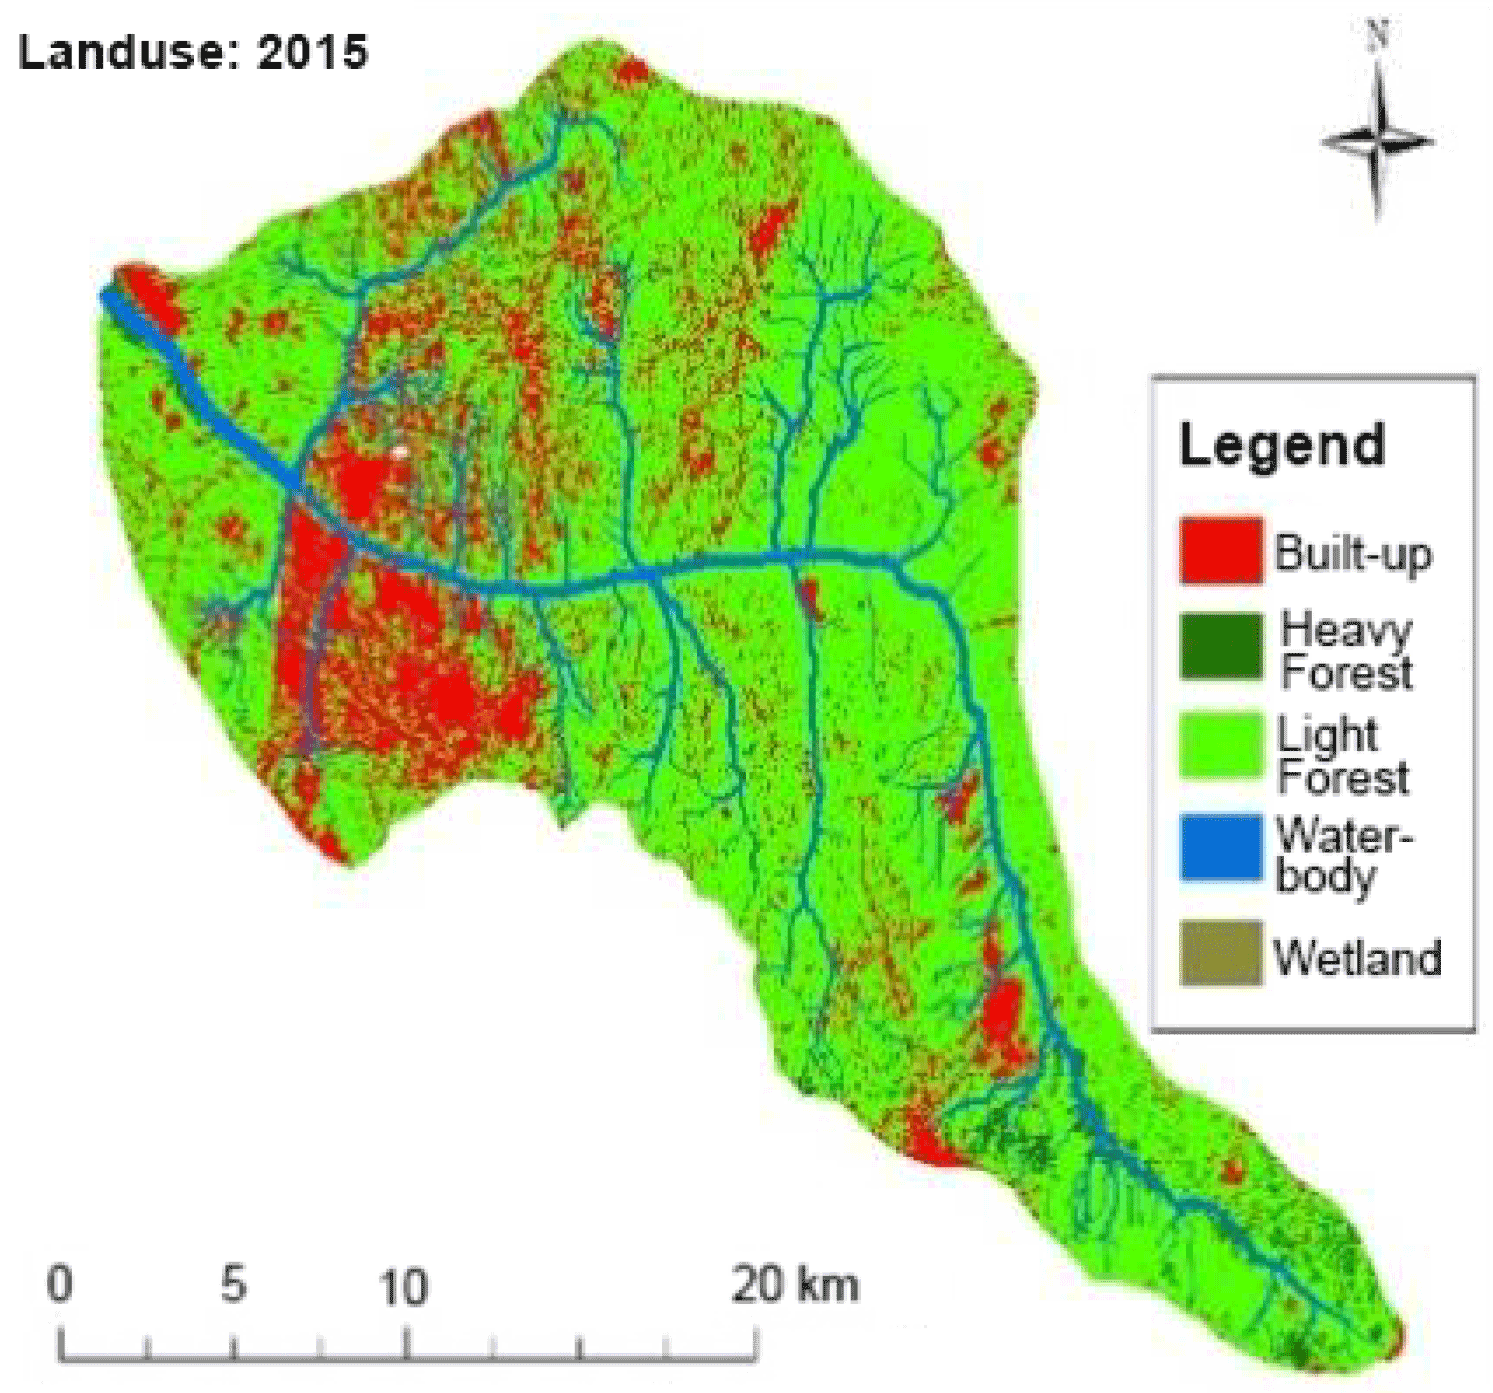
The insignificant change in the heavy forest vegetation (0.29 %) for the thirty years period could be linked to tradition and culture of the people of Nnewi, which hold thick forests as sacred where spiritual artifacts (shrines) reside and where other religious or traditional activities take place. However, between 2000 and 2015, a drastic change was observed where the heavy forest vegetation decreased (Ochege and Okpala-Okaka, 2017) from 22.28 to 13.53 km2 at an annual decrease of 0.58 km2, the recent pressure on the heavy forest may be owing to the population increase and degraded soil of the light forest vegetation, hence, the need for more agricultural fertile/productive lands.
Table 5Slope erosion susceptibility classification.
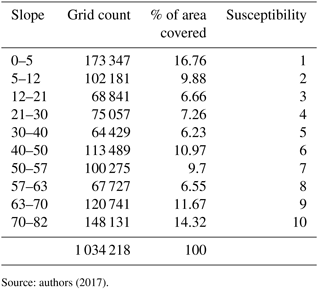
Source: authors (2017).
The dominant landcover within the study area is the light forest vegetation, however, it is highly susceptible to further depletion and degradation with corresponding surface soil loss of the basin.
Table 6Soil classification and erodibility of Orashi.
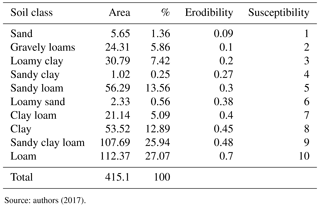
Source: authors (2017).
4.1.1 Morphological characteristics of Orashi River Basin
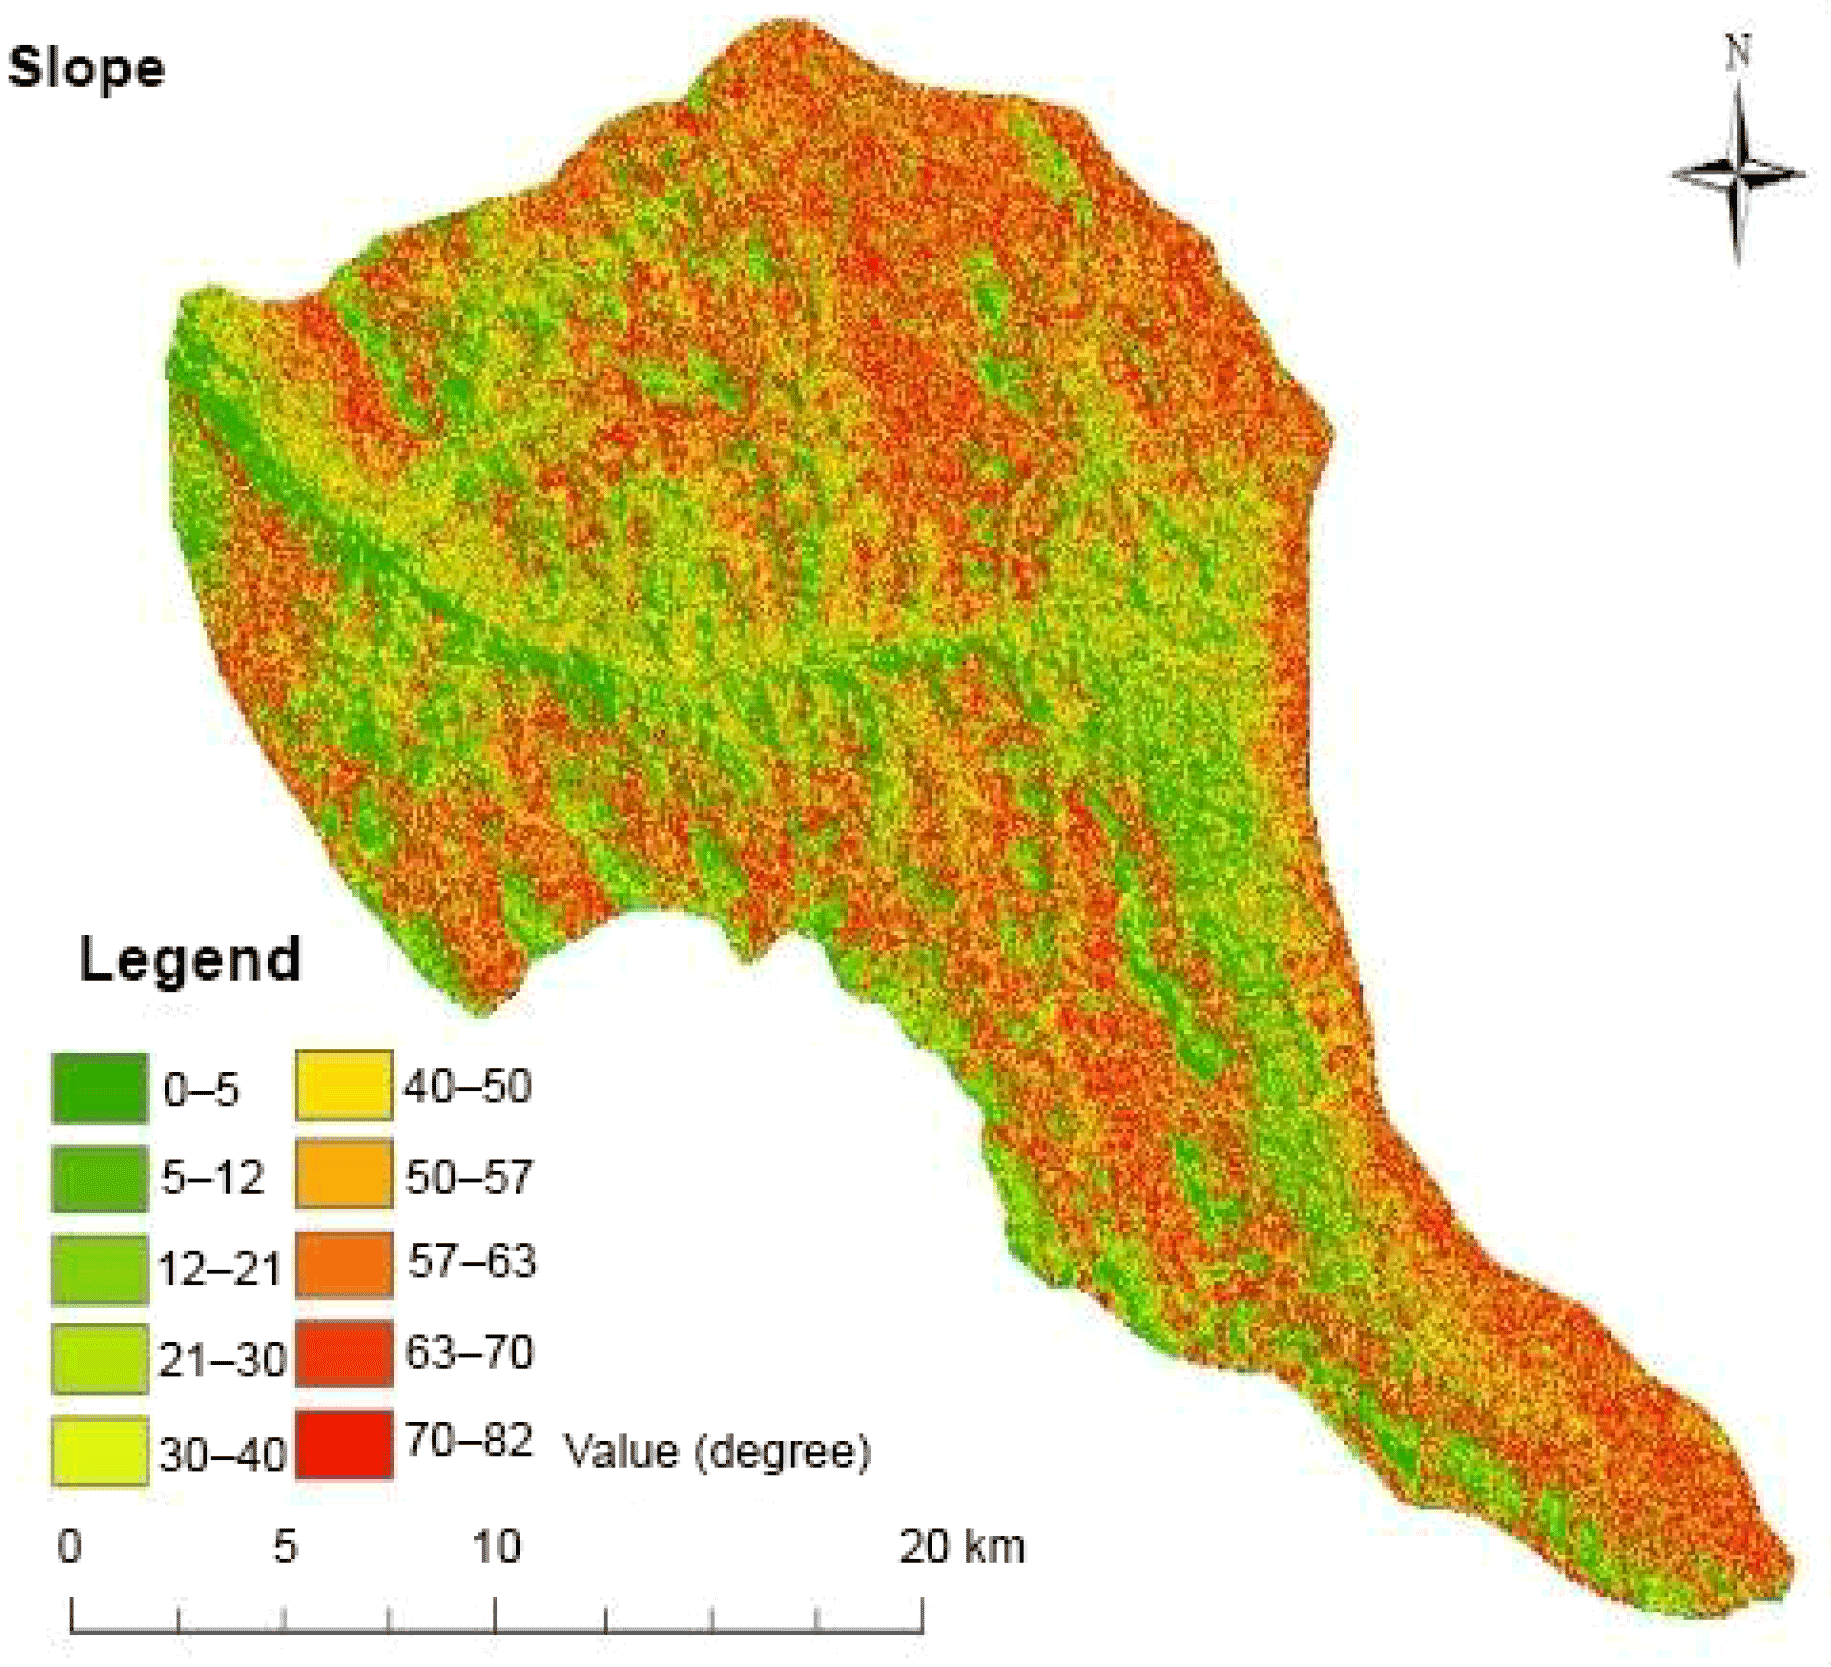
The slope describes the rate of river dissection within the basin and also determines the rate of soil erosion. In other words, soil erosion increases as the slope increases. Table 6 and Fig. 5 show the slope characteristics of the basin as derived from the grid codes percentage. Three categories of the erosional processes were found according to this classification. Slopes within 70–82∘ (14.32 %), 63–70∘ (11.67 %), 57–63∘, (6.55 %), 50–57∘ (9.70 %) and 40–50∘ (10.97 %) are categorized as the highest slope. This indicates a slope of active erosional processes. The second category is classified as a slope of medium erosional processes, which ranges 30–40∘ (6.23 %), 21–30∘ (7.26 %) and 12–21∘ (6.66 %). The last category describes a slope of low erosional processes. This slope is relatively flat and found in area of deposition such as river mouth and river channel. The slope ranges between 5–12∘ (9.88 %) and 0–5∘ (16.76 %).
4.1.2 Susceptibility of Orashi Basin to soil erosion
Slope susceptibility
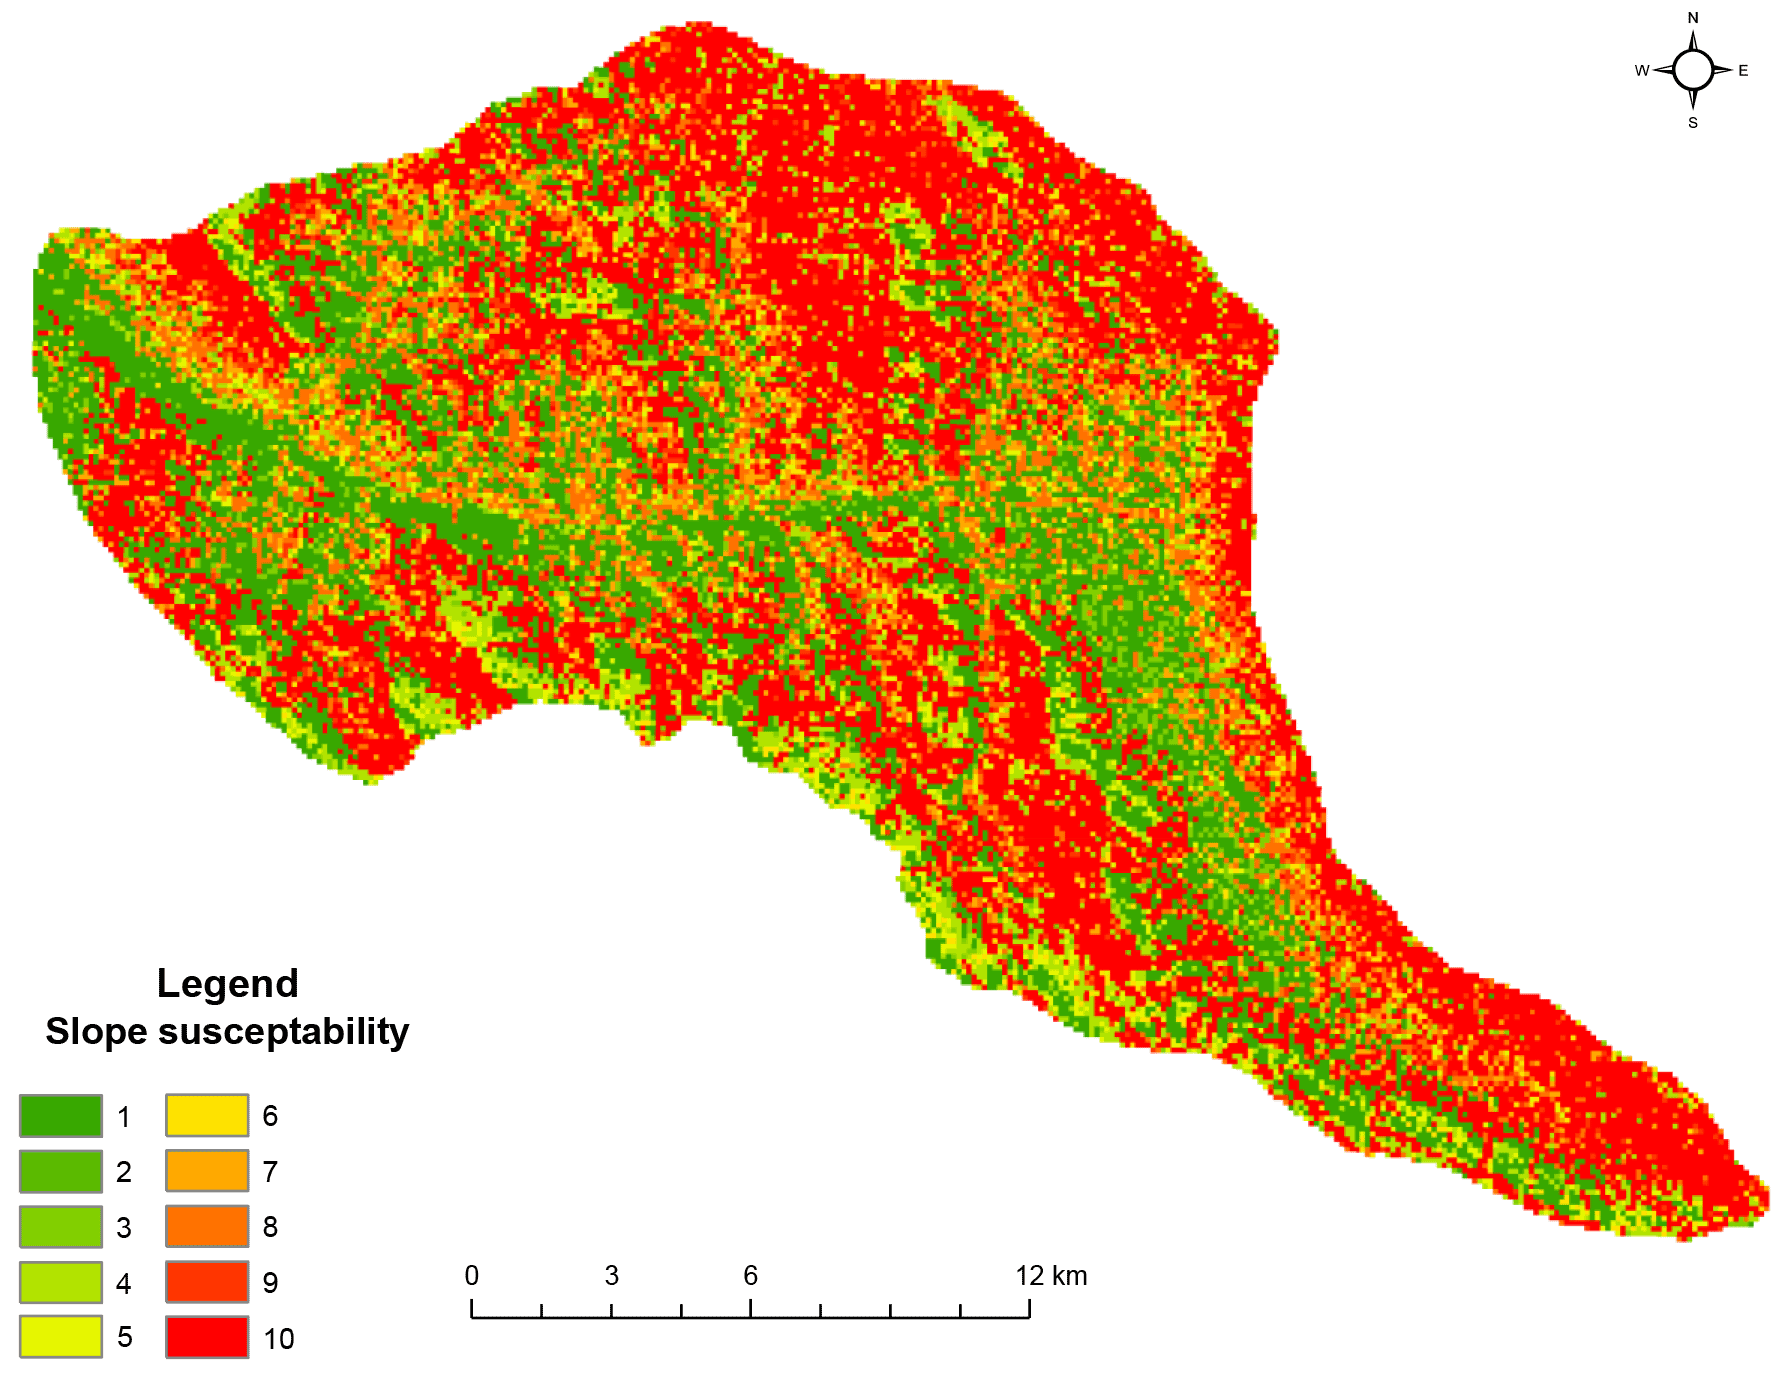
Orashi basin slope classifications and their level of susceptibility are shown in Table 5. Ten (10) classes of susceptibility levels were identified. Slope within 0–5∘ which covers about 16.76 % of the basin has a level 1 value (Fig. 6). This indicates that at this level erosion activities is minimal, site specific and low impact while at slope within 70–82∘, about 14.32 % falls within highest erosion susceptibility level (Akbarimehr and Jalilvand, 2013; Zhang et al., 2015) of Level 10. This indicates that the rate of soil erosion is very intensive and a lot of top soils are freely removed as shown in Fig. 6.
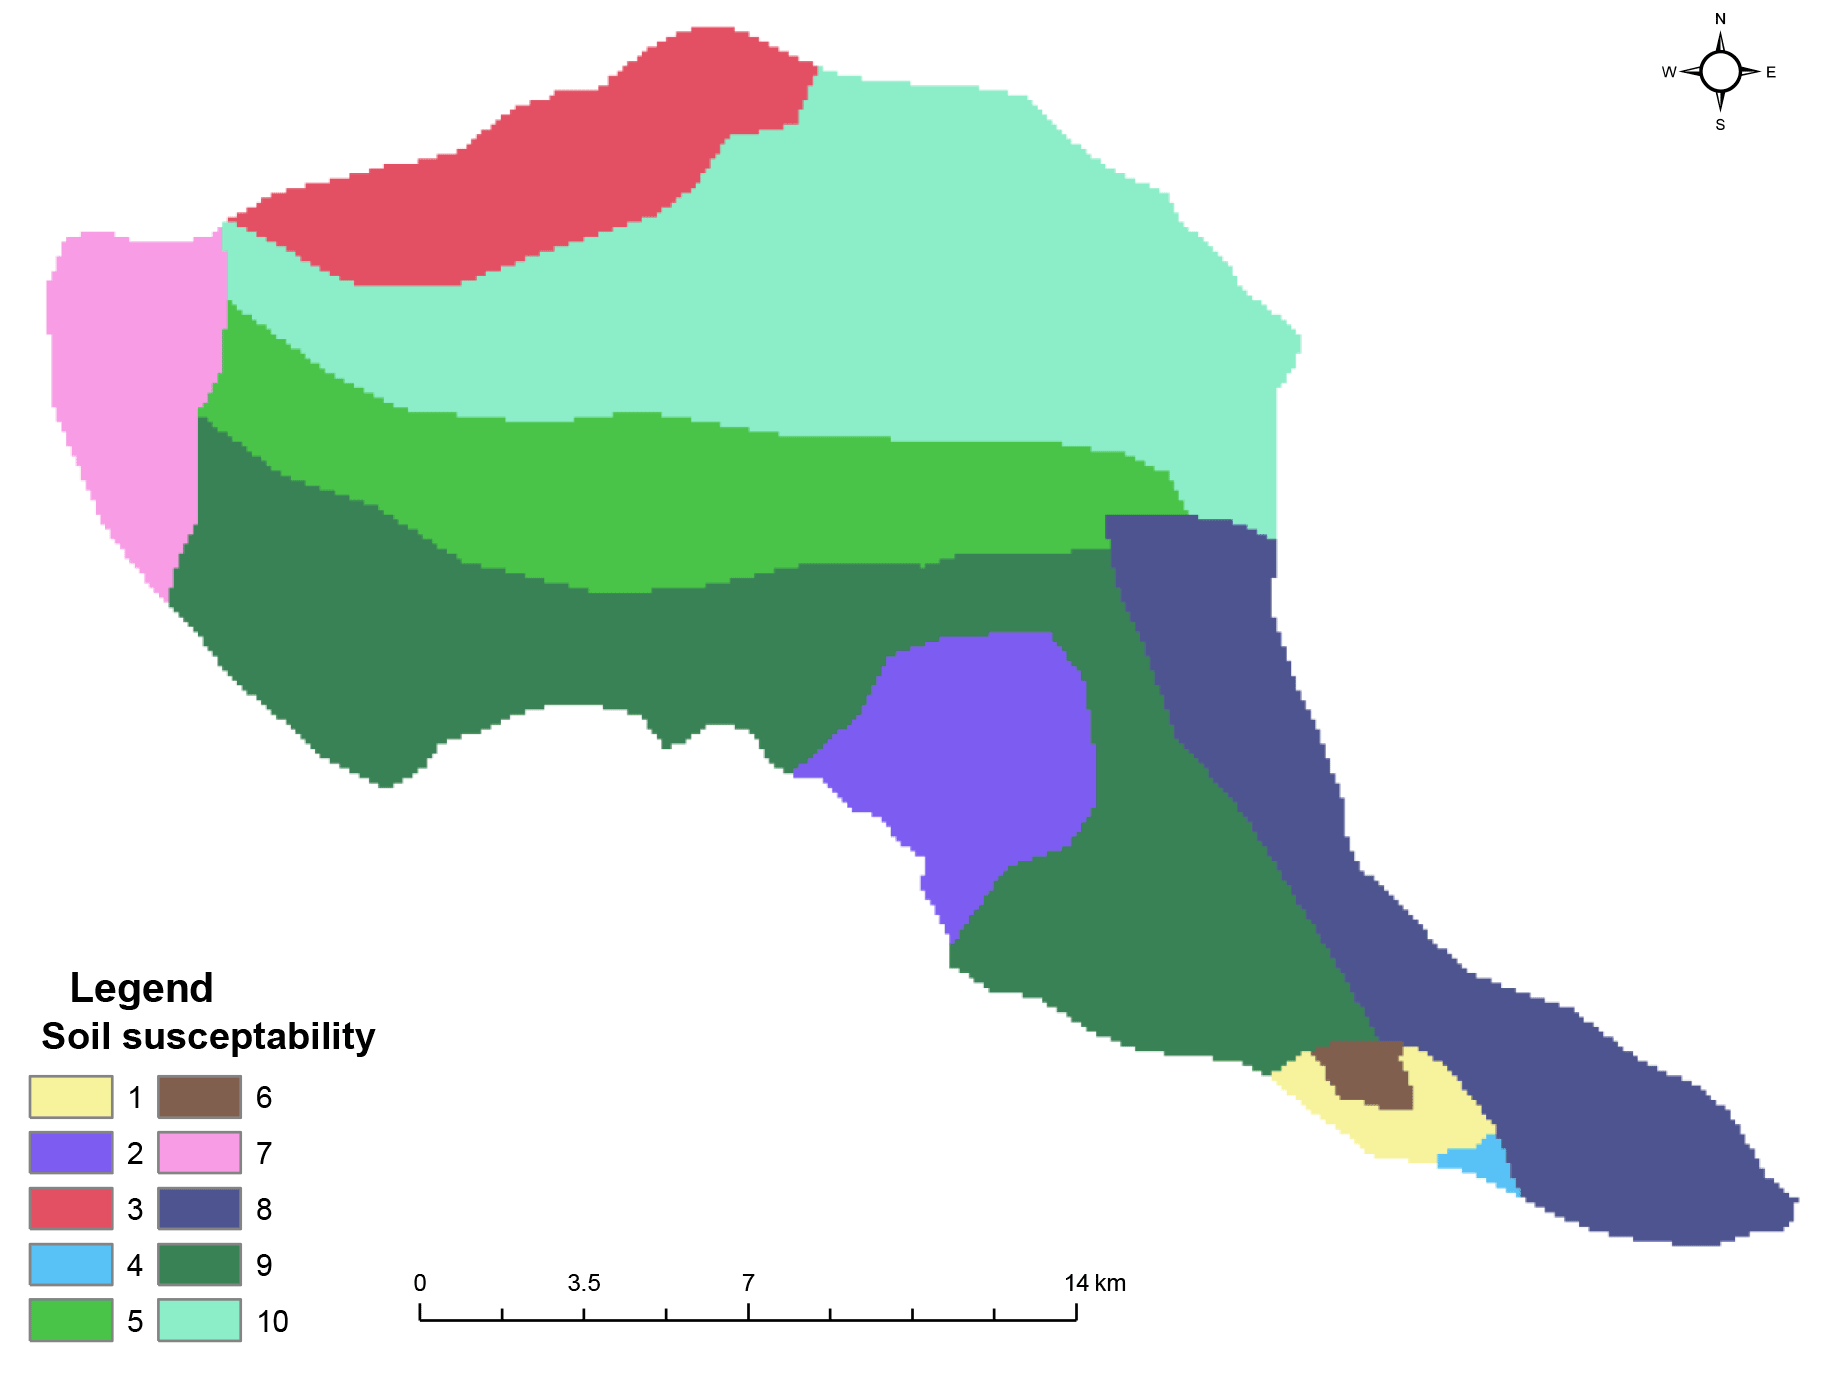
Soil erodibility and susceptibility
The soil types within the basin were dominated by sandy clay loam (25.94 %) and loam (27.07 %) Table 6. In other words, the basin is layered by fertile soil good for agricultural activities. These dominant soil classes (sandy clay loam and loam) have erodibility of 0.48 and 0.7 respectively with high susceptibility of 9 and 10 levels respectively. These implies a high fragility to soil erosion. Figure 7 shows the soil susceptibility classification of Orashi Basin.
Table 7Landuse erosion susceptibility classification.
Source: authors (2017).
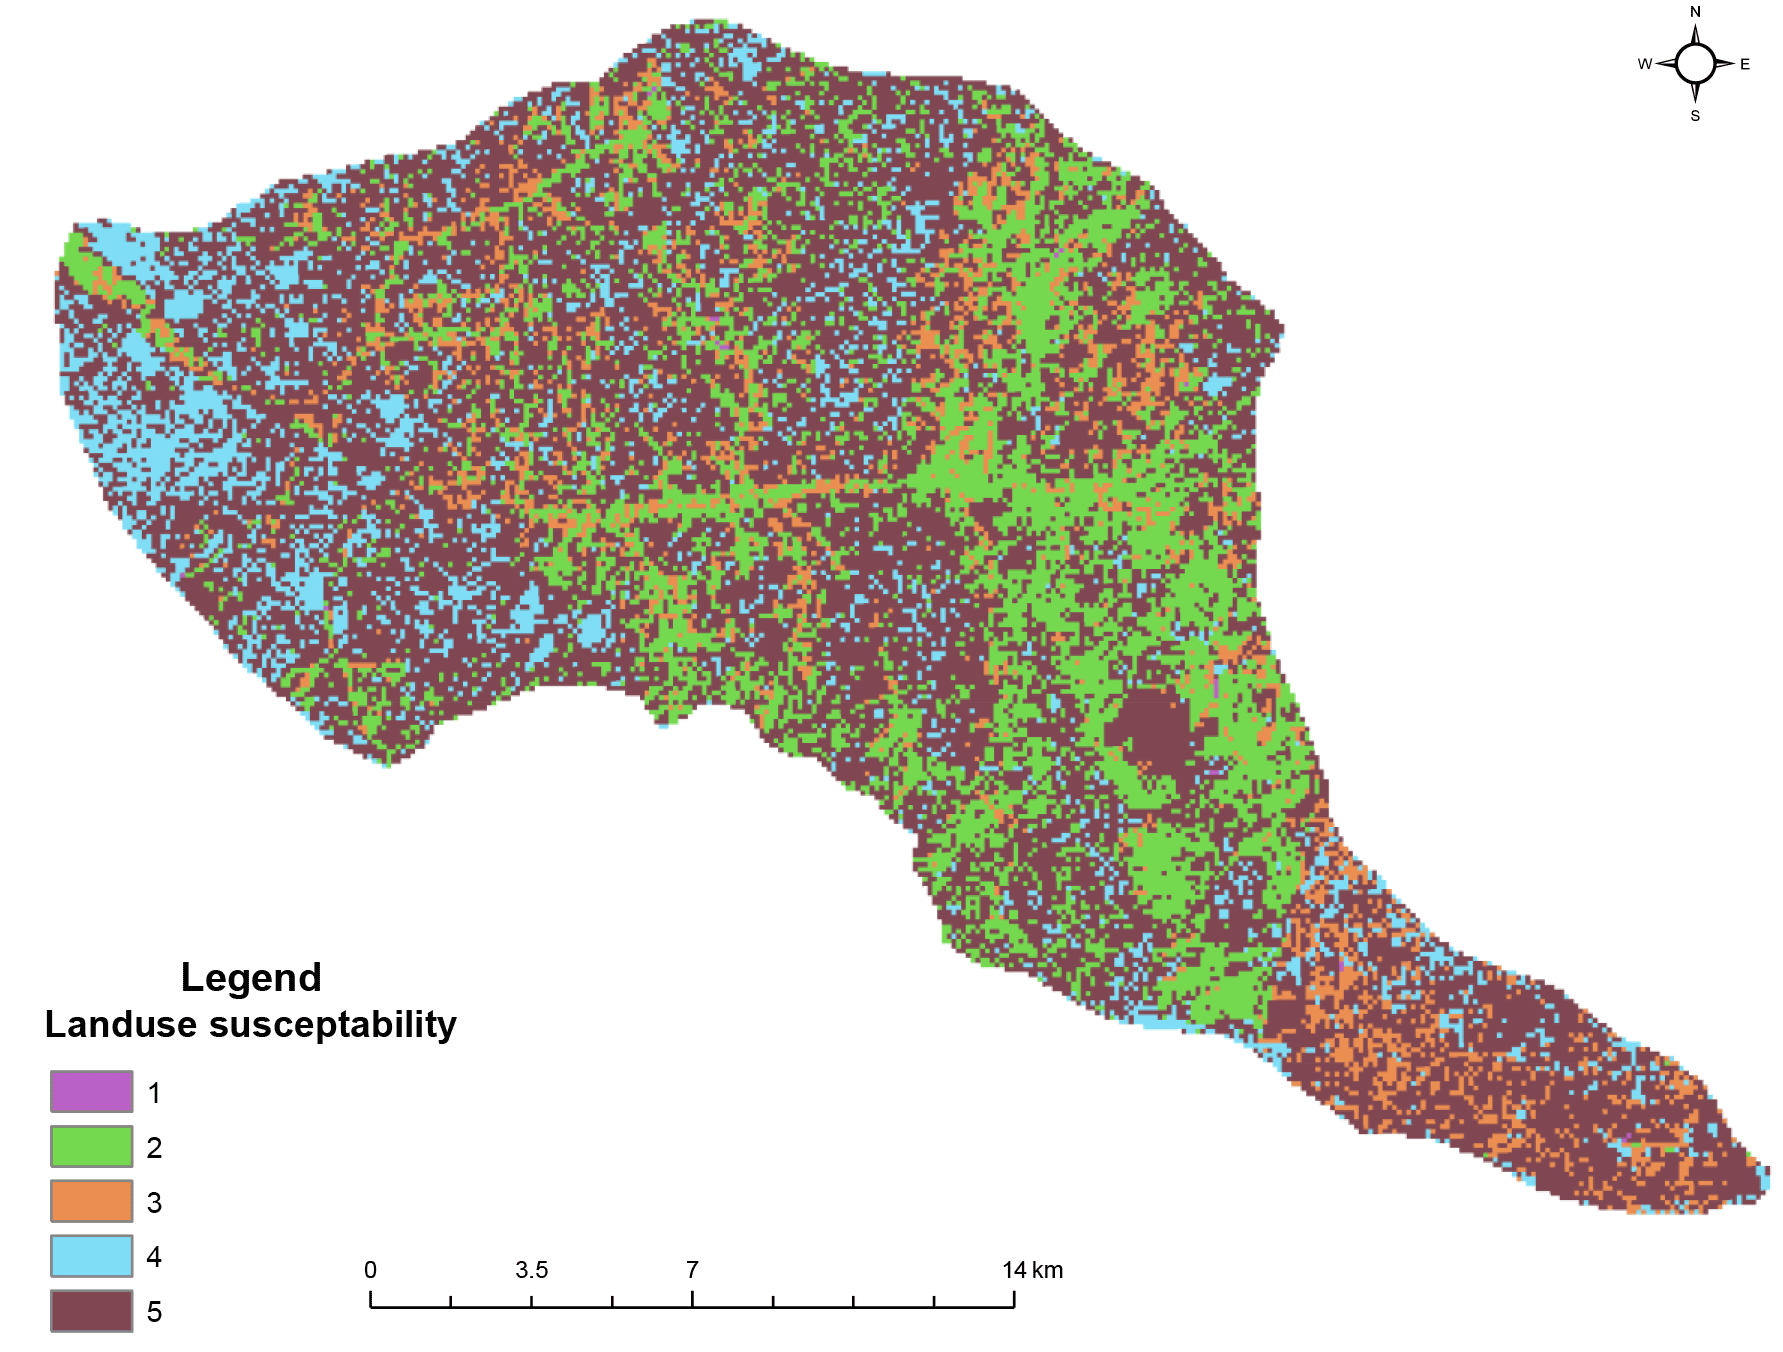
Table 8Basin areas susceptible to erosion.
Source: authors (2017).
4.1.3 Landuse susceptibility
Table 7 shows the landuse of the basin with their degrees of susceptibilities; light forest (280.80 km2, 67.89 %) has the highest susceptibility value of level 5. This is followed by built-up area (79.24 km2, 19.16 %) which has a susceptibility value of level 4. Other LULC are wetland (level 3), heavy forest (level 2), and water body (level 1) with their respective coverage of 39.98, 13.53, and 0.04 km2 respectively. Figure 8 shows the landuse susceptibility classification.
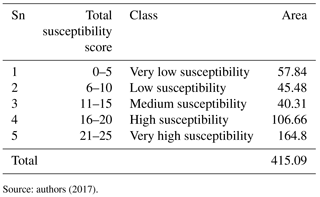
4.1.4 Susceptibility of the basin to soil erosion
The overall susceptibility of the basin through variables integration using overlay analysis in GIS environment was performed by converting variables scores in the grid (400 m2 raster format) and the Math Raster Calculator is used to sum up the aggregate score for each cell and to assign the cell to soil erosion susceptibility class areas as shown in Table 8. The result reveals that about 164.8 km2 (39.7 %) of the ORB is highly susceptibility to soil erosion. These susceptibility levels are: very low (5–9), low (10–13), medium (14–15), high (16–19) and very high (20–25) Table 8 and Fig. 9. In each of these classes, however, Ihemeposi community falls within very low susceptibility, Ozu and Okohia communities fall within low susceptibility, Upor and Azra (medium susceptibility), Ozubulu and Uruobo Okija high susceptibility while Otu, Osu, Ezinifite and Akwa communities falls under very high susceptibility. Consequent upon this, these variables were converted into grid (raster format: 400 m2) and combine together using Math Raster Calculator to determine the areas that are susceptible to soil erosion.

The study reveals that a substantive expanse of the ORB area is susceptible to soil erosion and land degradation. The over 50 % catchment area that falls under high susceptibility has serious negative implications on the land utilization and surface water uses in terms of water quality and downstream siltation. Also, these have great consequences on the biodiversity and ecosystem services, including the domestic use of water and subsistence farming. However, an increase in population and its ancillary developmental activities requires more land area for cultivation so as to ensure sustainable food supply and subsistence livelihoods. If these needs are to be met in a sustainable way, there would be a need to change the present land use practices to a more integrated system that would relate all activities to the basin development. It is also recommended that public awareness on soil/land conservation, strategic planning and land management be embarked upon.
Links to the USGS Satellite Imagery and Digital Elevation Model (DEM) data are available at Earth explorer (https://earthexplorer.usgs.gov). Other data such as soil, weather, and topographic maps could not be accessed publicly or online (website) for reasons best known to the custodians of these data in Nigeria.
SO conceptualized and led the team on this research. In addition to the leadership and technical roles he played, he also designed the paper layout. AA prepared the manuscript and effected corrections made during the course of the write-up. NI gathered and processed all the spatial data used for this article. OA reviewed the article from time to time for necessary corrections and also serves a “liaison” officer between the research team and Copernicus (IAHS).
The authors declare that they have no conflict of interest.
This article is part of the special issue “Water security and the food–water–energy nexus: drivers, responses and feedbacks at local to global scales”. It is a result of the IAHS Scientific Assembly 2017, Port Elizabeth, South Africa, 10–14 July 2017.
Authors wish to express their profound gratitude to the Office of Surveyor
General of the Federation (OSGOF) and Nigeria Meteorological Agency (NIMET)
for providing the topographical maps and weather data respectively. Our
thanks also go to the Department of Geography, University of Lagos for
providing enabling environment which facilitated putting this work together.
The assistance and support privileged by the staff of Nnewi South Local
Government Area of Anambra State during the field data gathering is also
acknowledged.
Edited by: Barry Croke
Reviewed by: two anonymous referees
Akbarimehr, M. and Jalilvand, H.: Considering the relationship of slope and soil loss on skid trails in the north of Iran (a case study), Journal of Forest Science, 59, 339–344, 2013.
Ayalew, L., Yamagishi, H., and Ugawa, N.: Landslide susceptibility mapping using GIS-based weighted linear combination, the case in Tsugawa area of Agano River, Niigata Prefecture, Japan, Landslides, 1, 73–81, 2004.
FAO/UNEP: The Future of Our Land, Guidelines for Integrated Planning for Sustainable Management of Land Resources, FAO (Rome), UNEP (Nairobi), 1999.
Garde, R. J. and Kathyari, U. C.: Erosion prediction models for large catchments, in: Proceedings of the International Symposium on Water Erosion, Sedimentation, and Resource Conservation, Dehradun, India, 89–102, 1990.
Igbokwe, J. I., Ezeomedo, I. C., and Ejikeme, J. C.: Identification of urban sprawl using GIS Technique: A case study of Onisha and its environs in south east, Nigeria, International Journal of Remote Sensing & Geoscience, 2, 41–49, 2013.
Karamouz, M., Hashemi Olya, R., Moridi, A., and Ahmadi, A.: Water Allocation from River System Considering the Interaction between River and Aquifer, ASCE Environmental and Water Resources Institute Conference, Delhi, India, 2006.
Lal, R., Ghuman, B. S., and Shearer, W. A.: Cropping systems effects of a newly cleared Ultisol in Southern Nigeria, Soil Technol., 5, 27–38, 1992.
Malczewski, J.: GIS and Multicriteria Decision Analysis, John Wiley and Sons, New York, 1999.
Nwajide, S. C. and Hoque, M.: Gullying processes in south-eastern Nigeria, The Nigerian Field, 44, 64–74, 1979.
Ochege, F. U. and Okpala-Okaka, C: Remote Sensing of vegetation cover changes in the humid tropical rainforest of south-eastern Nigeria (1984–2014), Cogent Geoscience, 3, 1307566, https://doi.org/10.1080/23312041.2017.1307566, 2017
Ofomata, G. E. K.: Soil Erosion in Nigeria: The Views of a Geomorphologist, University of Nigeria, Nsukka, Nigeria, Inaugural Lecture Series No. 7, 3–33, 1985.
Ofomata, G. E. K.: Classification of Soil Erosion with Specific reference to Anambra State of Nigeria, Environ. Rev., 3, 252–2551, 2000.
Oyegun, C. U.: The management of coastal zone erosion in Nigeria, Ocean and Shoreline Management, 14, 215–228, https://doi.org/10.1016/0951-8312(90)90035-G, 1990.
Suresh, R.: Watershed Hydrology, Standard publishers, New Delhi, India, 2008.
Tsangaratos, P. and Rozos, D: Producing landslide Susceptibility maps by applying expert knowledge in a GIS – based environment, Bulletin of the Geological Society of Greece, XLVII, 2013.
Zhang, Z., Sheng, L., Yang, J., Chen, X.-A., Kong, L., and Wagan, B.: Effects of Land Use and Slope Gradient on Soil Erosion in a Red Soil Hilly Watershed of Southern China, Sustainability, 7, 14309–14325, https://doi.org/10.3390/su71014309, 2015.