
the Creative Commons Attribution 4.0 License.
the Creative Commons Attribution 4.0 License.
 | 16 Sep 2026
A remote sensing–based approach to the regionalization of socioeconomic indicators in an agricultural headwater catchment in Northern Benin
Yaovi Aymar Bossa

Adjo Brigitte Bossa
Yacouba Yira
Kpade Ozias Laurentin Hounkpatin
Octave Djangni
Jean Hounkpè
Hélyette Arielle Odoumbourou
Ernest Amoussou
The agroecosystems of the rural continuum of the Sudano-Sahelian region of the Volta River Basin are undergoing severe degradation, resulting in serious declines in ecosystem service capacities and weakening community livelihoods, as agriculture remains the primary source of income in the region. This degradation is mainly driven by poor management of hydroclimatic risks, non-adapted agricultural practices characterized by intensive use of chemical fertilizers and pesticides, and insufficient consideration of spatial heterogeneity in decision-making processes. The objectives of this study are (i) to identify a Network of 30 m resolution Grid Cells (NGC) representative of the spatial heterogeneity of the studied agroecosystem – the Dassari headwater catchment (550 km2), a tributary of the Volta River in northern Benin – and (ii) to regionalize plot-scale socioeconomic data to support improved decision-making. The NGC was derived by combining iterative principal component analysis (IPCA) with a Conditioned Latin Hypercube Sampling (CLHS) approach using 37 satellite-derived variables (e.g. Normalized Difference Vegetation Index, saturation index, coloration index), resulting in the selection of 150 grid cells. Field and laboratory investigations provided soil properties (e.g. texture, carbon, field capacity, nitrogen content) and socioeconomic data (e.g. harvest quantity, input costs, total production cost, and gross income), which were standardized and analyzed for major crops (millet, sorghum, maize, and cotton). Results show that natural spatial disparities among NGC cells translate into additional labor and input costs that may be unsustainable for farmers. Multiple linear regression models were developed to relate socioeconomic indicators to soil and remote sensing variables for each crop type, and the resulting regional models proved robust, with predicted and observed values closely aligned within the 95 % confidence interval, coefficients of determination exceeding 70 %, and p-values below 0.01.
- Article
(3928 KB) - Full-text XML
- BibTeX
- EndNote


Agricultural ecosystems are increasingly experiencing severe degradation in their capacity to provide services for agricultural production and environmental maintenance (Dupras et al., 2013), mainly due to poor agricultural practices and inadequate land management, resulting in declining soil fertility. Land degradation is intensifying worldwide and affects approximately 1.5 billion people who directly depend on degrading land (Bai et al., 2008). The productive capacity of land is inherently constrained by climatic conditions, physical properties, and land-use and management practices (Igué, 2000).
In this context, reliable mechanisms for monitoring and evaluating agricultural production systems are urgently needed to support sustainable agricultural policies. However, agricultural, conservation, and restoration policies often fail to adequately account for spatial heterogeneity and are rarely updated using long-term observations of representative sites. Continuous monitoring of agricultural environments is therefore essential, particularly under climate change, whose impacts vary spatially and directly affect soils, water regimes, and agricultural production systems.
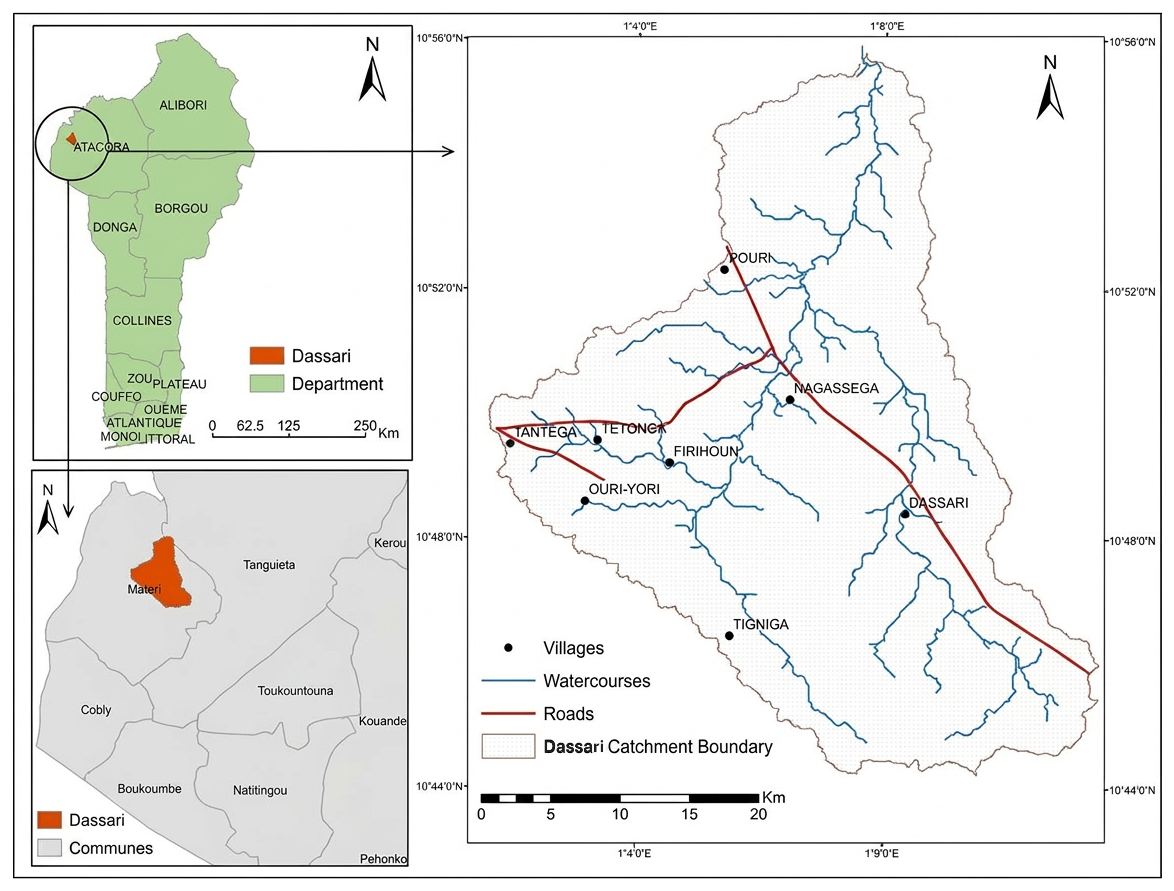
Figure 1Geographic localization of the Dassari catchment.
In northwestern Benin (Atacora), where nearly 92 % of the population relies on agriculture (Institut National de la Statistique et de l'Analyse Économique (INSAE), 1994), soil degradation has reached critical levels. The disappearance of fallow systems traditionally used for soil fertility restoration, combined with uncertain yields and increasing population pressure, has seriously undermined agricultural sustainability (Srivastava et al., 2012). These conditions call for in-depth analysis of interactions between climate change, land-use dynamics, agro-ecosystem services, and socio-economic factors, supported by long-term monitoring and detailed system characterization.
Addressing these challenges requires robust methodologies integrating field measurements and satellite data to accurately characterize agro-ecosystem processes and functions (Holleran et al., 2015; National Research Council et al., 2010). In this study, representative agricultural plots are identified using conditioned Latin Hypercube sampling, a stratified random approach ensuring optimal coverage of multivariate environmental variables and widely applied in soil mapping and environmental monitoring (Minasny and McBratney, 2006). This framework enables the analysis of agro-ecosystem services across landscape heterogeneity by monitoring multidisciplinary variables such as erosion, soil moisture, nutrient fluxes, crop yields, production costs, farm income, and perceptions of climate change and adaptation strategies.
Although such sampling and monitoring approaches are not new, they have demonstrated their effectiveness for variogram analysis (Pettitt and McBratney, 1993), spatial interpolation (McBratney et al., 1981; van Groenigen et al., 1999), and predictive modeling using auxiliary variables (Hengl et al., 2003; Lesch et al., 1995). The main objective of this study is therefore to implement a multidisciplinary framework for long-term agricultural monitoring that integrates geospatial and statistical techniques to identify representative grid cells of catchment agro-ecosystem heterogeneity and to regionalize plot-scale (the scale of the individual agricultural parcel managed by a farmer) biophysical and socio-economic characteristics using satellite-derived variables, notably Landsat 8. This may lead to prediction models highly demanded by decisions makers (including crops production planers and insurers) for better plannings.
2.1 Study Area
The Dassari catchment is a headwater catchment of the Volta River located in the Commune of Matéri, northwestern Benin (Atacora Department), between 10°44′30′′ and 10°55′30′′ N and 1°04′00′′ and 1°08′00′′ E (Fig. 1). The catchment covers an area of 550 km2 and includes the villages of Nagasséga, Tétonga, Ouri-yori, Pouri, Tantéga, Tigniga, Dassari, and Firihoun. The climate is Sudanian with a unimodal rainfall regime, characterized by a dry season from November to April and a rainy season from May to October. The dry season is marked by the harmattan (November–February) and high temperatures in March–April, while the rainy season, which determines the agricultural calendar, peaks in August and September. Mean annual rainfall is approximately 1000 mm, unevenly distributed, and runoff is mainly conveyed by temporary streams.
The catchment consists of a moderately sloping plain (100–250 m) developed on Voltaian shale and sandstone, with an average slope of about 0.4 %. It is drained by the Pendjari River and its tributaries, including the Boualapora, Houangou, and Boualahon. Soils are dominated by ferruginous leached concretion and indurated soils, as well as hydromorphic soils, all highly vulnerable to degradation, leading to reduced agricultural productivity.
Table 1Description of indices and formulas.
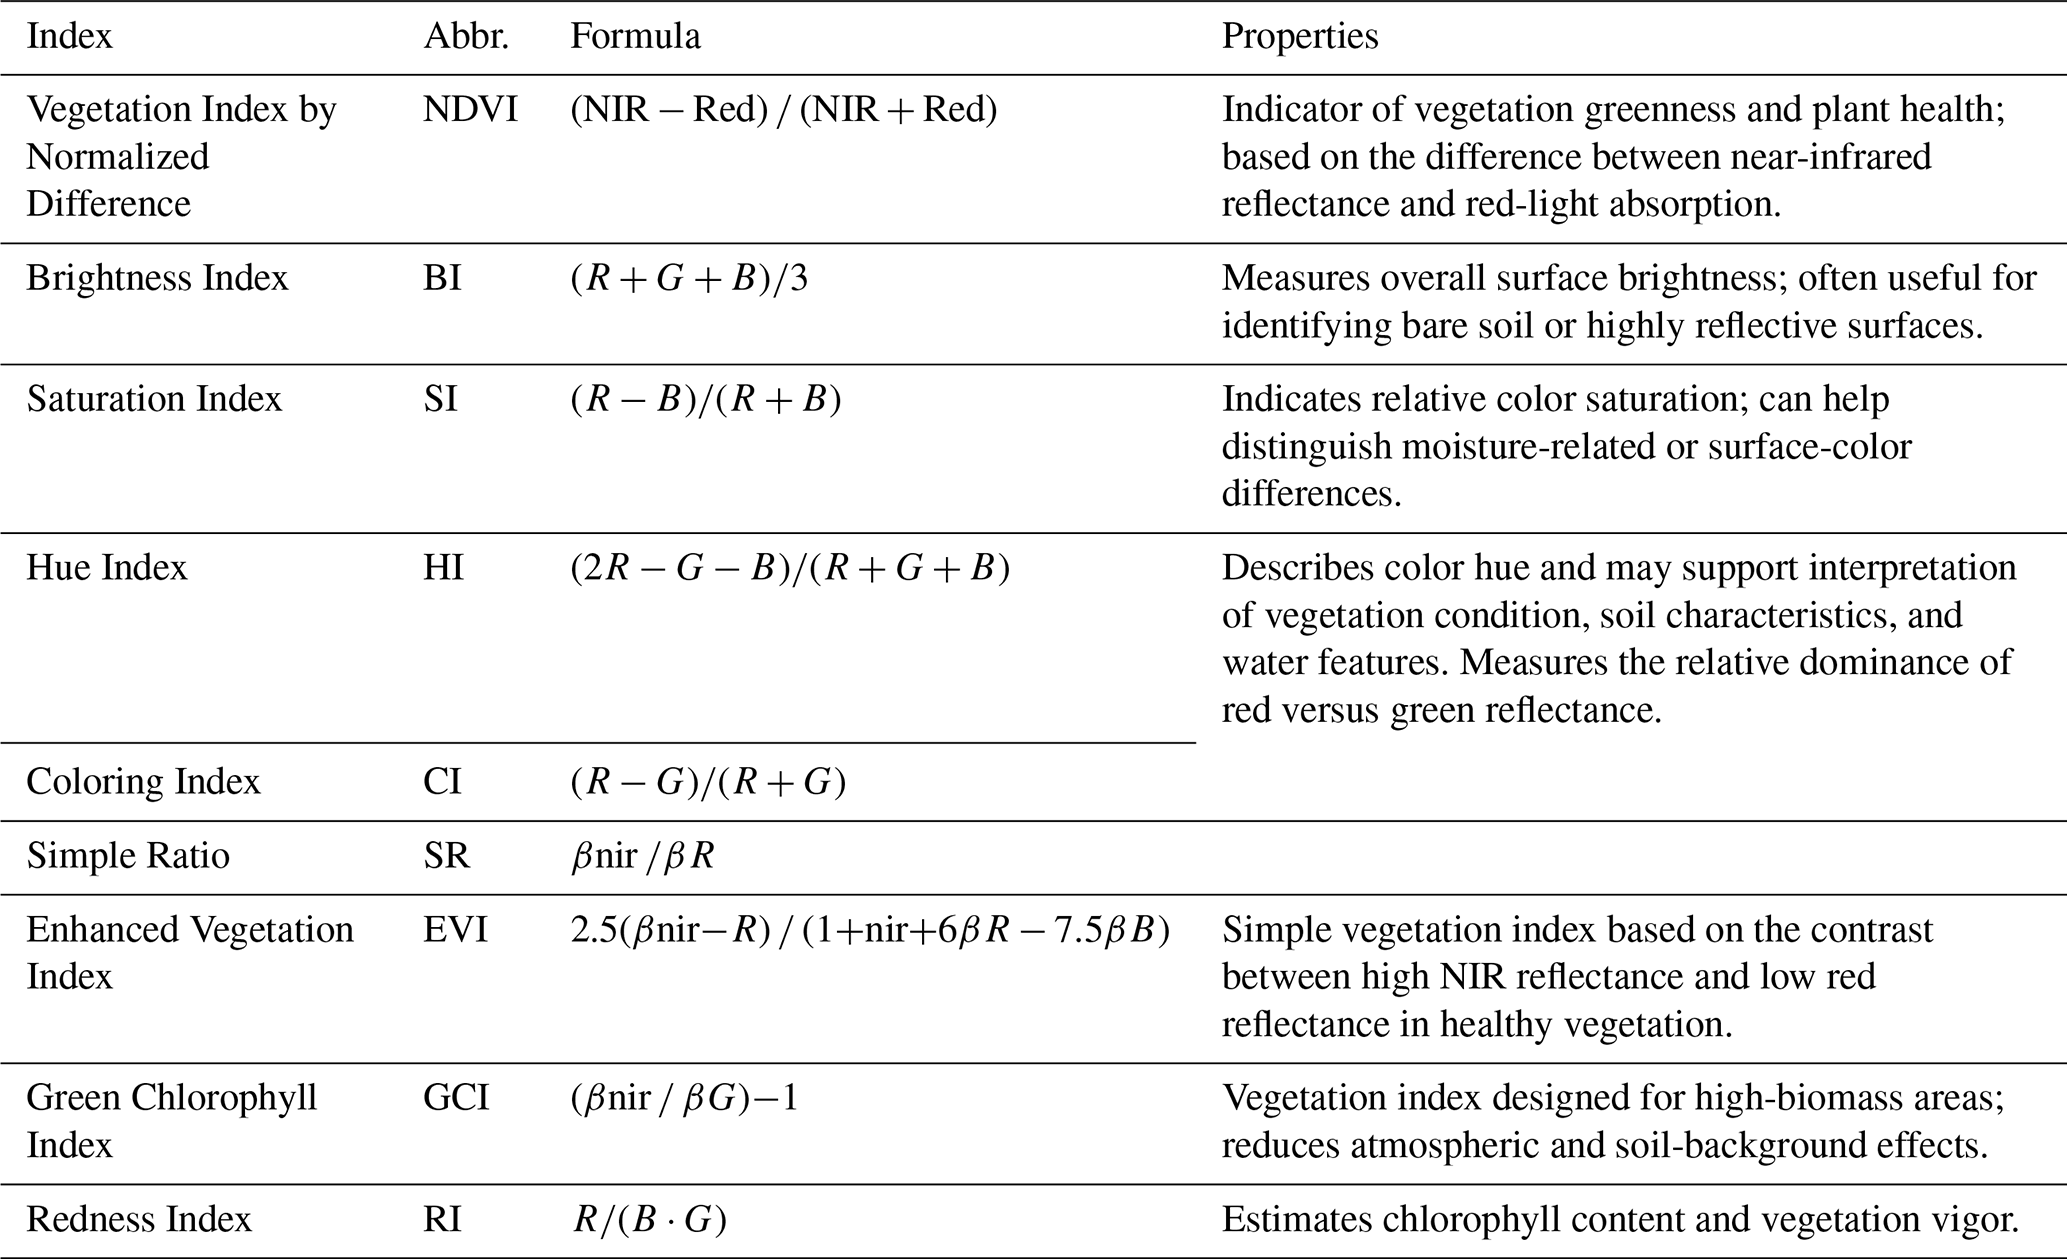
* β: the surface reflectance in the corresponding spectral band.
Vegetation is mainly sparse wooded and shrubby savannah with an herbaceous layer that provides fodder during the rainy season but degrades severely during the dry season due to leaf loss and bush fires.
According to the Communal Development Plan (PDC Matéri, 2005), the environment of the Commune of Matéri may become increasingly degraded if no corrective measures are implemented. Agriculture employs more than 90 % of the active population, with maize (Zea mays) as the dominant crop, followed by sorghum (Sorghum vulgare), rice, millet, voandzou, groundnuts (Arachis hypogea), cotton (Gossypium hirsutum), and cowpeas (Vigna unguiculata).
2.2 Landsat Data and Spectral Indices
In this study, spatial sampling was performed by first applying an iterative principal component analysis (IPCA) in R to identify satellite-derived environmental variables capturing agricultural landscape variability. A conditioned Latin Hypercube Sampling (CLHS) approach, also implemented in R, was then used to select representative grid cells by reproducing the multivariate distribution of the IPCA-selected variables.
Given the objective of transferring plot-scale information to the regional scale, Landsat satellite products are particularly appropriate. With a spatial resolution of approximately 30 m × 30 m, Landsat imagery meets the requirements of this study. The Landsat 8 satellite, launched in February 2013, provides global coverage every 16 d, with scenes of 185 km × 185 km and 11 spectral bands in 16-bit radiometric resolution.
For this study, two sets of seven Landsat 8 bands acquired in 2015 and 2016 were downloaded from the Global Land Cover Facility (GLCF). Two acquisition years were used deliberately to enrich the representation of spatial variability in land surface and vegetation conditions through the IPCA: spectral indices computed from both years enable the model to capture temporal variability in the spectral signature of agricultural surfaces, thereby improving the representativeness of the selected grid cell network. Seven 30 m resolution multispectral bands (Bands 1–7) were used, including Band 1 (coastal aerosol), Band 2 (blue), Band 3 (green), Band 4 (red), Band 5 (NIR), Band 6 and 7 (SWIR), which are essential for vegetation analysis, soil–vegetation discrimination, moisture assessment, and geological characterization.

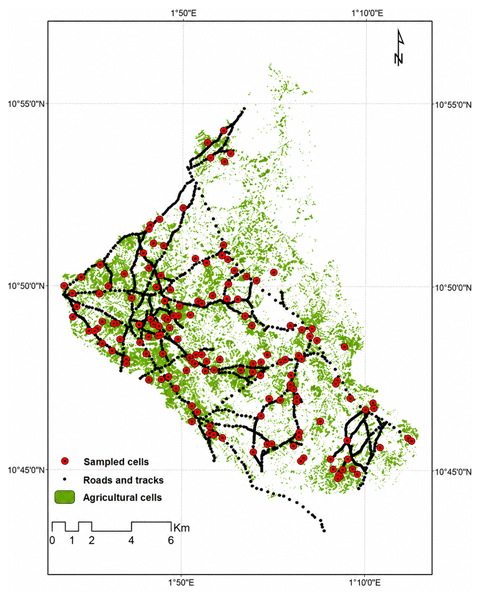
Figure 3Selected crop plots.
2.3 NGC calculation: IPCA and CLHS implementation
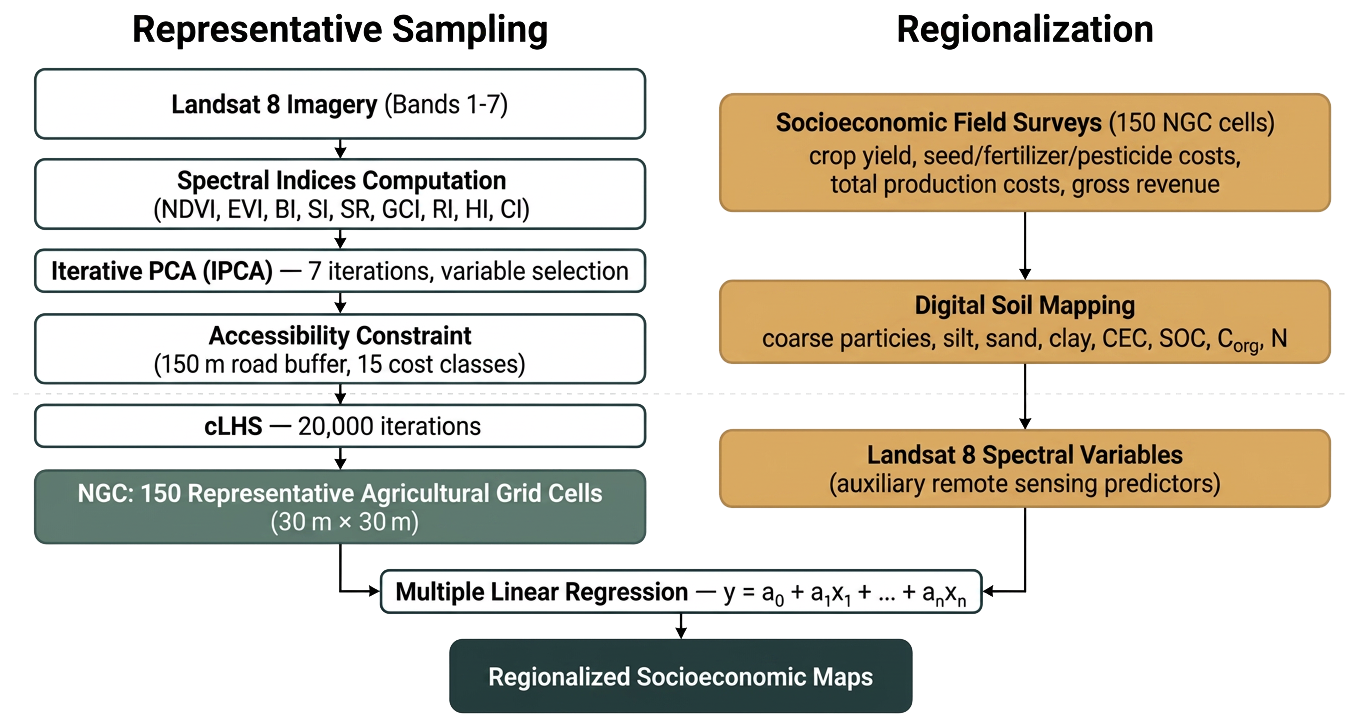
The methodological framework of the study is presented in Fig. 2 providing interlinkages between the various analyses performed from explanatory variables to the dependent variables as listed in Table 5.

Figure 4Box plot of the set of analyzed and sampled grid cells. Init = sets of farm cells, spl = set of sampled farm cells, Value (aspect) = [–], Value (dem) = [m], (n=150).

Figure 5Variability of the observed maize harvest (standardized coefficients with Conf. Int. 95 %).
A data-driven iterative principal component analysis (IPCA) was performed in R software to identify the variables explaining most of the agricultural landscape variability (Holleran et al., 2015). Seven successive IPCAs were conducted, with outputs from each iteration used as inputs for the next. To optimize field sampling, an accessibility constraint was introduced to reduce survey time and costs by prioritizing agricultural cells located near roads and tracks.
Roads and tracks within the catchment were mapped using GPS, and a 150 m buffer was generated on both sides. The Latin Hypercube sampling supported the selection of agricultural cells that best represented catchment heterogeneity while accounting for proximity to the road network. Fifteen accessibility cost classes were defined, with the lowest cost class (class 1) expected to contain the maximum number of cells of the Network of 30 m resolution Grid Cells (NGC).
Thus, the NGC was generated using a conditioned Latin Hypercube Sampling (CLHS) approach, combining IPCA-derived variables and the accessibility cost criterion (Pettitt and McBratney, 1993). A total of 20 000 iterations were performed to identify 150 agricultural grid cells 30 m × 30 m that optimally captured the multivariate distribution of environmental variables (spectral bands and indices), by minimizing a dedicated objective function. Only areas classified as agricultural land were included, while all other land-use types were excluded. The cropland mask was derived from the existing land use and land cover map of 5 m resolution of the Dassari catchment, produced as part of the WASCAL long-term monitoring program (Forkuor, 2014).
The 37 input variables used in the IPCA comprised the 7 spectral bands and the 9 indices from the two Landsat 8 acquisition years (2015 and 2016), as well as topographic variables, all as follows: 21 variables in 2015: aspect, blue15, bi15, coast15, ci15, curvature, DEM, EVI15, green15, gci15, hi15, ndvi15, nir15, rad15, red15, ri15, si15, sr15, slope, swir1_15, swir2_15; 16 variables in 2016: blue16, bi16, coast16, ci16, green16, gci16, hi16, ndvi16, nir16, rad16, red16, ri16, si16, sr16, swir1_16, swir2_16.
Table 2Variable selection for ten regression model (QR) for Maize. Values highlighted in bold indicate strong influences of model parameters.
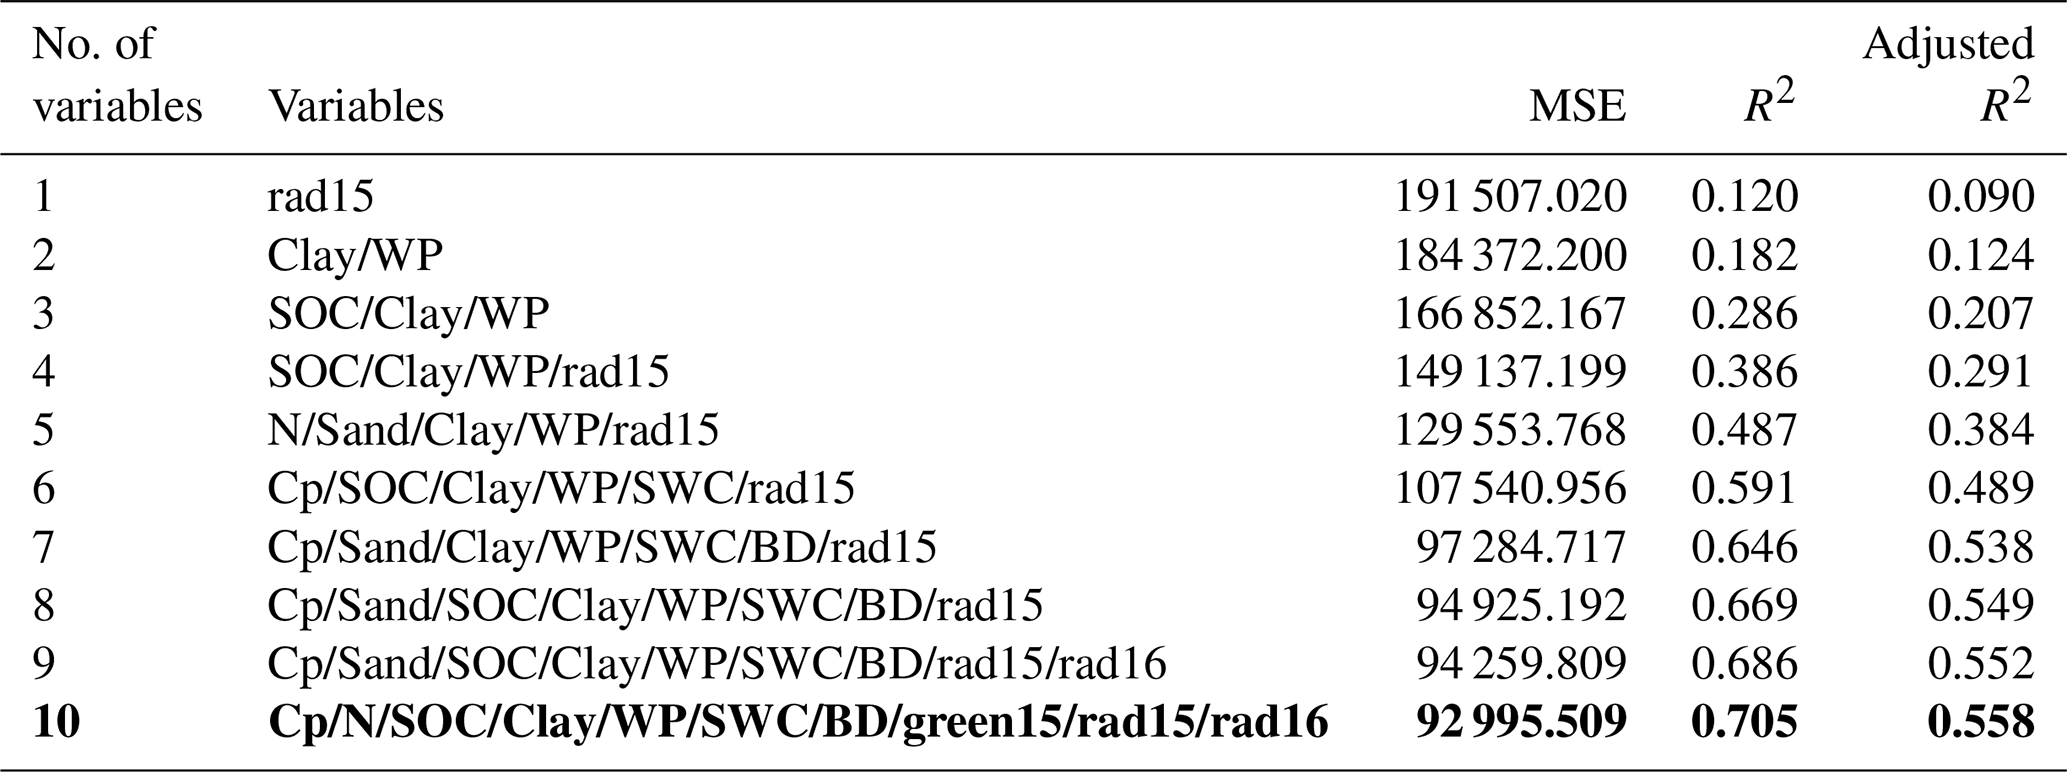
Table 3Analysis of Variance (ANOVA) for Maize. Values highlighted in bold indicate strong influences of model parameters.

2.4 Regionalization approach of socio-economic data
An essential prerequisite for the regionalization of socioeconomic data from the plot scale is the availability of spatial soil information, including physicochemical and hydraulic properties. These soil data were not collected directly within the NGC but were derived from the work of Hounkpatin et al. (2022), which used Digital Soil Mapping (DSM) framework (McBratney et al., 1981) to predict soil properties in the Dassari catchment. In the study of Hounkpatin et al. (2022), high-resolution satellite data (Sentinel 2, n=10), topography (n=18), and climate data (n=19), together with laboratory-analyzed soil samples (n=1685), were used to map eight soil properties for the whole Benin country: coarse particles (CP), silt, sand, clay, cation exchange capacity (CEC), soil organic carbon (SOC), SOC stock (Corg), and topsoil nitrogen (0–30 cm). The study applied random forest regression (RFR) as the predictive modeling technique for DSM. Model robustness was ensured using a 10-fold cross-validation with five replications, and validation was carried out using independent soil samples from the inner and outer donor catchment. The models were then extrapolated to the Dassari catchment, where prediction accuracy was assessed using root mean square error (RMSE) and Lin's concordance correlation coefficient. Predicted soil properties were finally extracted for each of the 150 NGC cells representing the agro-ecosystem variability of the Dassari catchment.
In parallel, socioeconomic surveys were conducted in the field within the same 150 cells of the generated NGC during the 2017 agricultural season (rainy season: May–October 2017). A total of 150 farmers were interviewed immediately after harvest (October–November 2017). Thus, a previously validated questionnaire was administered to the farmers and covered their main activities and labor allocation, land tenure and cropping systems, agricultural practices, household assets and resources, access to extension services, and perceptions of climate change and adaptation strategies.
Finally, a multiple linear regression analysis approach was used to develop predictive models for the regionalization of socioeconomic variables. This approach assumes a linear relationship between a dependent variable and a set of independent variables and can be expressed as:
where ai are regression coefficients. In this study, linear regression was applied to relate socioeconomic indicators (crop yield, seed, fertilizer and pesticide costs, total production costs, and gross revenue) to soil properties and remote-sensing variables for maize and cotton production.

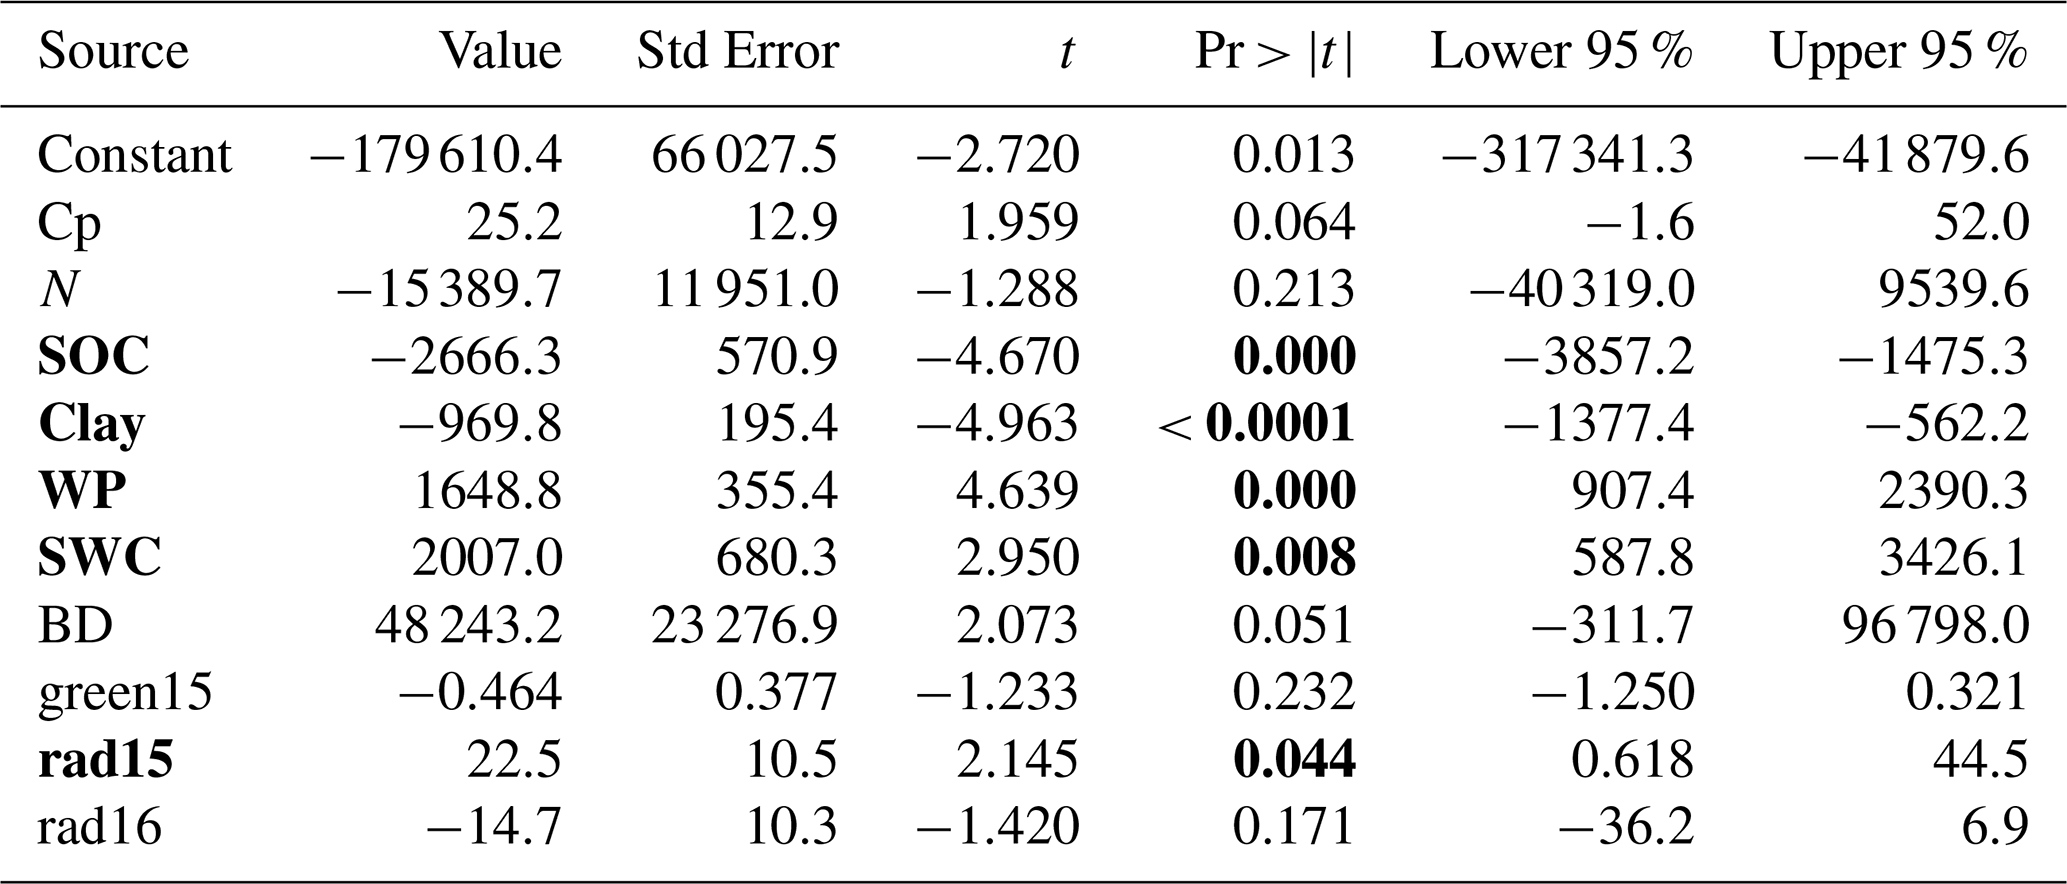
Table 4Estimation of Model Parameters (RQ) for Maize. Values highlighted in bold indicate strong influences of model parameters.
3.1 NGC calculation: IPCA and CLHS implementation
The initial principal component analysis included 37 input variables, yielding 37 potential principal components. The first two components explained 62.65 % of the total variance, while the first 13 components accounted for 98.39 %. Successive IPCA iterations progressively reduced the number of variables while maintaining a high level of explained variance: 24 variables in the second iteration (97.15 %), 19 in the third (97.28 %), 15 in the fourth (96.16 %), 13 in the fifth (94.27 %), and 11 in the sixth iteration (92.08 %). The seventh and final iteration retained seven variables (Ci 15: 2015 coloring index; bi15: 2015 brightness index; green15: Green 2015; rad15: Radiation 2015; ci15: 2015 redness index; si15: 2015 saturation index; rad16: Radiation 2016), explaining 88.05 % of the total variance.
Figure 3 shows the spatial distribution of the selected cells in the Dassari catchment. The selection was conditioned by accessibility constraints, favoring locations near roads, tracks, and settlements. However, some plots were selected in more remote areas because of their specific contribution to representing catchment heterogeneity.
Figure 4 presents a cross-sectional comparison of the distributional characteristics of the environmental variables involved in the IPCA, including the accessibility variable, for both the full set of agricultural areas in the study region and the selected representative cells. The close agreement of quantiles between the representative subset and the overall variable distributions demonstrates the effectiveness of the sampling strategy.
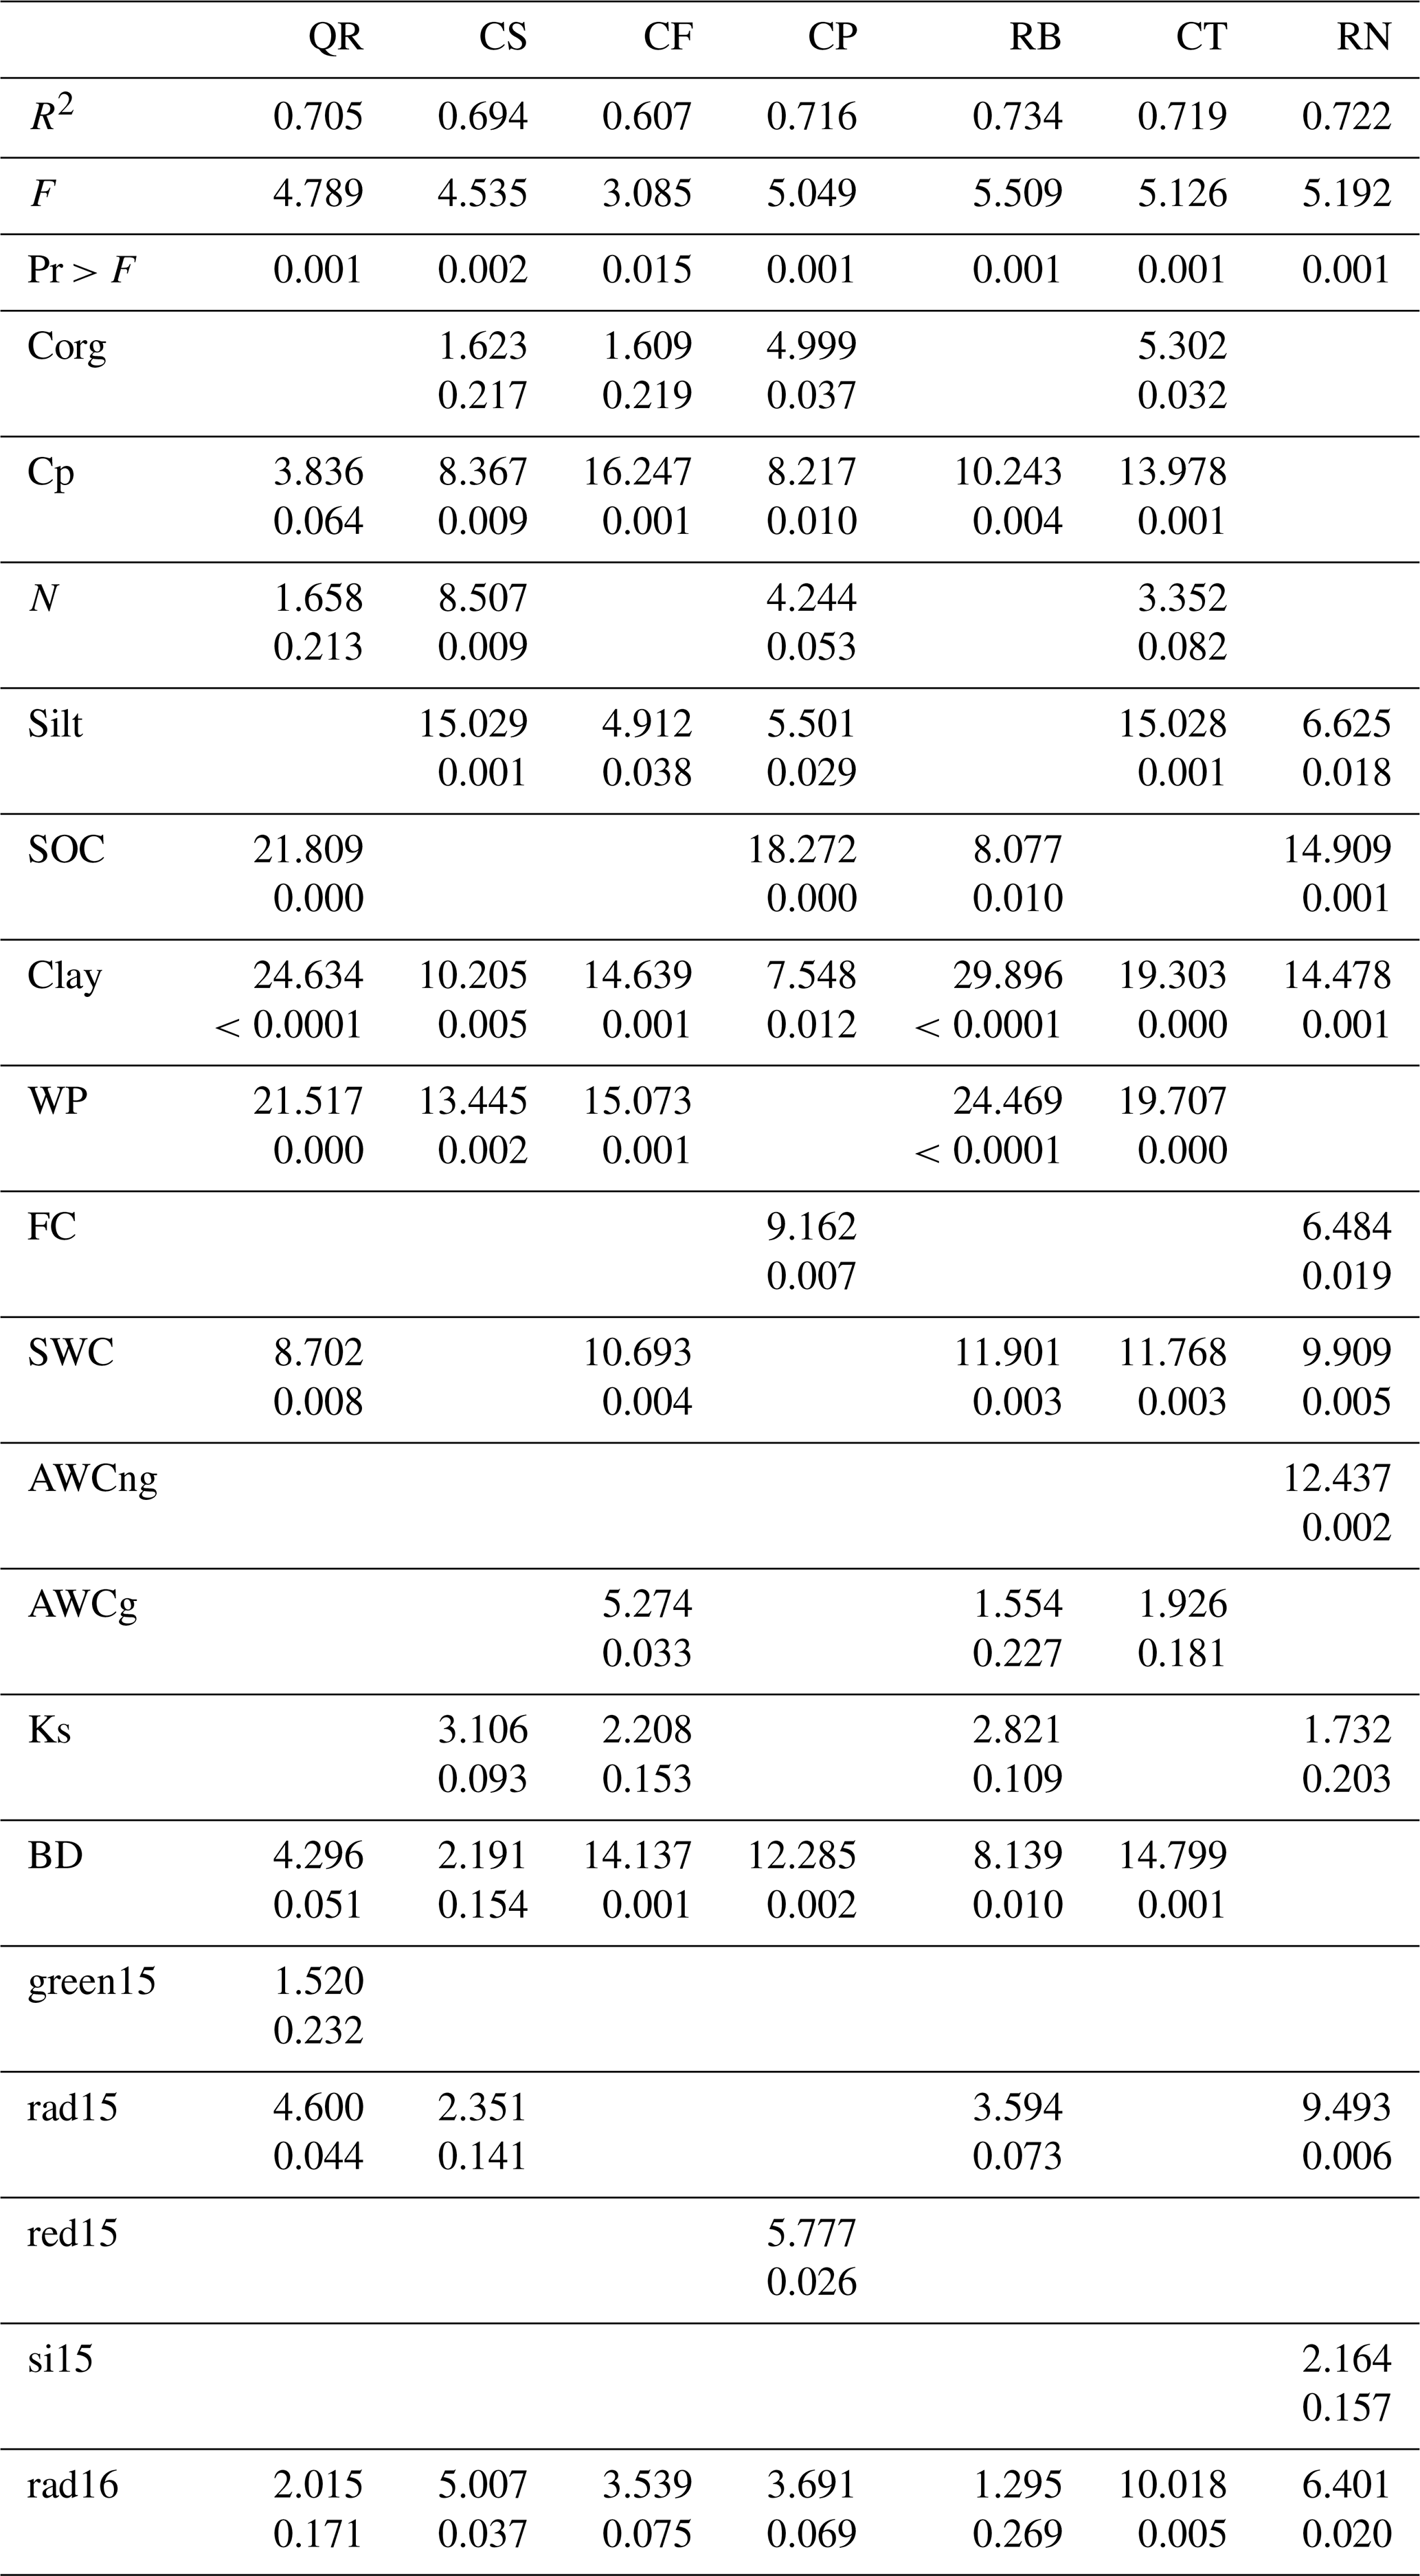
Table 5Summary of Regression Models for all Socioeconomic Dependent Variables (Maize). QR: quantity of harvest; CS: seed cost; CF: fertilizer cost; RB: gross margin; CT: total production cost; CP: pesticide cost; RN: net revenue. For each cell, the upper value is the F-statistic and the lower value is the associated p-value.
3.2 Distribution of data collected on the NGC
Soil, remote sensing, and survey data were standardized to compare their distributions by crop type for maize and cotton. Maize production is mainly influenced by soil properties (Corg: Organic carbon; N: Estimated nitrogen; WP: Wilting Point (Vol %); SWC: Saturated water content (Vol %); AWCng: Available water without gravel (Vol %); FC: Field Capacity (Vol %); KS: Sat. Hydraulic. Cond_gravel (cm d−1)) and by vegetation and moisture indices (green15, si15). Gross and net incomes and total production costs show low variability, suggesting that farmers' management practices partly offset natural constraints. Cotton production is primarily conditioned by soil properties (N, silt, clay, FC, AWCng) and the saturation index (si15), while gross and net incomes are weakly differentiated, likely due to uncertainties in reported yields and selling prices. Overall, the results indicated that millet, maize, sorghum, and cotton occur under different environmental conditions and are driven by distinct soil and remote sensing variables, requiring increased management efforts when conditions are less favorable.
Socioeconomic analyses in the Dassari catchment were focused on households associated with the representative cells of the monitoring network. Respondents have a mean age of 39 years, an average of 19 years of farming experience, and are predominantly males (74 %). Households average nine members, with a dependency ratio of 1.22, and 59 % of respondents are illiterate. Maize is the dominant crop (34 % of farmers), followed by rice and cotton (18 % each), and millet and sorghum (16 %), while yams and legumes account for 3.5 %. All identified land is farmer-owned; 49 % of plots are smaller than 1 ha, 97 % of farmers are smallholders, and the average farm size is about 2 ha. Men are more involved than women in maize and cotton production.
3.3 Regional Models for Maize Crop Production
Pearson correlation coefficients between maize dependent variables (QR: Quantity harvested per ha; CS: Seed cost per ha; CF: Fertilizer cost per ha; CP: Pesticide cost per ha; RN: Net value of production per ha; CT: Total charge per ha; RB: Gross margin per ha) and explanatory variables (Corg: Organic carbon, Cp: Coarse particle, N: Estimated nitrogen, etc.) are generally low in absolute value (< 0.5), indicating weak individual effects and justifying the use of multiple linear regression as an explanatory and predictive approach. Table 2 presents ten regression models for maize harvest quantity (QR), developed using a bottom-up variable entry strategy. Model performance improves with the inclusion of additional variables, and the optimal model is identified by minimizing the mean squared error (MSE) while maximizing the coefficient of determination (R2).
The selected model (highlighted in blue, Table 2) explains 70.5 % of the variability in QR (R2=0.705), with the remaining variance attributed to unobserved factors or incomplete representation by the selected variables. Analysis of variance (Table 3) confirms the overall significance of the model, with an F-statistic of 4.789 and a p-value of 0.001, indicating a statistically significant relationship between QR and the explanatory variables. Table 4 reports the parameter estimates of the selected model, including regression coefficients and significance levels, which are essential for interpretation, forecasting, simulation, and comparison with other studies.
Analysis of Table 4, based on Student's t-test p-values and the associated 95 % confidence intervals, indicates that SOC, clay, WP, SWC, and rad15 significantly explain the variability of QR. Among these, SOC and WP are the most influential variables, exhibiting significance at the 0 % level.
The regression diagnostics for harvest quantity (QR), gross revenue (RB), and total burden (CT) indicate satisfactory model performance. Regression results for QR, RB and CT were analyzed through figures such as Figs. 5 and 6. In all cases, standardized coefficients and residuals are largely confined within the interval [−2, 2], with approximately 95 % of observations falling within this range, suggesting the absence of major outliers and an acceptable error structure.
For QR (Fig. 5), the explanatory variables (SOC, clay, WP, SWC, and rad15) explain 70.5 % of the total variability (R2=0.705), while the remaining 29.5 % reflects the influence of other unaccounted factors. Table 5 summarizes the main characteristics of the selected maize models, including the coefficient of determination, F-statistic, and associated p-value.
Overall, the regression analyses indicate strong relationships between soil, remote sensing, and socioeconomic variables for both maize and cotton. Several soil and satellite-derived variables significantly explain crop yield, seed, pesticide and fertilizer costs, total production costs, and gross revenue, while other variables were excluded due to weak or non-significant contributions. The results highlight the dominant role of soil physical properties in maize and cotton production, which emerged as the most influential factors in the analysis.
This study demonstrates that combining satellite-derived variables, soil data, and socioeconomic information provides a robust framework for regionalizing agroecosystem heterogeneity in the Sudano-Sahelian Volta Basin. Using two Landsat 8 image sets (2015–2016), 37 environmental variables were reduced to 7 key variables through iterative principal component analysis, and a conditioned Latin Hypercube Sampling approach was used to select 150 representative grid cells within the 550 km2 Dassari catchment. Field and survey data showed that major crops (millet, sorghum, maize, and cotton) occur under distinct environmental conditions and are influenced by different soil and remote sensing variables. For maize, multiple linear regression explained 70.5 % of yield variability (R2=0.705), mainly driven by soil organic carbon, clay content, soil water parameters, and radiation, with predicted and observed values closely aligned within the 95 % confidence interval. The results highlight that spatial heterogeneity generates additional labor and input costs, which may threaten farm sustainability if not considered in planning. Despite data limitations for some crops, the proposed approach provides a solid basis for long-term monitoring and informed decision-making, while emphasizing the need to strengthen farmer training and data collection systems.
The Landsat 8 data used in this study are publicly available from the Global Land Cover Facility (GLCF). The soil information was derived from previously published digital soil mapping data described by Hounkpatin et al. (2022, https://doi.org/10.1016/j.geodrs.2021.e00444). The cropland mask was made available through WASAL (https://opus.bibliothek.uni-wuerzburg.de/frontdoor/index/index/docId/10868, Forkuor, 2014). The socioeconomic data collected through farmer surveys are not publicly available because they may contain potentially identifiable or confidential information, but may be made available by the corresponding author upon reasonable request, subject to applicable ethical and data-protection requirements.
YAB and ABB conceptualized the study, conducted the field investigations, and performed the primary data analysis. YAB and OD handled the manuscript formatting, structural corrections, and technical editing. KOLH, YY, JH, HAO and EA supervised the research, validated the methodology, and critically revised the manuscript to improve its scientific quality. All authors have read and agreed to the published version of the manuscript.
At least one of the (co-)authors is a guest member of the editorial board of Proceedings of the International Association of Hydrological Sciences for the special issue “Circular Economy and Technological Innovations for Resilient Water and Sanitation Systems in Africa II”. The peer-review process was guided by an independent editor, and the authors also have no other competing interests to declare.
Publisher's note: Copernicus Publications remains neutral with regard to jurisdictional claims made in the text, published maps, institutional affiliations, or any other geographical representation in this paper. The authors bear the ultimate responsibility for providing appropriate place names. Views expressed in the text are those of the authors and do not necessarily reflect the views of the publisher.
This article is part of the special issue “Circular Economy and Technological Innovations for Resilient Water and Sanitation Systems in Africa II”. It is a result of the 2nd Edition of the C2EA Water and Sanitation Week on “From Research to Innovation and Technology Transfer”, Cotonou, Benin, 3–5 June 2025.
The authors would like to thank WASCAL for the support in providing the cropland mask of 5 m resolution of the Dassari catchment (Forkuor, 2014).
This paper was edited by Audace Amen V. Dossou-Olory and reviewed by Guido D Urso and two anonymous referees.
Bai, Z. G., Dent, D. L., Olsson, L., and Schaepman, M. E.: Proxy global assessment of land degradation, Soil Use Manage., 24, 223–234, https://doi.org/10.1111/j.1475-2743.2008.00169.x, 2008.
Dupras, J., Revéret, J.-P., and He, J.: L'évaluation économique des biens et services écosystémiques dans un contexte de changements climatiques: un guide méthodologique pour une augmentation de la capacité à prendre des décisions d'adaptation, Ouranos, Montréal, Québec, Canada, https://www.ouranos.ca/sites/default/files/2023-05/proj-horspg-reveret-rapportfinal.pdf (last access: 28 August 2026), 2013.
Forkuor, G.: Agricultural Land Use Mapping in West Africa Using Multi-sensor Satellite Imagery, Thèse de doctorat, Julius-Maximilians-Universität Würzburg, Würzburg, Germany, https://opus.bibliothek.uni-wuerzburg.de/frontdoor/index/index/docId/10868 (last access: 4 September 2026), 2014.
Hengl, T., Rossiter, D. G., and Stein, A.: Soil sampling strategies for spatial prediction by correlation with auxiliary maps, Aust. J. Soil Res., 41, 1403–1422, https://doi.org/10.1071/SR03005, 2003.
Holleran, M., Levi, M., and Rasmussen, C.: Quantifying soil and critical zone variability in a forested catchment through digital soil mapping, SOIL, 1, 47–64, https://doi.org/10.5194/soil-1-47-2015, 2015.
Hounkpatin, K. O. L., Bossa, A. Y., Yira, Y., Igue, M. A., and Sinsin, B. A.: Assessment of the soil fertility status in Benin (West Africa) – Digital soil mapping using machine learning, Geoderma Reg., 28, e00444, https://doi.org/10.1016/j.geodrs.2021.e00444, 2022.
Igué, A. M.: The use of a soil and terrain database for land evaluation procedures: case study of Central Benin, Thèse de doctorat, Universität Hohenheim, Stuttgart, Germany, 235 pp., https://d-nb.info/960669906/04 (last access: 4 September 2026), 2000.
Institut National de la Statistique et de l'Analyse Économique (INSAE): Deuxième recensement général de la population et de l'habitat de février 1992: synthèse des résultats d'analyse, MPREPE – MECCAG, Cotonou, Bénin, https://rgph5.instad.bj/a-propos-du-rgph5/ (last access: 4 September 2026), 1994.
Lesch, S. M., Strauss, D. J., and Rhoades, J. D.: Spatial prediction of soil salinity using electromagnetic induction techniques: 2. An efficient spatial sampling algorithm suitable for multiple linear regression model identification and estimation, Water Resour. Res., 31, 387–398, https://doi.org/10.1029/94WR02180, 1995.
McBratney, A. B., Webster, R., and Burgess, T. M.: The design of optimal sampling schemes for local estimation and mapping of regionalized variables – I: Theory and method, Comput. Geosci., 7, 331–334, https://doi.org/10.1016/0098-3004(81)90077-7, 1981.
Minasny, B. and McBratney, A. B.: A conditioned Latin hypercube method for sampling in the presence of ancillary information, Comput. Geosci., 32, 1378–1388, https://doi.org/10.1016/j.cageo.2005.12.009, 2006.
National Research Council: Division on Earth and Life Studies, Board on Agriculture and Natural Resources, and Committee on Twenty-First Century Systems Agriculture, Toward Sustainable Agricultural Systems in the 21st Century, The National Academies Press, Washington, DC, 598 pp., https://doi.org/10.17226/12832, 2010.
Comme de Matéri : Plan de developpement communal: plan économique et social de Matéri, 88pp., https://www.biali.info/sites/www.biali.info/files/uploads/PDC Matéri.pdf (last access: 4 September 2026), 2005.
Pettitt, A. N. and McBratney, A. B.: Sampling designs for estimating spatial variance components, J. Roy. Stat. Soc. C-Appl. Stat., 42, 185–209, https://doi.org/10.2307/2347420, 1993.
Srivastava, A. K., Gaiser, T., Cornet, D., and Ewert, F.: Estimation of effective fallow availability for the prediction of yam productivity at the regional scale using model-based multiple scenario analysis, Field Crop. Res., 131, 32–39, https://doi.org/10.1016/j.fcr.2012.01.012, 2012.
van Groenigen, J. W., Siderius, W., and Stein, A.: Constrained optimisation of soil sampling for minimisation of the kriging variance, Geoderma, 87, 239–259, https://doi.org/10.1016/S0016-7061(98)00056-1, 1999.