the Creative Commons Attribution 4.0 License.
the Creative Commons Attribution 4.0 License.
 | 19 Apr 2024
Performance analysis of physically-based (HEC-RAS, CADDIES) and AI-based (LSTM) flood models for two case studies
Marina Batalini de Macedo
Nikunj K. Mangukiya
Maria Clara Fava
Ashutosh Sharma
Roberto Fray da Silva
Ankit Agarwal
Maria Tereza Razzolini
Eduardo Mario Mendiondo
Narendra K. Goel
Mathew Kurian
Adelaide Cássia Nardocci
Megacities in developing countries are commonly affected by flooding events. The use of flood models can contribute to an evidence-based decision-making process. For a good representation, these models require physical data for catchment parameterization, and observed data for calibration and validation, which is often scarce. In this study, we analysed the performance results of physically-based (HEC-RAS, CADDIES) and AI-based (LSTM) flood models for two case studies: the Narmada basin in India and the Aricanduva catchment in Brazil. The models were evaluated for accuracy, interpretability, running time, and complexity.
- Article
(7303 KB) - Full-text XML
- BibTeX
- EndNote


Flood models are good tools to guide public policies for mitigation and adaptation to extreme rainfall events since they allow simulation of different strategies scenarios. It is possible to separate the models into two main categories, those based on physical processes and characteristics of the area (here called physically-based) and those based on artificial intelligence (AI), which are mainly based on time series analysis of the data (here called AI-based).
Batalini de Macedo et al. (2022) performed a bibliometric review of flood models and observed a significant increase in their use since 2016, both for physically-based and AI-based. Furthermore, the main keywords identified in the literature were “HEC-RAS” for studies with physical models, and “machine learning” for studies with AI models, between them, “LSTM”.
The different purposes when using flood modelling requires different results generated by the model (such as spatial-temporal resolution) and different processing time (e.g. early warning systems requires results in enough time to take response actions). Additionally, the monitoring conditions of the basin (e.g. ungauged or poorly gauged) may affect the applicability of a model and the quality of the results.
Thus, studies resembling these models for different scales and purposes of use can provide important information to help decision-makers choose which model to adopt.
Therefore, in this study, we analysed the performance of two physically-based flood models, with different levels of complexity and of a AI-based model. The comparison was made for two case studies in partially-gauged basins with different scales in India and Brazil.
The models chosen for evaluation and the metrics used to analyse their performance (in terms of accuracy, interpretability, running time, and complexity) are briefly presented. The analysis was made for two case studies are presented, with different scales of application, located in India and Brazil.
2.1 Physically-based (PB) flood models
The physical models chosen for evaluation were the HEC-RAS and the CADDIES, both open-access. The HEC-RAS is a physical model developed by the US Army Corps of Engineers (HEC, 2018) that allows simulations of one-dimensional steady and unsteady flow and two-dimensional unsteady flow calculations (here called as HEC-RAS 2D). HEC-RAS uses the four-point implicit finite difference scheme. Its main input parameters for the development of flood maps are bathymetry data or Digital Elevation Models (DEM), roughness coefficients for each type of land use, and the series of stage and flow hydrographs as boundary conditions. In the absence of observed data downstream, the model also allows defining normal depth as a boundary condition.
CADDIES is a cellular automata model that allows discretely simulating shallow water equations (SWEs) in grids. Instead of using transition rules, this model is based on the previous state of the cell and neighbouring cells, with rules that control the evolution of the state of each cell (Guidolin et al., 2016). The model uses rainfall series, the DEM, and an average roughness coefficient for the catchment as input data, therefore, with a high simplicity for the user. Its professional version (CADDIES PRO) allows different roughness coefficients for each land use; however, it is not open access.
2.2 Artificial intelligence (AI) flood model
The AI model chosen was the LSTM. This model is a variation of the recurrent neural network (RNN), incorporating the ability to learn long-term dependencies, especially in sequence prediction problems (Shen, 2018). Compared to simple RNN, instead of having one state variable, the information in LSTM units is controlled by cell states and input, forget, and output gates. There are many variants of LSTM based on the interconnection of these gates, which control what information should be added, forgotten, and obtained as output from the LSTM cell. In this study, we evaluate the simple LSTM network for predicting flow in the river.
The LSTM model was trained for both study areas using daily meteorological forcing (rainfall, temperature, solar radiation, relative humidity, wind speed) and static watershed attributes (mean elevation and slope, land use land cover characteristics and soil characteristics). The RMSE between the observed and simulated streamflow was chosen as the loss parameter to be minimized across training sequences. As a pre-processing of the dataset, the daily streamflow and rainfall distributions were transformed to get the distribution close to normal since rainfall and streamflow typically have the Gamma distribution (Mangukiya et al., 2023). The hyperparameter of the LSTM model was manually optimized, and finally, 365 d of training instances, a hidden-state size of 256, and a dropout rate of 0.5 were used. As final result, the ensemble results from five simulations with different random seeds were obtained to reduce the uncertainty of the LSTM model output due to its stochastic nature. More details of the LSTM model strategy adopted can be read from Mangukiya et al. (2023).
2.3 Metrics for evaluation
To evaluate the applicability of the flood models for different study areas, their performance was compared in terms of accuracy, running time, complexity, and interpretability. For accuracy, the NSE (Eq. 1) and NRMSE (Eq. 2) of the water level were calculated.
Where: Qo is the observed discharges, Qm is the modelled discharge, at times t. For HEC-RAS, Qo and Qm were obtained for a intermediate gauge station in the catchment, as for LSTM they were obtained for the exutory gauge station.
The accuracy was assessed just for HEC-RAS and LSTM simulations, as the CADDIES model generates only maximum flood depth instead of a time series; in the second case, a qualitative analysis was performed, comparing with pictures taken from citizens during the event modelled, for point known.
For the running time, it was presented the time taken for each model to provide the final flood map and a description of the CPU features used for each case. The complexity was evaluated from each model's input parameter and configurations. Finally, interpretability is a more subjective metric, including discussing the results provided by each model and the ease of understanding its results and applying them in the decision-making process.
2.4 Study areas
Two study areas were selected for this study, representing different contexts for floods.
The first case study is the Aricanduva catchment, located in São Paulo – SP, Brazil (Fig. 1), covering an area of 102.5 km2. This catchment is completely urbanized and has recurrent flood events, including flash floods. The population density is high and therefore it has high risks of people displacement, injuries, and economic losses (Simas, 2017). Additionally, this catchment is well monitored, with rainfall, stream flow, and stage data monitored each 10 min for 10 years by SAISP system (Barros et al., 2016; SAISP, 2023). However, data from flood extent and water depth outside the channel are not monitored, therefore, being considered a partially gauged catchment.
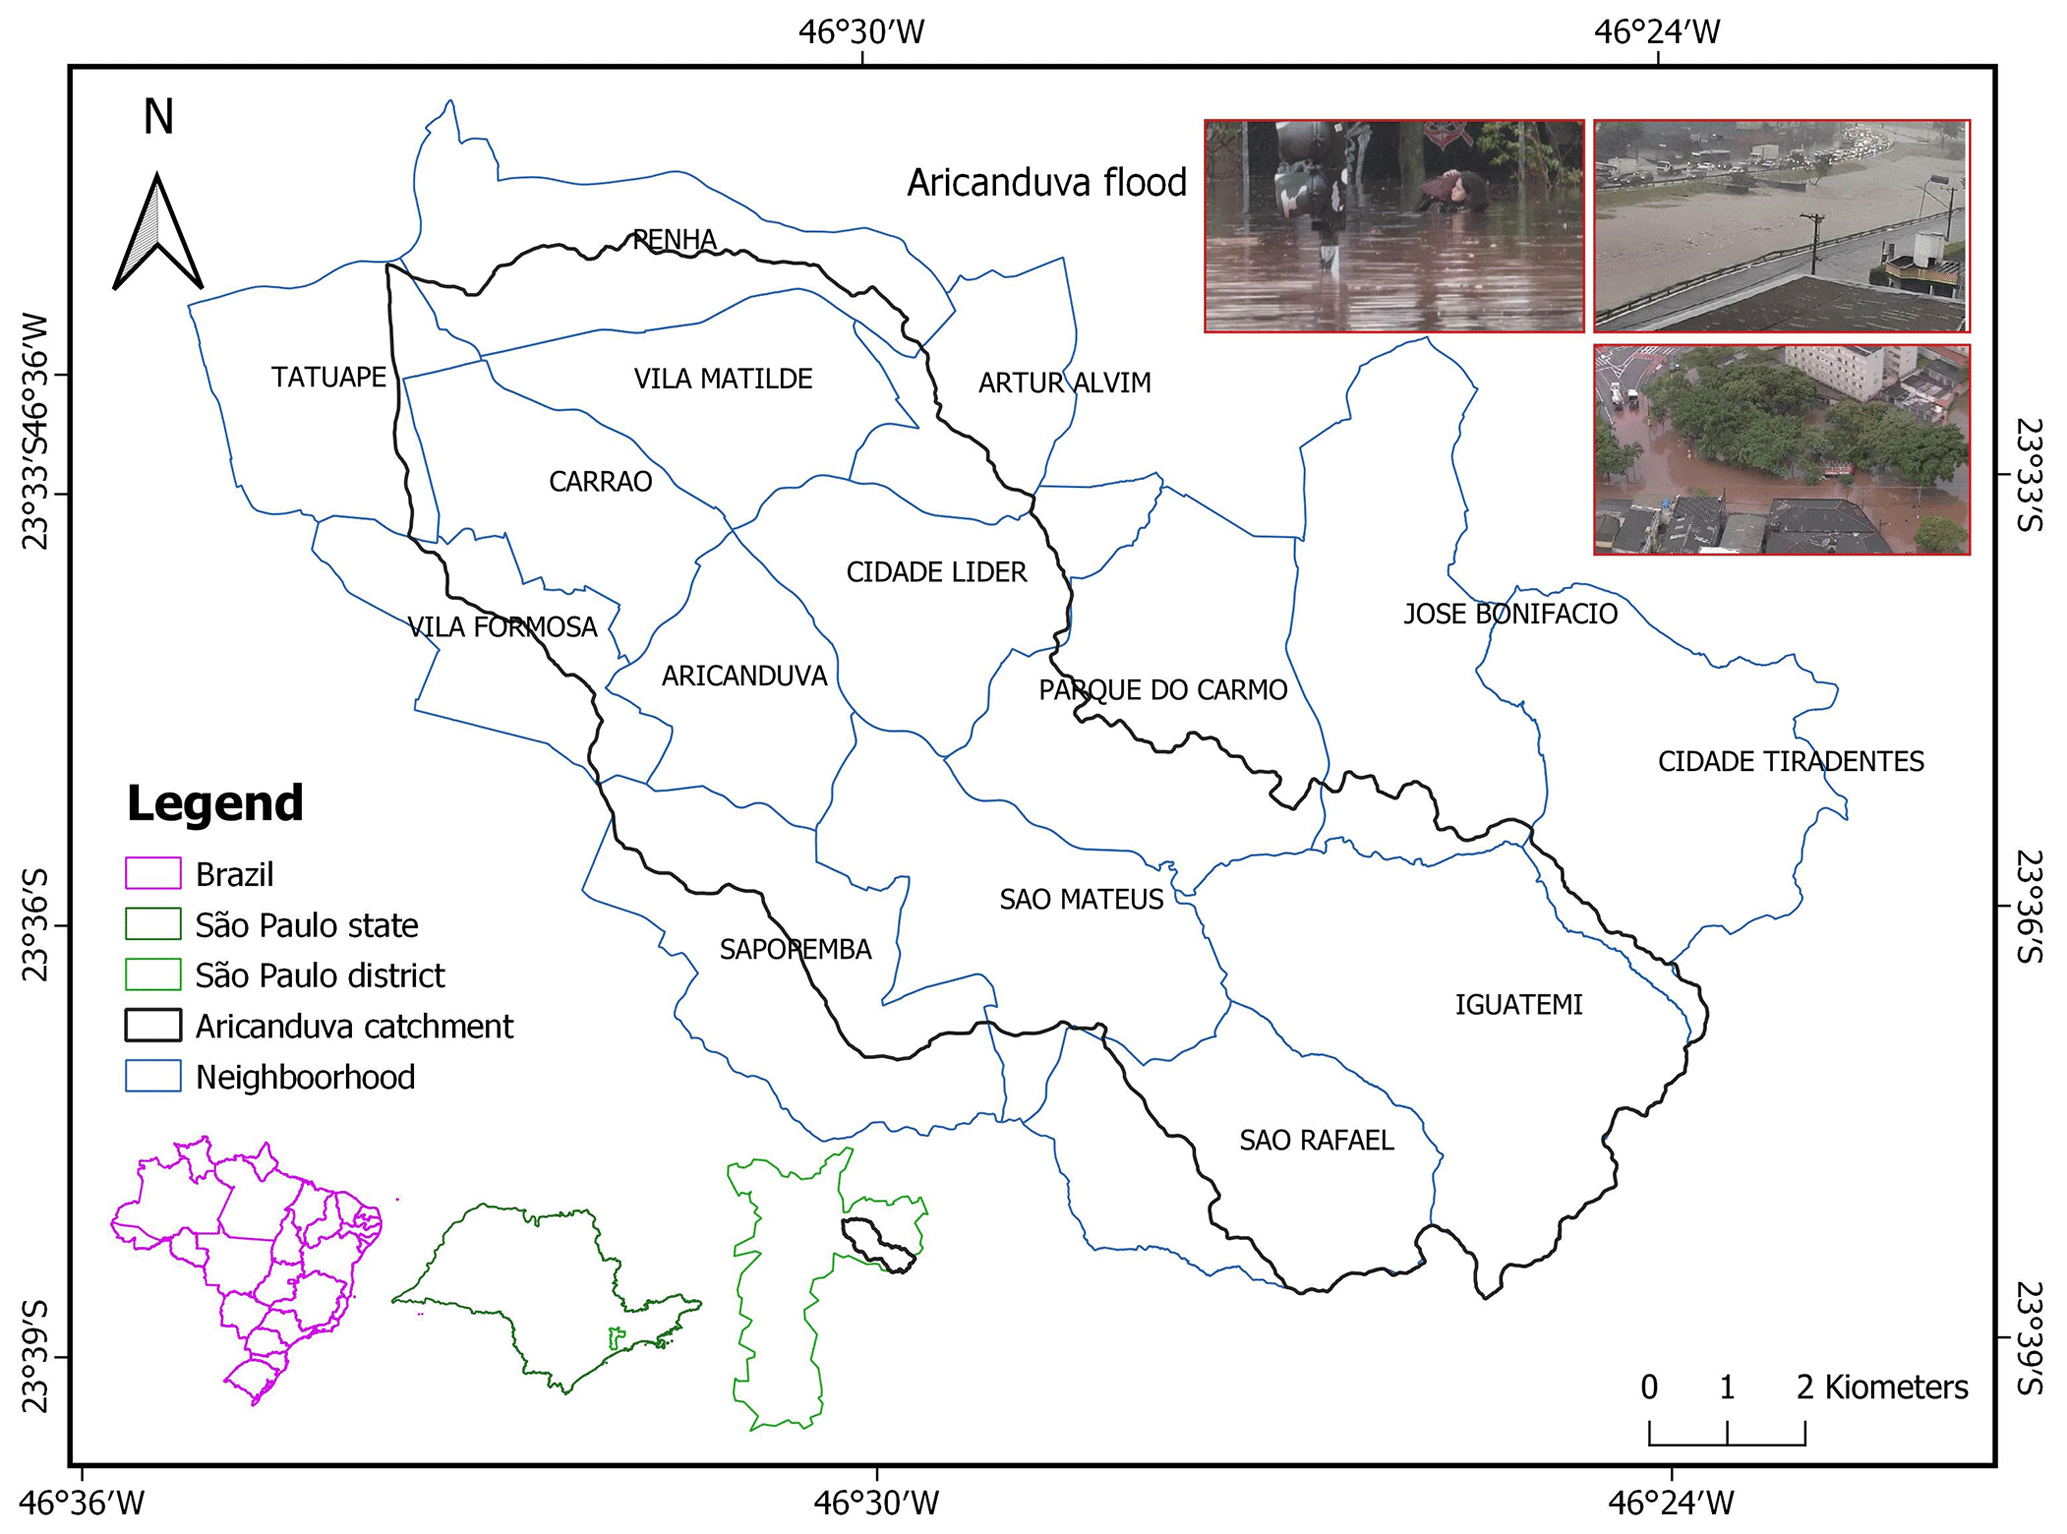
Figure 1Location of Aricanduva catchment.
The simulations were performed for the extreme rainfall event that occurred the 16 February 2019, with observed rainfall data of 10 min being used as input for CADDIES and HEC-RAS and. One point of stream flow data was used as input boundary condition in HEC-RAS and input data in LSTM, and the other was used to verify of model accuracy. As for the DEM, the SRTM with 30 m resolution was used.
The second case study is the Narmada basin in India (Fig. 2). The Narmada River is India's sixth-longest and fifth-largest river, with a basin area of 98 796 km2. The lower part of the basin is bounded by Sardar Sarovar Dam and the coastal region. The primary LULC class of the Lower Narmada basin is agriculture cropland (61 %), dense vegetation and forest (21 %), and urban land (8 %).
The river stretch in the lower Narmada basin is monitored by a gauge station at Garudeshwar weir (which observes water level and discharge) and Bharuch golden bridge (which observes water level) (IMD, 2023; India-WRIS, 2023).
The simulations were performed for the extreme rainfall event that occurred the 9 July 1994, with observed daily rainfall data being used for CADDIES and observed hourly streamflow as input for HEC-RAS and LSTM. One point of streamflow data was used as input boundary condition in HEC-RAS, and the other was used to verify of model accuracy. As for the DEM, the SRTM with 30 m resolution was used (USGS, 2023).
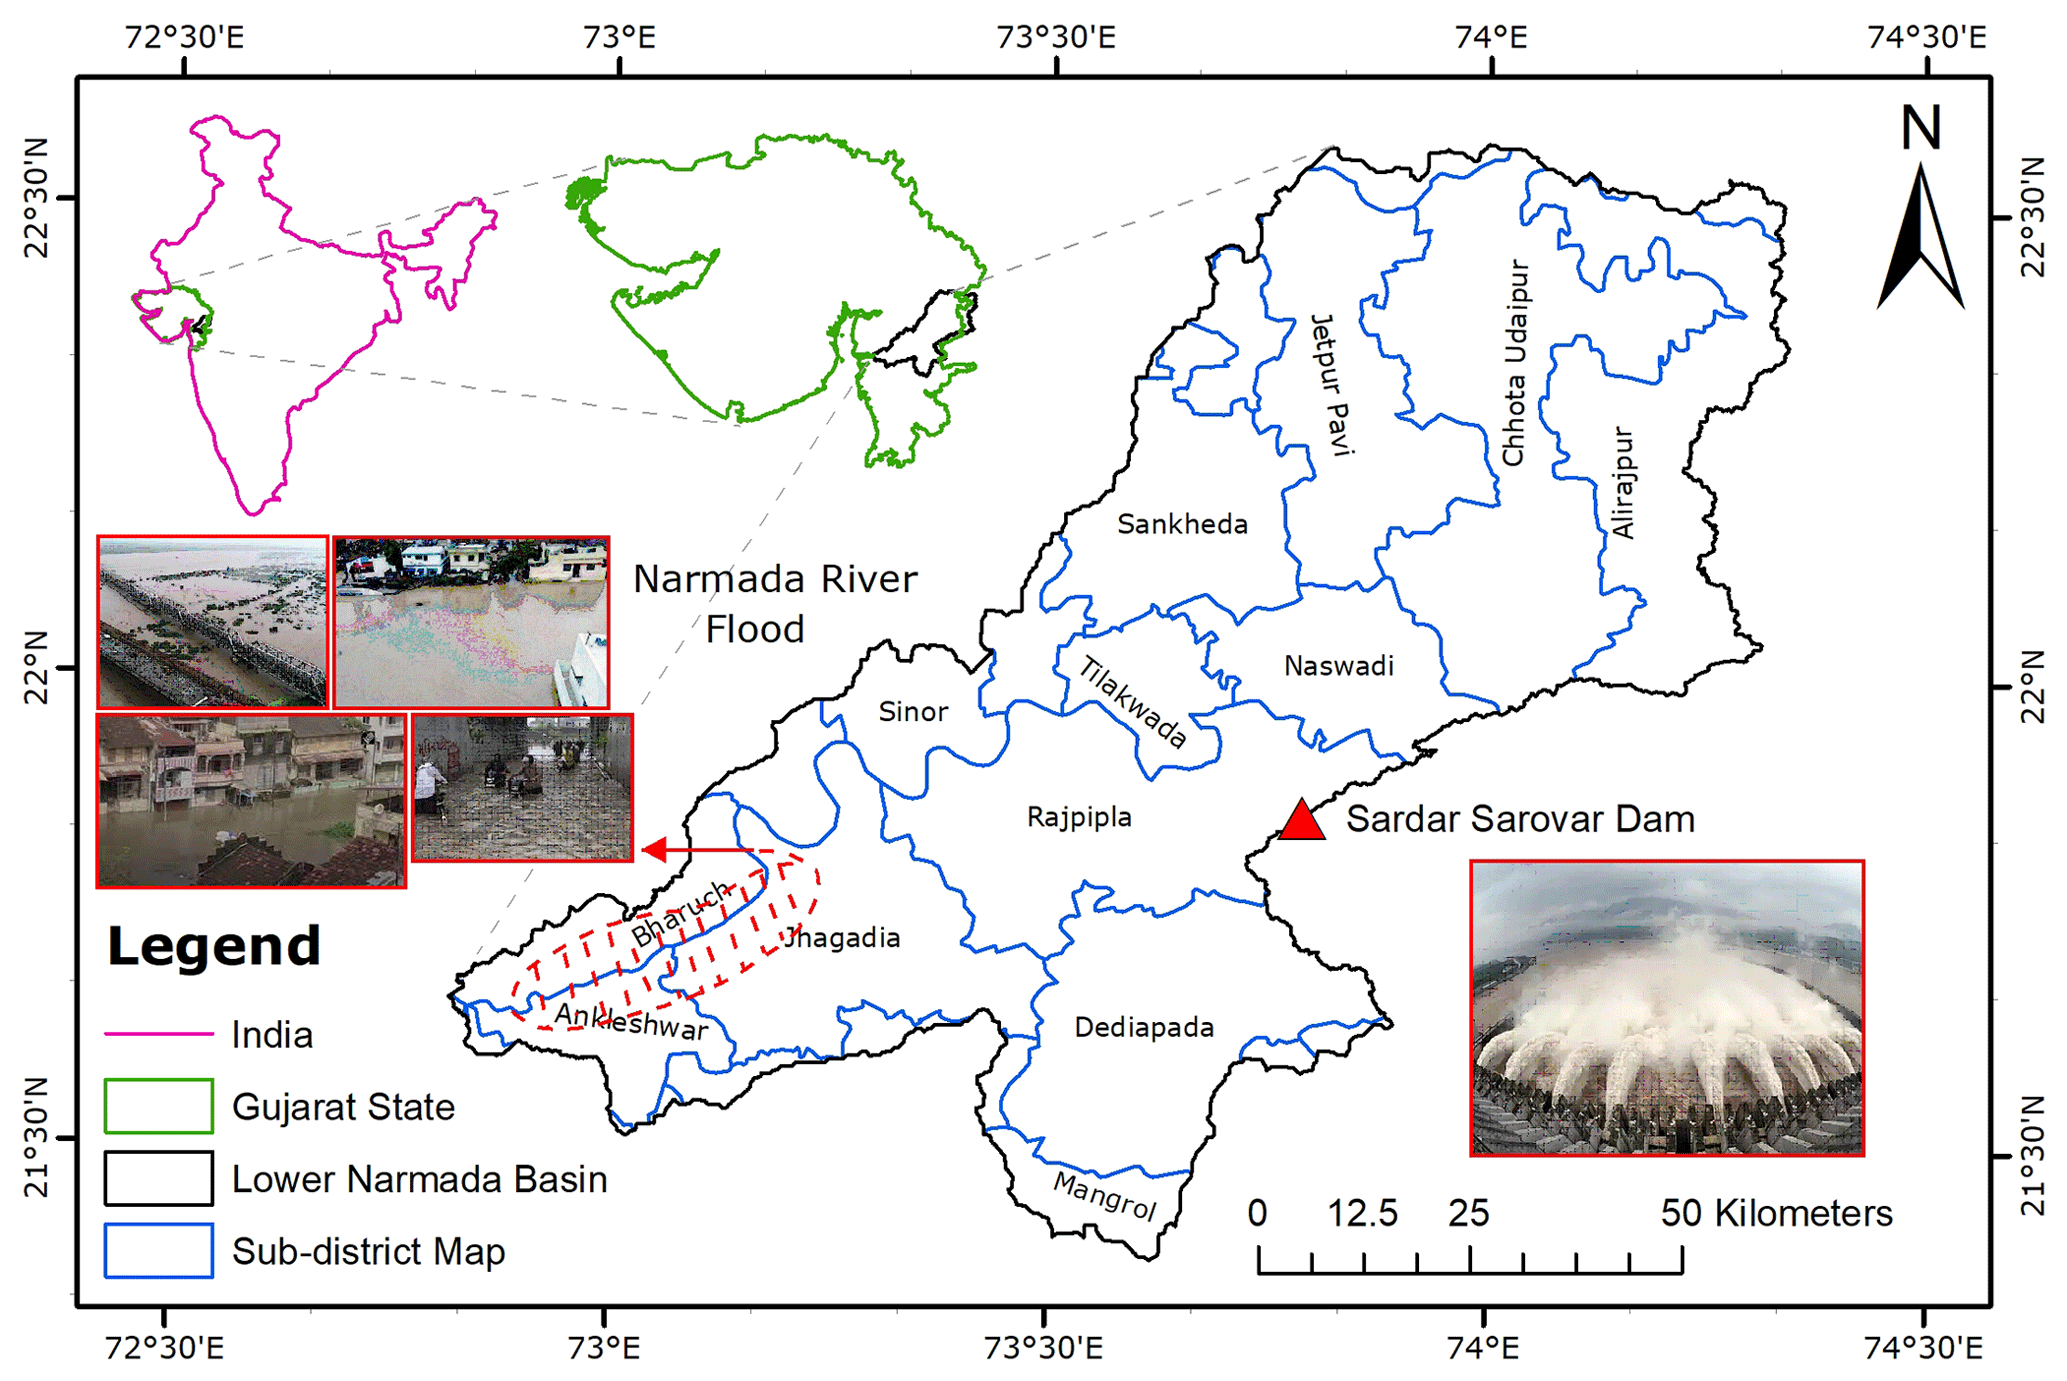
Figure 2Location of Narmada basin.
For both case studies, the models were not calibrated, since there was no spatial monitored data to calibrate CADDIES and HEC-RAS 2D. Additionally, the inflow data was used as input to LSTM and initial boundary condition to HEC-RAS. Even though, we have used a calibrated hyperparameter on the Manning's roughness coefficient, based on previous studies and land use characteristics.
Considering the different aspects of the two case studies, the flood model results were evaluated (Table 1). As seen from Fig. 3 and Table 1, the CADDIES model performed well in the Aricanduva basin, when comparing to HEC-RAS results. While for the Narmada basin, the flood extent and depth in the downstream part of the basin was severely underestimated (Fig. 4), when comparing to the results obtained by HEC-RAS.
The flood event in the Narmada basin is mainly a fluvial flood, that happens due to the incapacity of the river channel to conduct all the inflow that arrives from the Sardar Sarovar Dam, located upstream, during extreme rainfall events, overflowing. The HEC-RAS 2D can account for this overflow, since it takes the flow monitored coming from the dam as an upstream boundary condition. However, in the open-access version of the CADDIES model, the only input variable is the rainfall, therefore it cannot account with the inflow coming from the dam. This limitation explain the discrepancy between the Narmada case study results from HEC-RAS and CADDIES.
Table 1Model performance metrics.
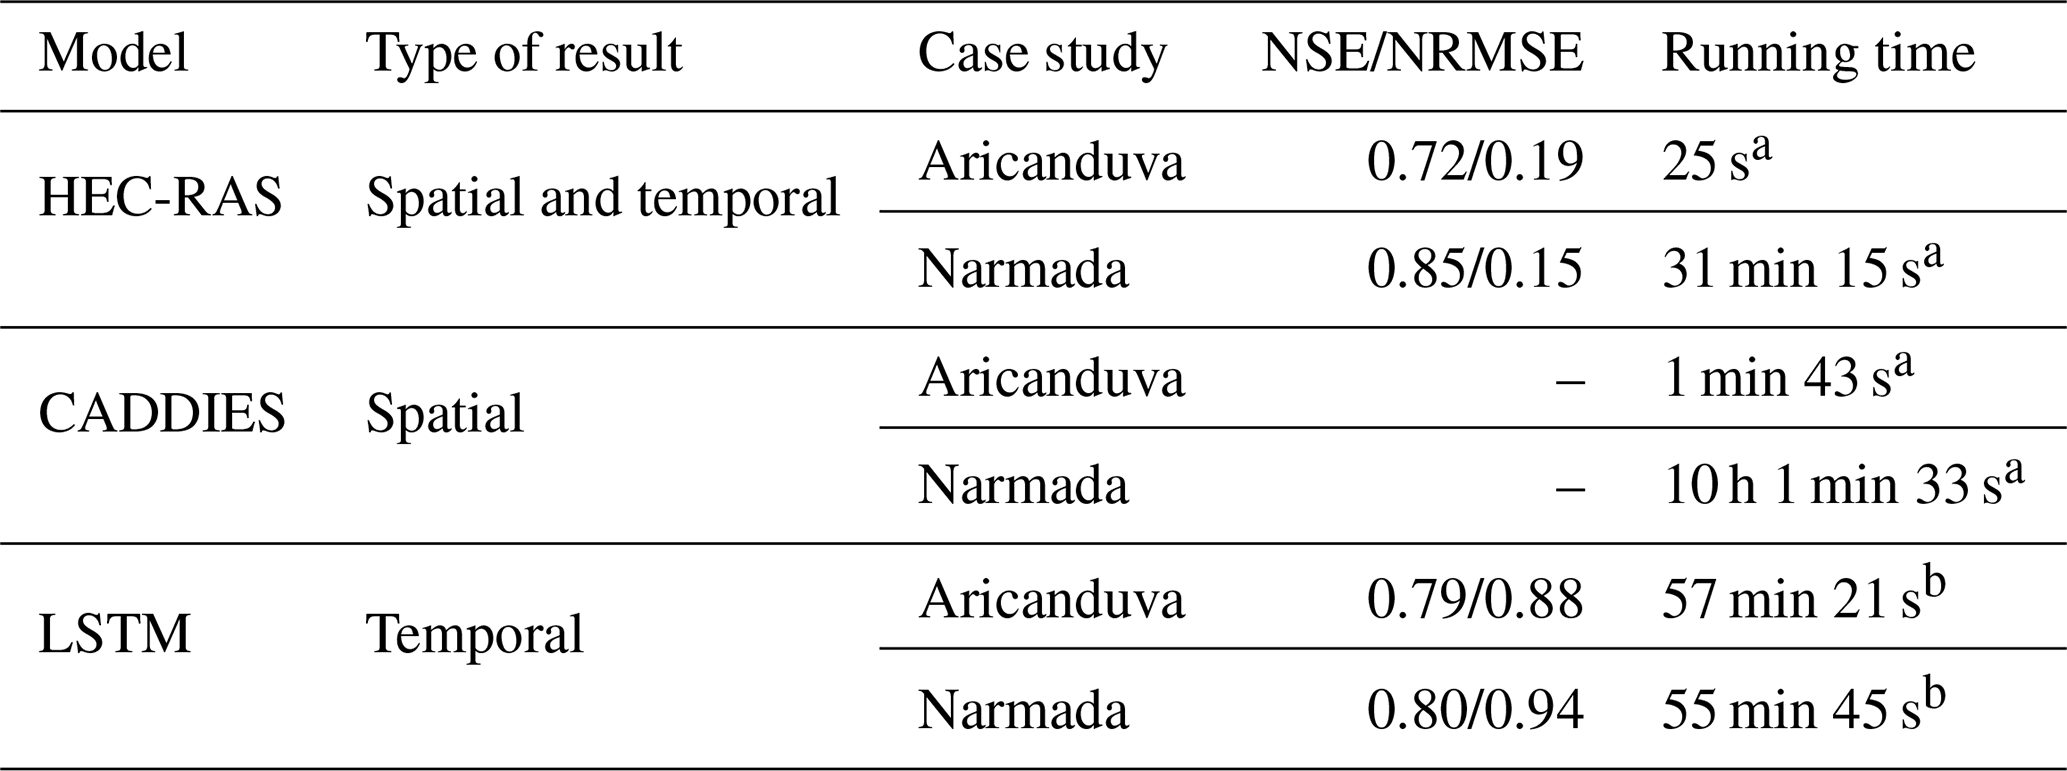
a i7-8565U CPU@ 1.80 GHz 1.99 GHz, RAM 8 GB. b Intel Xeon CPU E5-1650 v3@3.50 GHz 3.50 GHz, RAM 8 GB, training time and test time considered.
In the Aricanduva basin the CADDIES model performed well considering the simplicity of inputs. In this case, as the main problems related to flooding in the basin are due to rainfall, the model obtained good results. When analyzing the flood maps for the Aricanduva catchment using CADDIES and HEC-RAS, we can see that both generated very similar results. However, CADDIES takes much longer to run.
Another aspect to consider about the HEC-RAS is the higher level of knowledge of hydrological variables required from the user and their influence on the results. Thus, small changes in the variables used can be very significant in the final values, so uncertainty needs to be considered. On the other hand, there is also greater flexibility in adjusting and calibrating the model until obtaining satisfactory results.
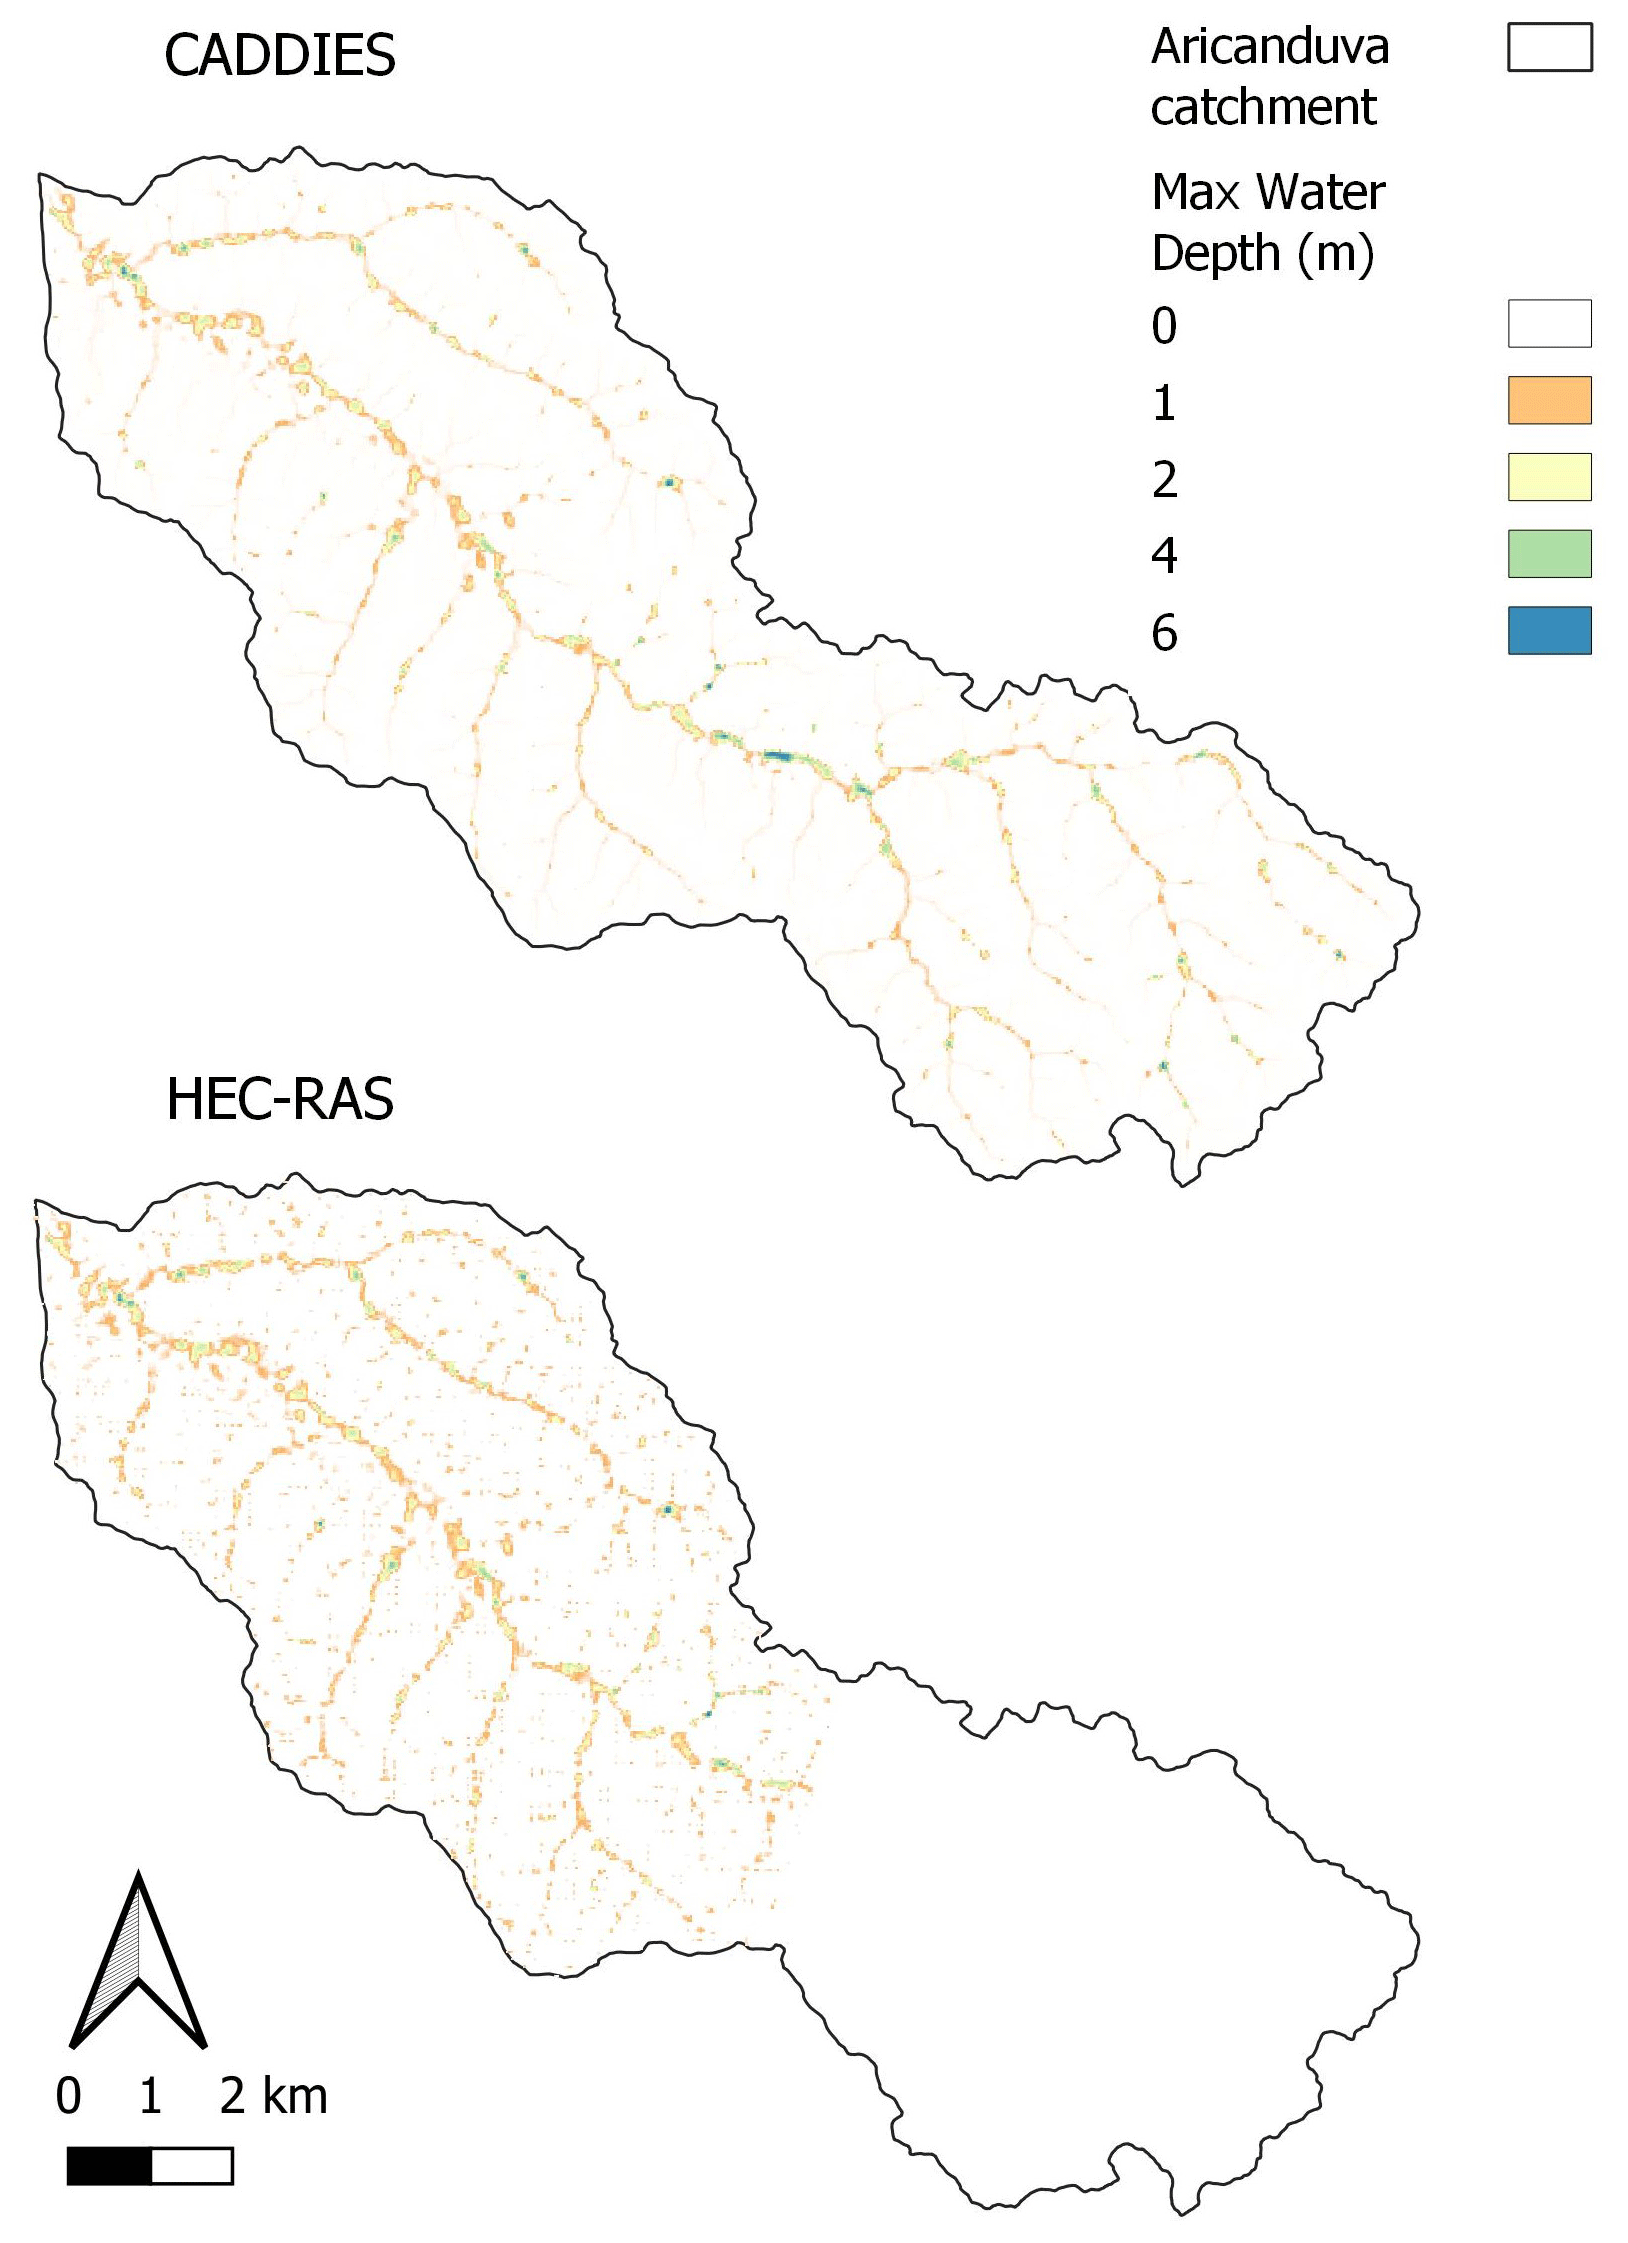
Figure 3Flood maps results for Aricanduva catchment when using CADDIES and HEC-RAS models.

Figure 4Flood maps results for Narmada basin when using CADDIES and HEC-RAS models.
Figure 5 shows SAISP reported flood locations in the Aricanduva catchment and the detailing of a flooding area in Aricanduva avenue near the bridge Eng. Alberto Badra during the flood event simulated by the models. The extent and values of the flooded spot are very similar for both models, including the numerical values for the pixel, 5.3 and 5.1 m using the CADDIES and HEC-RAS model, respectively. Thus, although we do not have enough data to validate the generated flood maps, we can consider the results satisfactory since most of the points reported as flood sites had the highest depths reported in the maps generated by the models, in addition to the consistency between both results.
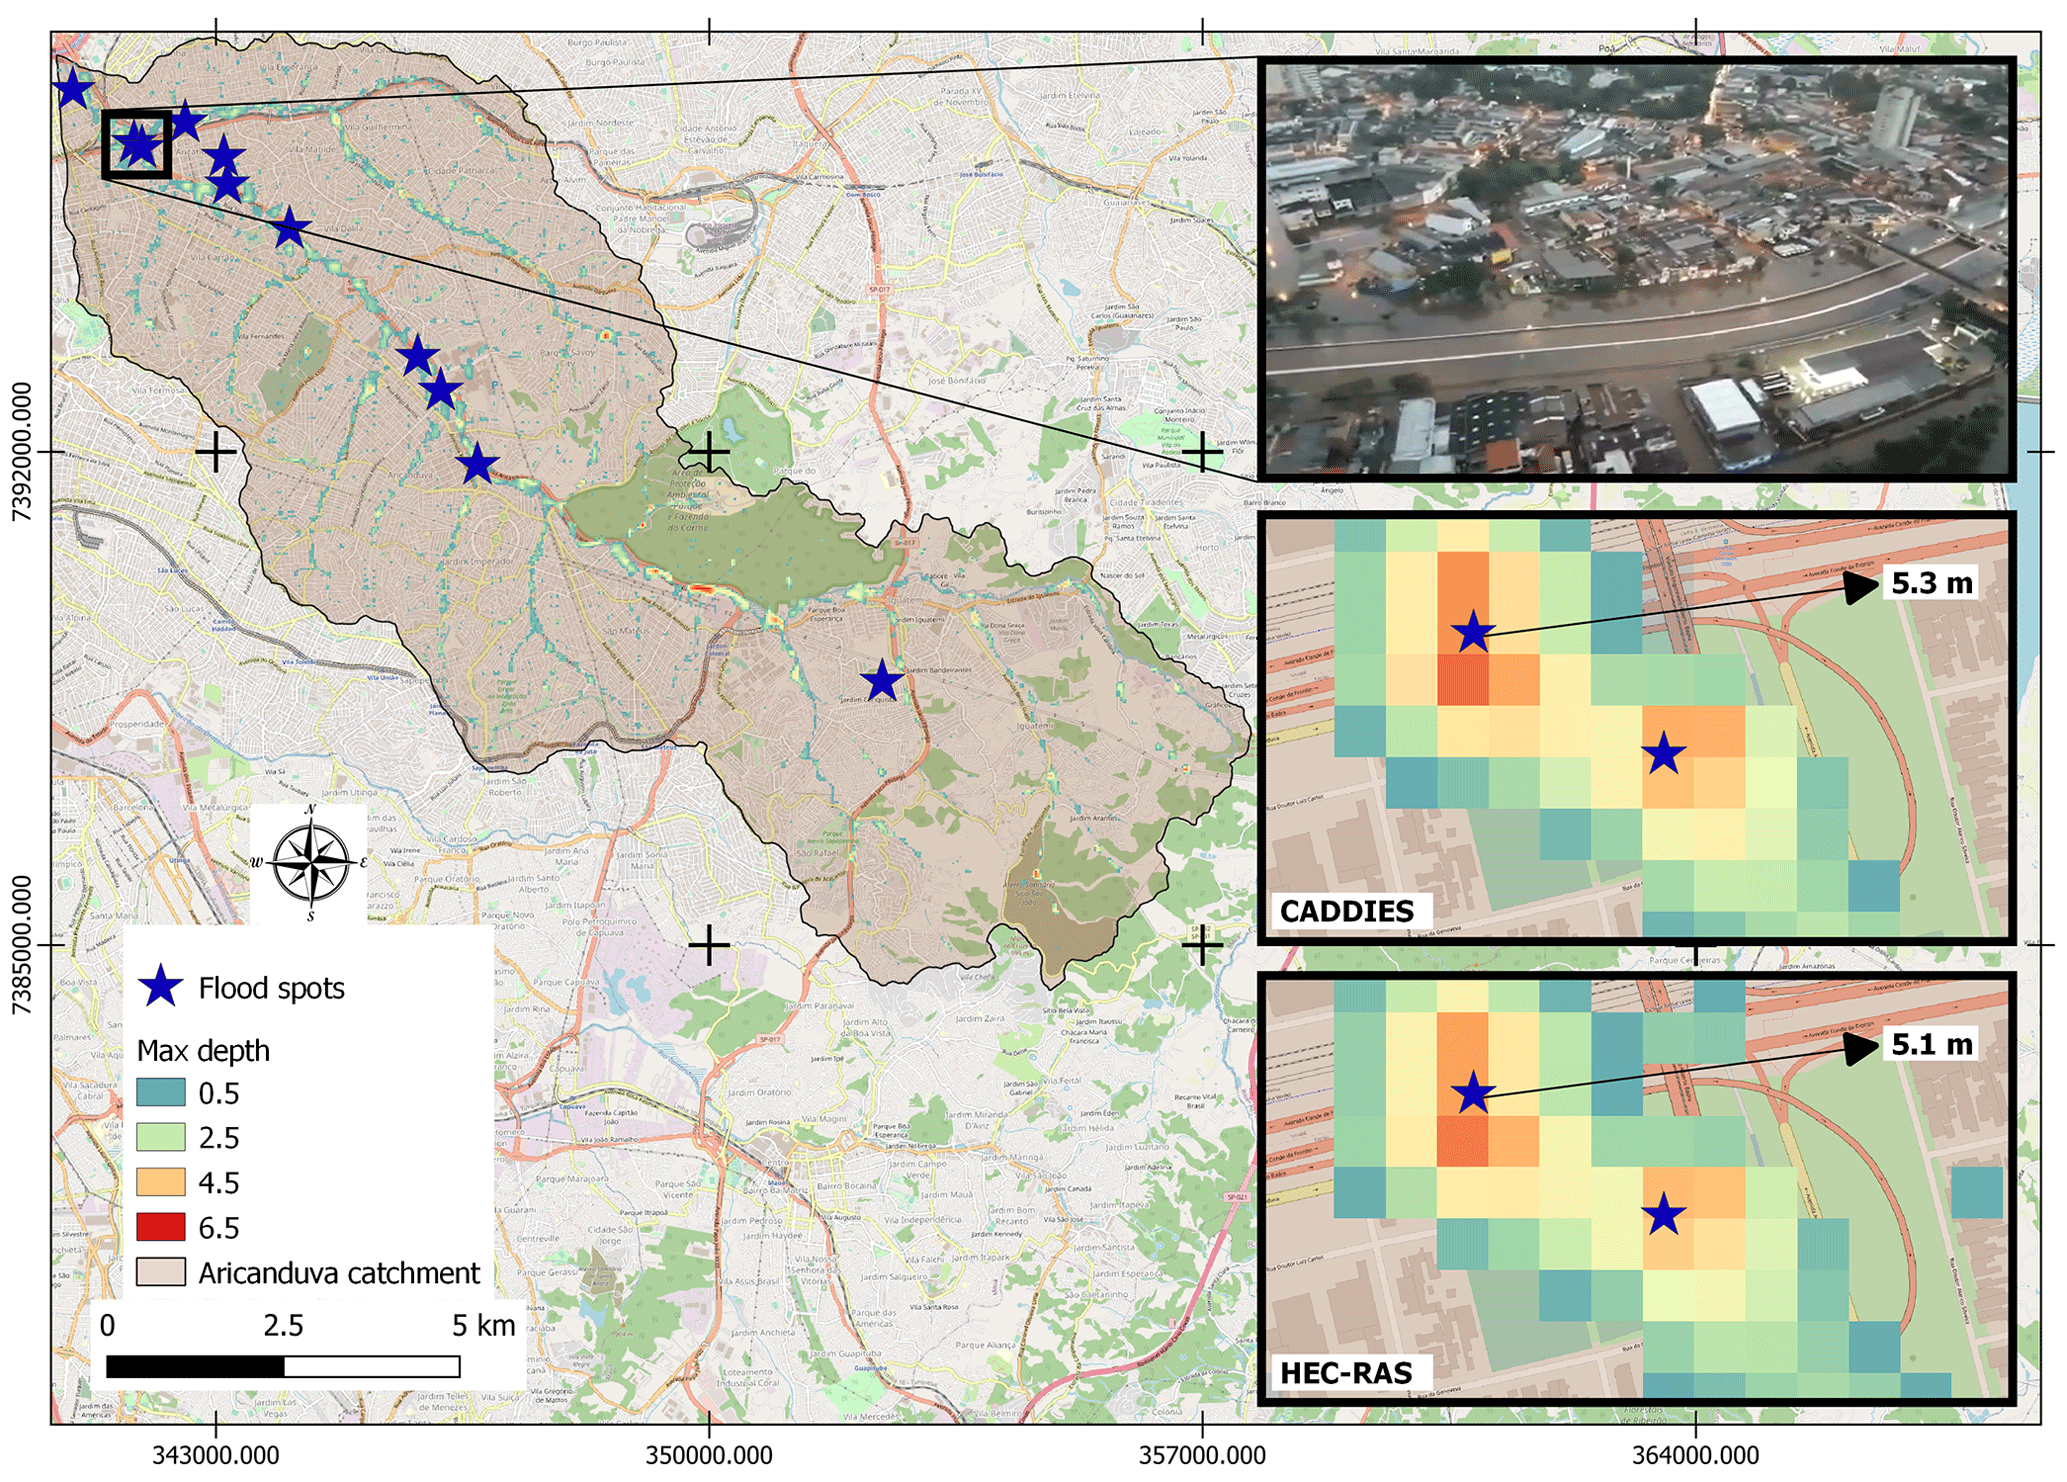
Figure 5Flood spots reported by SAISP and the max depth results for the area using CADDIES and HEC-RAS. Picture source: Paulino (2020).
LSTM and HEC-RAS models can generate discretized results in time. However, LSTM does not perform hydrodynamic simulations. The LSTM made reasonable estimates for both case studies (Table 1), proving to be quite flexible for different applications. It also had lower execution time than CADDIES, but still above HEC-RAS. The running time for LSTM have considered both training time and test time since we were comparing the entire applicability of the models. However, for practical application of the LSTM, after the training, only the test time must be considered, which was 19 s for both cases.
This study evaluated the performance of physically-based and AI-based models in predicting floods at (i) an urban catchment and relatively small area in Brazil and (ii) a rural and huge catchment in India.
From the results, the only unsuitable outcome from the models was the one for the Narmada basin using the CADDIES model. From this, we can conclude that the model is most adequate for urban areas, especially for pluvial floods, without a considerable amount of flow insertion in the system from some other river or upstream structure.
CADDIES and HEC-RAS had very similar results for the Aricanduva catchment. The advantage of CADDIES is that it is much simpler to configure, does not require the insertion of boundary conditions, and uses only rainfall as an input variable. However, the CADDIES model takes much longer to run. HEC-RAS has the advantage of allowing us to evaluate results over time. Further, it allows the simulation of several processes, simpler to complex settings depending on the data availability, and structured processes for model calibration and validation.
When considering execution time, accuracy, and temporal results, the LSTM model and the HEC-RAS appear ahead. Depending on the application of the results, the LSTM model may be more suitable, for example, for flow prediction for the operation of reservoirs and drainage control structures, since the flood extent visualization is not required for these cases and has the advantage of being more easily applied in different case studies.
We strongly suggest performing uncertainty analysis for future studies, as data limitation leads to significant uncertainty beyond the complexities in all the models used. Moreover, several other model configurations, metrics, and statistics should be analyzed in-depth when evaluating models' performance.
he HEC-RAS software is freely available from US Army Corps of Engineers Hydrologic Engineering Section (HEC, 2018, https://www.hec.usace.army.mil/software/hec-ras/). he CADDIES software is freely available from University of Exeter (Guidolin et al., 2016, https://www.exeter.ac.uk/research/centres/cws/resources/caddies/). The python code for developing the LSTM model can be accessed from https://github.com/mhpi/hydroDL (Feng et al., 2023), this code was developed from a third part.
The digital elevation map is available from the Shuttle Radar Topography Mission dataset from USGS Earthexplorer (https://earthexplorer.usgs.gov/, USGS, 2023). The rainfall and streamflow datasets for the Narmada basin are available from India Meteorological Department (IMD) (2023, https://dsp.imdpune.gov.in/) and India Water Resource Information System (India-WRIS) (2023, https://indiawris.gov.in/wris/), respectively. The rainfall and streamflow datasets for the Aricanduva catchment are available from the São Paulo Alert System of Inundation (SAISP) (SAISP, 2023, https://www.saisp.br/estaticos/sitenovo/home.html, https://portal.inmet.gov.br/).
MBdM: Writing – original draft preparation, Writing – review & editing, Visualization, Investigation, Formal analysis, Conceptualization. NKM: Writing – original draft preparation, Writing – review & editing, Software, Investigation, Formal analysis, Conceptualization. MCF: Writing – original draft preparation, Writing – review & editing, Visualization, Software, Formal analysis, Conceptualization. AS: Writing – review & editing, Investigation, Conceptualization. RFdS: Methodology, investigation. AA: Supervision, Conceptualization. MTR: Supervision, Conceptualization. EMM: Resources, Supervision, Conceptualization. NKG: Project administration, Conceptualization. MK: Project administration, Conceptualization. ACN: Project administration, Conceptualization.
The contact author has declared that none of the authors has any competing interests.
Publisher's note: Copernicus Publications remains neutral with regard to jurisdictional claims made in the text, published maps, institutional affiliations, or any other geographical representation in this paper. While Copernicus Publications makes every effort to include appropriate place names, the final responsibility lies with the authors.
This article is part of the special issue “ICFM9 – River Basin Disaster Resilience and Sustainability by All”. It is a result of The 9th International Conference on Flood Management, Tsukuba, Japan, 18–22 February 2023.
This research has been supported by the Belmont Forum Disaster Risk Reduction (DRR) (FAPESP grant no. 2020/15729-0 and FAPESP grant no. 2019/23393-4).
This paper was edited by Mohamed Rasmy and reviewed by three anonymous referees.
Barros, M. T., Conde, F., Andrioli, C. P., and Zambon, R. C.: Flood Forecasting System in a Mega City: Challenges and Results for the São Paulo Metropolitan Region, in: World Environmental and Water Resources Congress 2016, 10–19, https://doi.org/10.1061/9780784479889.002, 2016.
Batalini de Macedo, M., Fray da Silva, R., Fava, M. C., Sharma, A., K. Mangukiya, N., Sarmento Buarque, A. C., Razzolini, M. T., Mendiondo, E. M., Goel, N. K., Kurian, M., and Nardocci, A. C.: Modelling urban floods in megacities: a comparative bibliometric review of traditional physically based and artificial intelligence models, IAHS-AISH Scientific Assembly 2022, Montpellier, France, 29 May–3 June 2022, IAHS2022-687, https://doi.org/10.5194/iahs2022-687, 2022.
Feng, D., Liu, J., Bindas, T., and Fang, K.: HydroDL, Github [code], https://github.com/mhpi/hydroDL/, last access: 7 January 2023.
Guidolin, M., Chen, A. S., Ghimire, B., Keedwell, E. C., Djordjević, S., and Savić, D. A.: A weighted cellular automata 2D inundation model for rapid flood analysis, Environ. Model. Softw., 84, 378–394, https://doi.org/10.1016/j.envsoft.2016.07.008, 2016.
HEC – Hydrologic Engineering Center: HEC-RAS 5.0, Hydraulic Reference Manual, http://www.hec.usace.army.mil/software/hec-ras/documentation.aspx (last access: 1 January 2024), 2018.
IMD – India Meteorological Department: Data Supply Porta, IMD [data set], https://dsp.imdpune.gov.in/, last access: 7 January 2023.
India-WRIS – India Water Resource Information System: Data availability, India-WRIS [data set], https://indiawris.gov.in/wris/#/, last access: 7 January 2023.
Mangukiya, N. K., Sharma, A., and Shen, C.: How to enhance hydrological predictions in hydrologically distinct watersheds of the Indian subcontinent?, Hydrol. Process., 37, e14936, https://doi.org/10.1002/hyp.14936, 2023.
Paulino, E.: Alagamento interdita trechos da Avenida Aricanduva, Mobilidade Sampa: Brazil, https://mobilidadesampa.com.br/2020/03/alagamento-interdita-trechos-da-avenida-aricanduva/ (last access: 1 January 2024), 2020.
SAISP – São Paulo Alert System of Inundation, Public Products, SAISP [data set], https://www.saisp.br/estaticos/sitenovo/home.html, last access: 7 January 2023.
Shen, C.: A transdisciplinary review of deep learning research and its relevance for water resources scientists, Water Resour. Res., 54, 8558–8593, https://doi.org/10.1029/2018WR022643, 2018.
Simas, I. T. H.: Análise retrospectiva de episódios de inundações na Bacia Hidrográfica do Rio Aricanduva – São Paulo [Retrospective analysis of flooding episodes in the Aricanduva River catchment – São Paulo], Thesis, Universidade de São Paulo, São Paulo, https://doi.org/10.11606/D.8.2017.tde-21072017-162915, 2017.
USGS – US Geological Survey: EarthExplorer, USGS [data set], https://earthexplorer.usgs.gov/, last access: 7 January 2023.