the Creative Commons Attribution 4.0 License.
the Creative Commons Attribution 4.0 License.
 | 18 Apr 2024
Flood monitoring system in the Dakar agglomeration (Senegal)
Laurent Pascal Diémé
Christophe Bouvier
Ansoumana Bodian
Alpha Sidibé
In recent decades, African cities have been confronted with series of floods linked to rapid urbanisation, intensification of heavy rains and the failure of the storm drainage system. Developing tools to characterise floods and reduce their impact is essential to facilitate decision support in a complex and vulnerable context. This study, conducted in the urban periphery of the Dakar metropolitan area, aims to propose a fine resolution (5 m) model of flows and overflows of rainwater drainage network in a pilot area. Two methodological steps are combined to achieve this objective: (1) the construction of the urban drainage topology to reconstitute the water drainage directions, taking into account the buildings, artificial channels and retention basins, using algorithms developed for this purpose, (2) simulations of the flows in real time or in project mode, using a parsimonious spatial model adapted to the local context, coupling a hydrological model (SCS-LR) on the scale of small basins with a hydraulic model (kinematic wave) for the propagation through the hydrological network. The former ensures the speed of the calculation, and the latter provides precise information on the behaviour of the network during a rainfall event. The overflow points of the network are detected by the difference between the maximum flow and the capacity of the network to evacuate floods. This modelling provides sufficiently informative simulations to guide the deployment of emergency services in the field, in real time, or to evaluate the efficiency of infrastructures in project mode, in a context of limited data. The model also provides boundary conditions for applying more complex hydraulic models to determine the impact of overtopping on limited areas.
- Article
(6929 KB) - Full-text XML
- BibTeX
- EndNote


UPH 21; modelling; floods; drainage topology; Dakar; Athys
Floods are recurrent in most urban areas in West Africa such as Nouakchott, Ouagadougou, Accra, Douala, Lagos, or Dakar, with impacts on populations, public health, economy and living environment (Satterthwaite, 2017). These cities have a high level of vulnerability and appear less resilient to floods due to their limited coping capacities (Bruckman et al., 2019). The trend towards increased intense precipitations, attributed to climate change (Panthou et al., 2018; Chagnaud et al., 2022), is expected to increase the recurrence of urban flooding. This brings with it challenges in terms of socio-economic development and flood risk management in these cities where urban sprawl is rapid and sometimes unregulated (Jaglin et al., 2018; Williams et al., 2019). It is expected that the impacts of future urban flooding can be limited not only by risk reduction measures but also by the implementation of forecasting systems that are essential to facilitate decision support in this complex and vulnerable context. One of the challenges is to understand and anticipate the risks of stormwater overflow (Renard and Riquier, 2008). Several approaches exist in the literature to identify the areas likely to be flooded by runoff. They range from methods strictly based on the analysis of topographic information to locate areas of water concentration (Pons et al., 2010), to methods introducing hydrological (Landemaine, 2016), 1D hydraulic (Pons et al., 2014) or 2D (Pons et al., 2021) modelling. However, these methods are relatively limited and do not always take into account the effects of urbanisation or the various urban infrastructures that modify the directions of surface runoff.
The present study, carried out in the urban periphery of the Dakar conurbation, aims firstly to construct a topology that integrates urban objects modifying the drainage directions and secondly to propose a calculation method that makes it possible to locate the overflows of the stormwater drainage network on the scale of the agglomeration, with calculation times compatible with real-time forecasting.
Dakar, the capital of Senegal, hosts 50 % of the country's urban population over only 0.3 % of the national territory (ANSD, 2013). Its urbanisation took place rapidly, in a few decades, largely sustained by the flows of rural exodus following the drought of the 1970s. The largest concentrations of population (Fig. 1) are found in the suburbs and the new extension areas of the city (Lessault and Imbert, 2013). Vulnerability is further exacerbated by the poor coverage of adequate rainwater drainage systems. Thus, since 2005, Dakar has been subject to floods that have strongly affected the population and their living environment, the infrastructures, the economy and the environment. There is a growing interest in characterising and reducing the impacts of floods in a context of intense rainfall and rapid urbanisation.
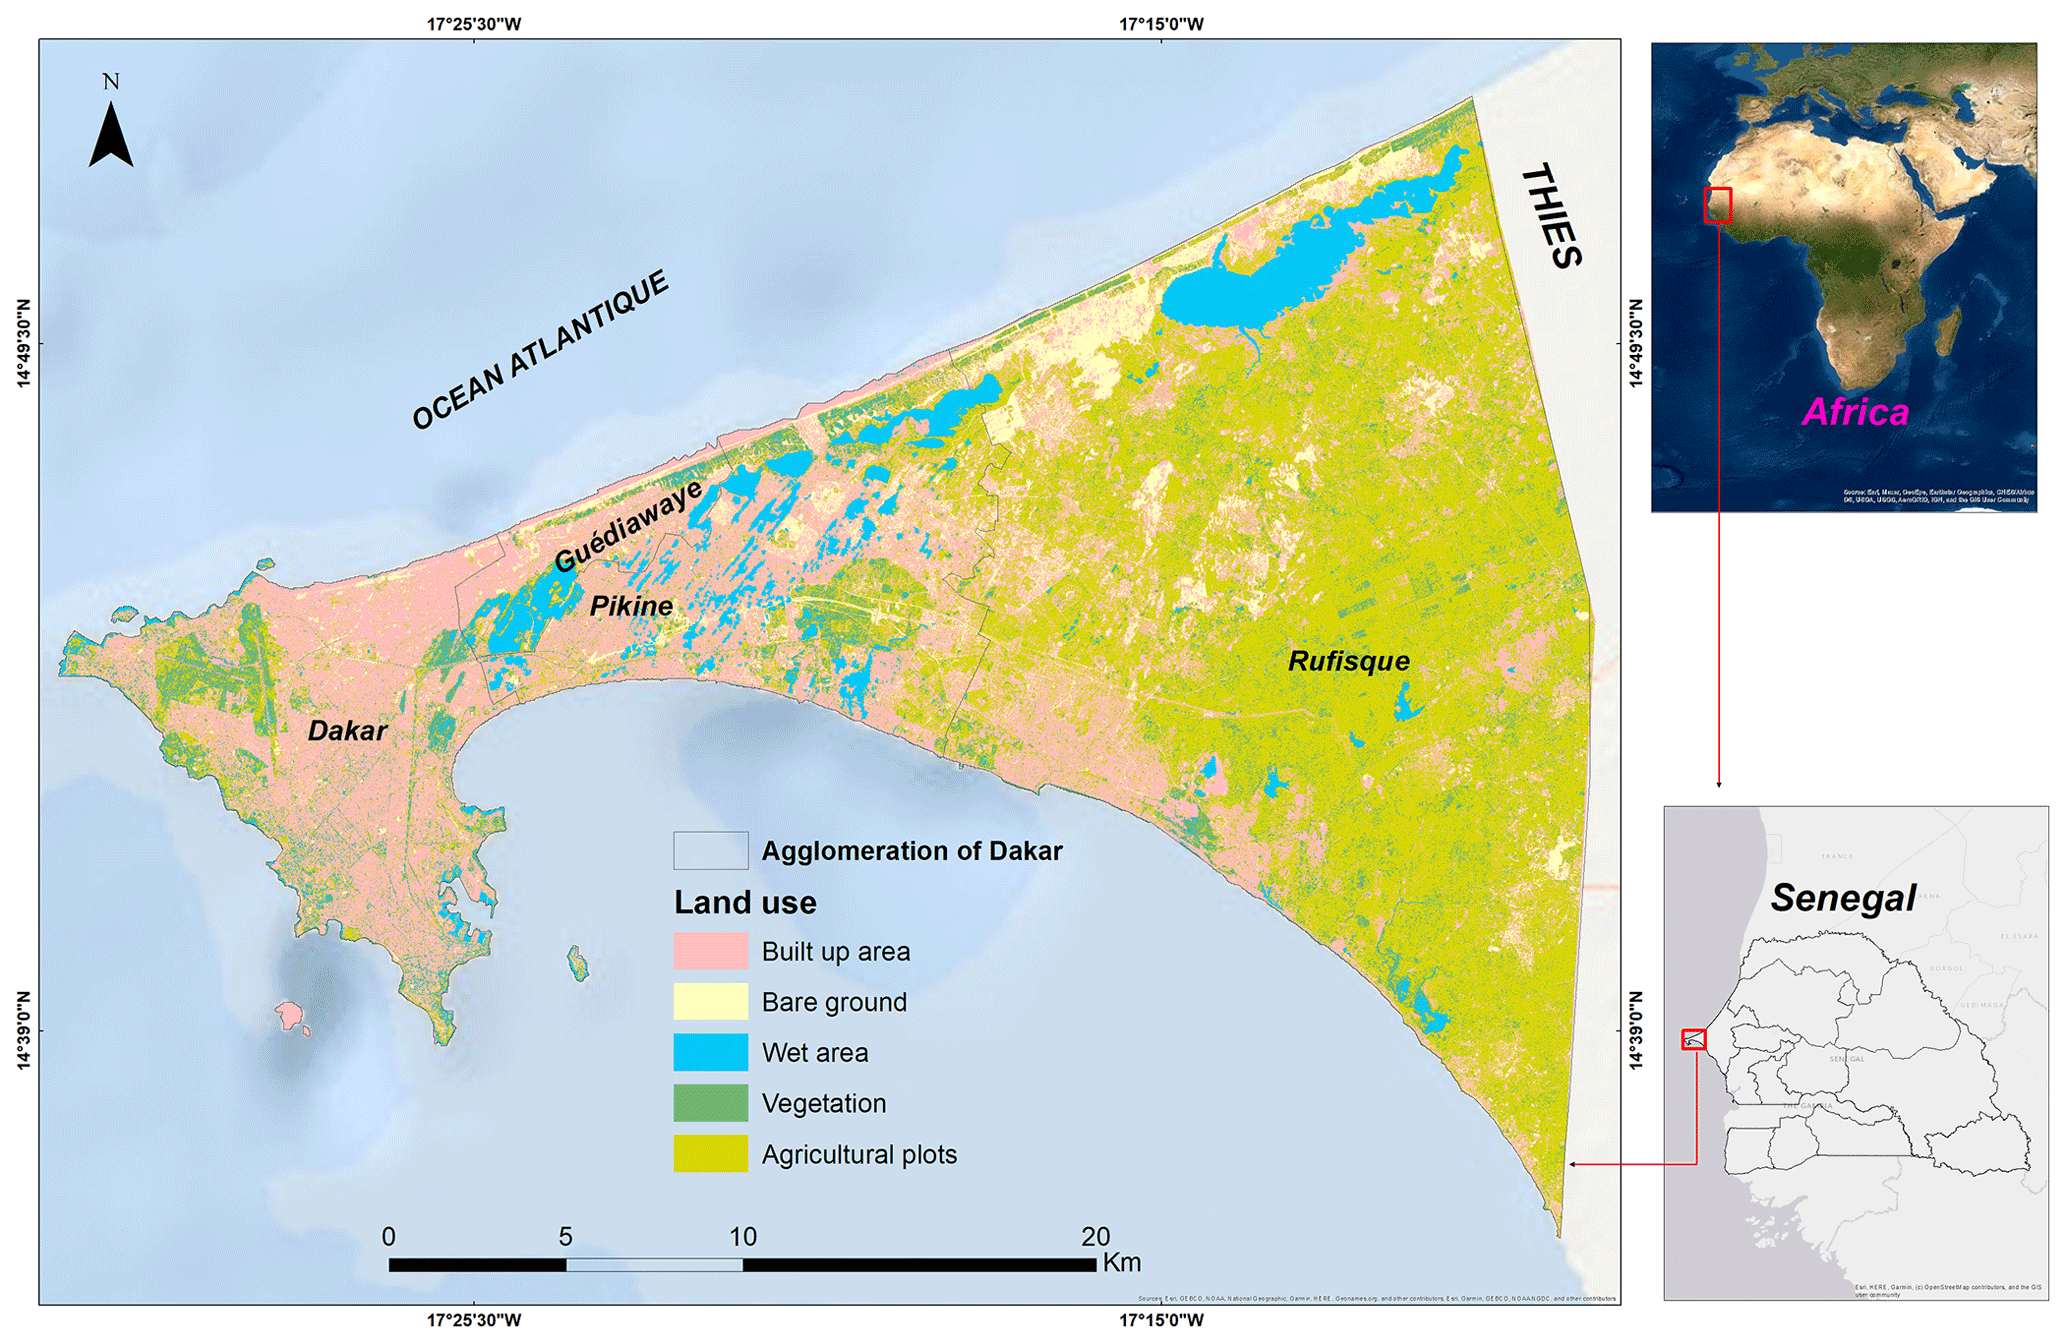
Figure 1Location of the Dakar agglomeration.
The study area covers the communes of Pikine-Guédiawaye (Fig. 2), where the data were most detailed. These data come from the Dakar urban database set up at the DPGI (Direction de la Prévention et de la Gestion des Inondations au Sénégal) and the DTGC (Direction des Travaux Géographique et de la Cartographie). These are: (i) the Digital Terrain Model (DTM) of 10 m resolution from which the water flow paths are determined, (ii) the location of buildings, which constitute obstacles to the surface water flow, (iii) the buried and surface drainage channels and pipes which can modify or replace natural pathways, (iv) the rainwater retention basins.
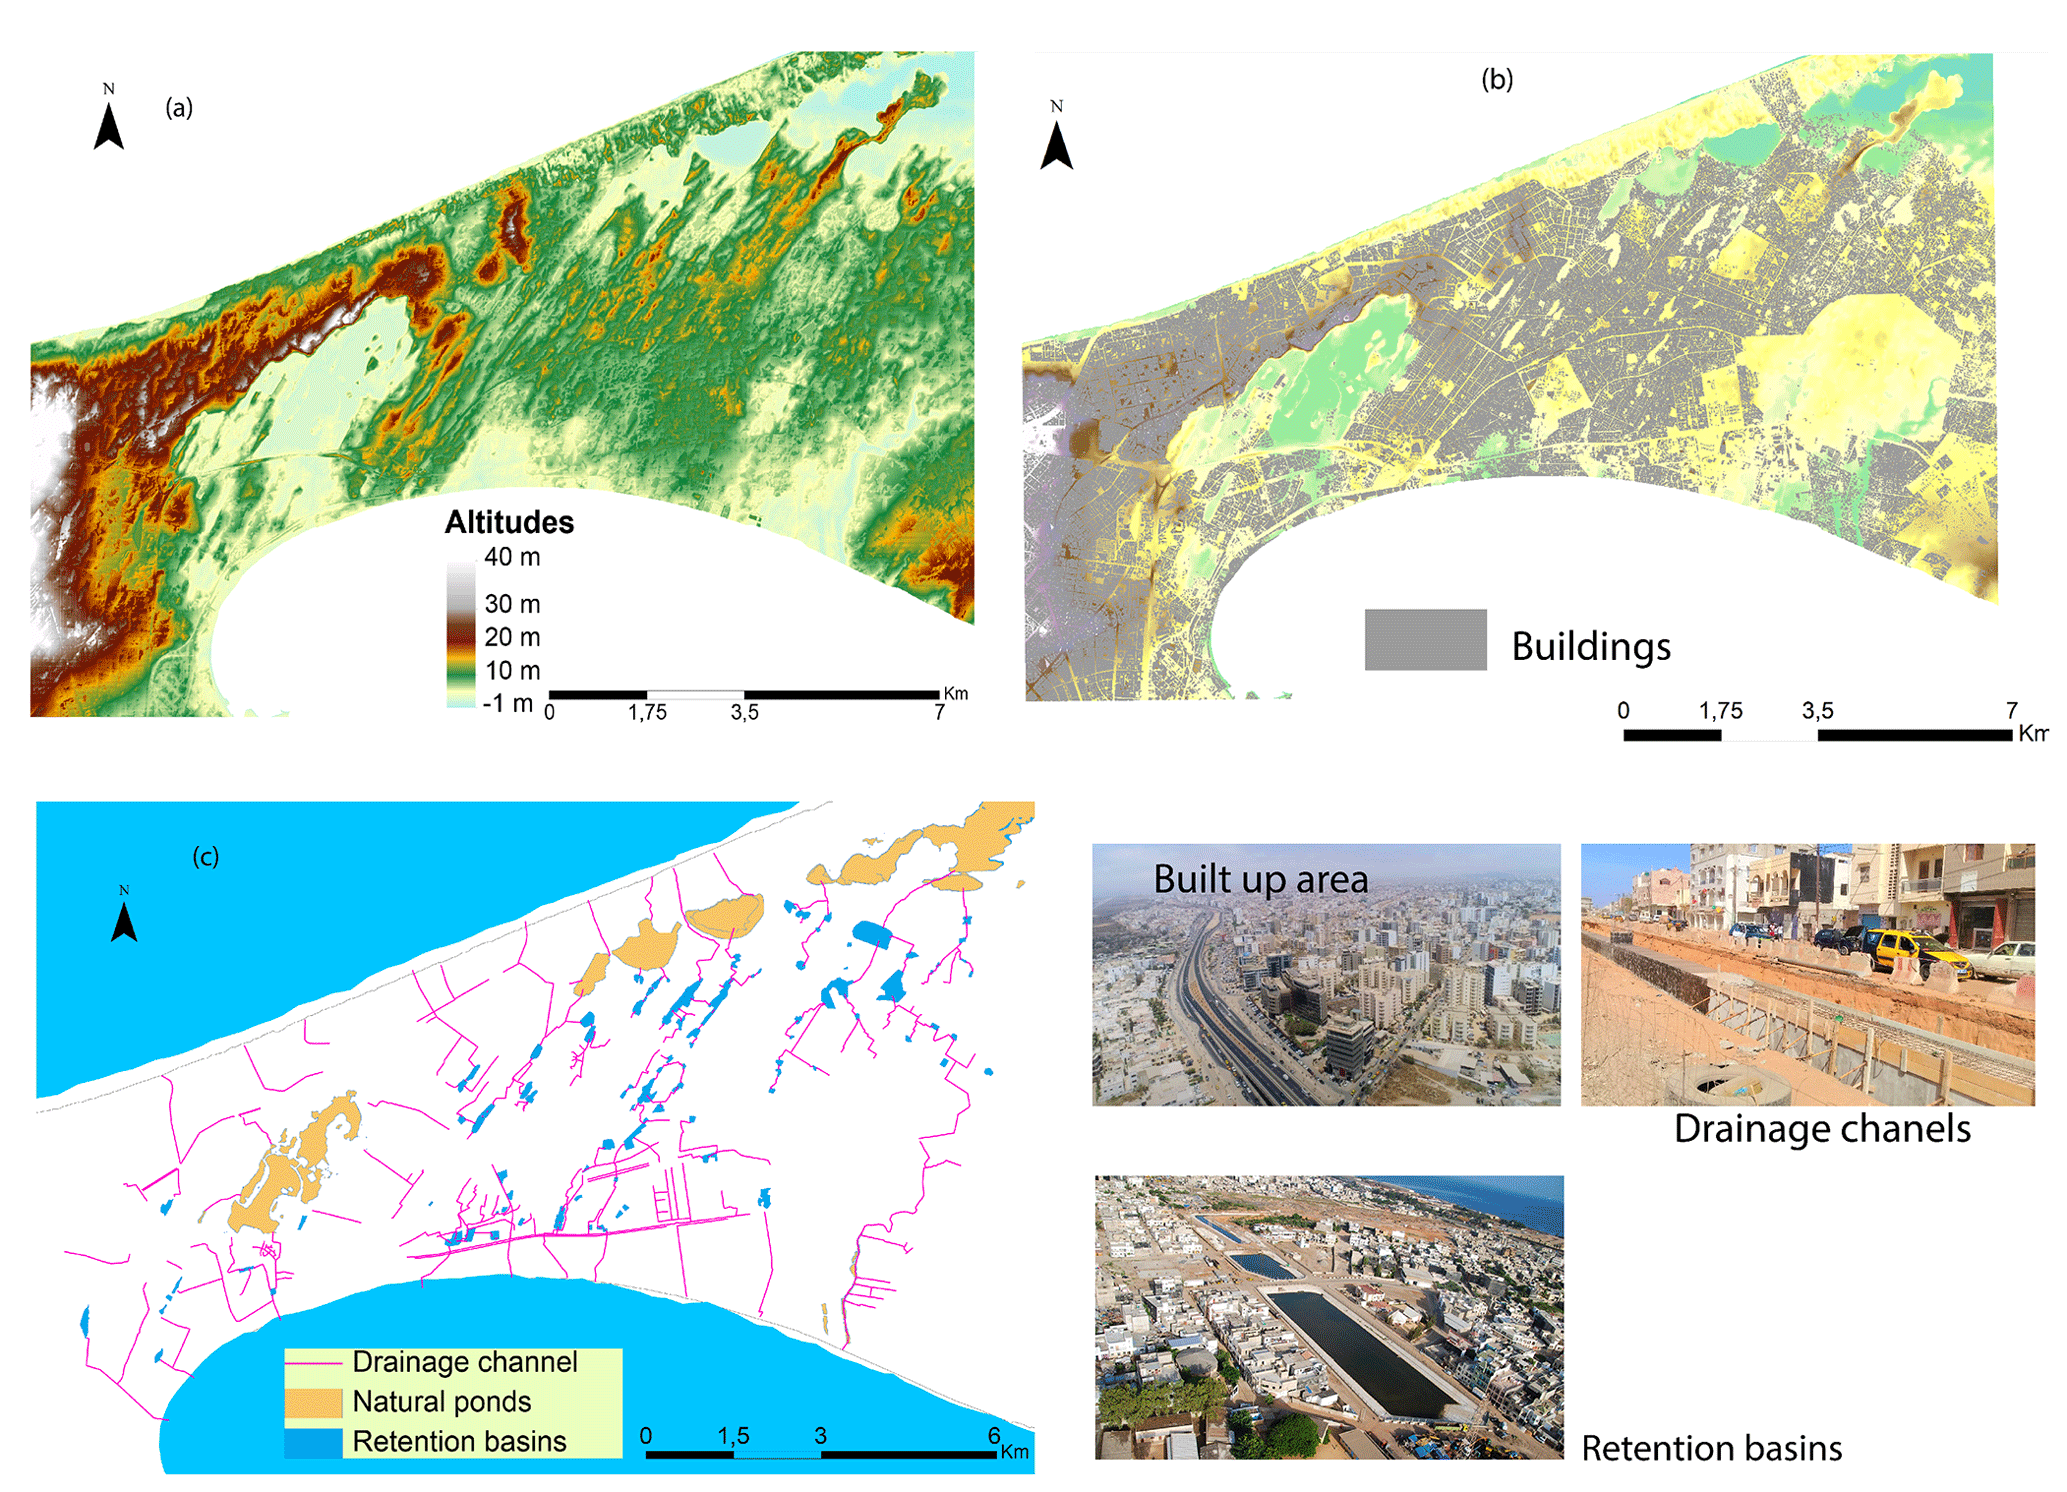
Figure 2Geographical data modifying flow directions: (a) DTM, (b) buildings, (c) channels and retention basins.
The methodology for processing the DTM and modifying it to integrate the drainage directions induced by both the location of buildings, drains and retention basins has been described in detail by Diémé et al. (2022). The general principles are recalled in the following.
4.1 DTM processing
The DTM is the basis for the method of constructing the drainage topology. From this DTM, the natural drainage direction in one of the 8 directions is determined for each grid cell over the test area (Jenson and Domingue, 1988). All the drainage directions are then forced to integrate successively the obstacles to water flow, the stormwater collectors and the retention basins.
4.1.1 Include water flow obstacles in the DTM
The principle for forcing flows through obstacles is to raise the elevations corresponding to these obstacles (here the urban blocks) by 20 m in the DTM. This will have the effect of preventing flows from crossing these obstacles. This classic operation can be carried out with GIS tools (ArcGIS, Qgis) or in the Vicair module of the ATHYS modelling platform (http://www.athys-soft.org/, last access: 22 May 2022).
4.2 Integration of the stormwater drainage
The drainage model forced by the building is used as a basis for integrating the modifications according to the location of the stormwater drainage. The algorithm developed for this purpose in the Vicair module considers the rasterised plan of the drains, identifies the two upstream and downstream ends of each section and then orients the drainage directions along the section from the higher end to the lower end. The elevations are read from either the DTM or an attribute table entered to take into account buried collectors. The final result is a drainage model forced by both the urban blocks and the pluvial drains.
4.3 The integration of retention basins
The retention basins are located in the previously defined drainage model using the rasterised plan of their location. The algorithm developed in Vicair determines the outlet of each basin by searching for a channel mesh whose direction of flow drains the basin; all the basin meshes are then oriented towards this outlet. The method thus allows the construction of a drainage model forced by urban blocks, drainage channels and retention basins (Fig. 3).
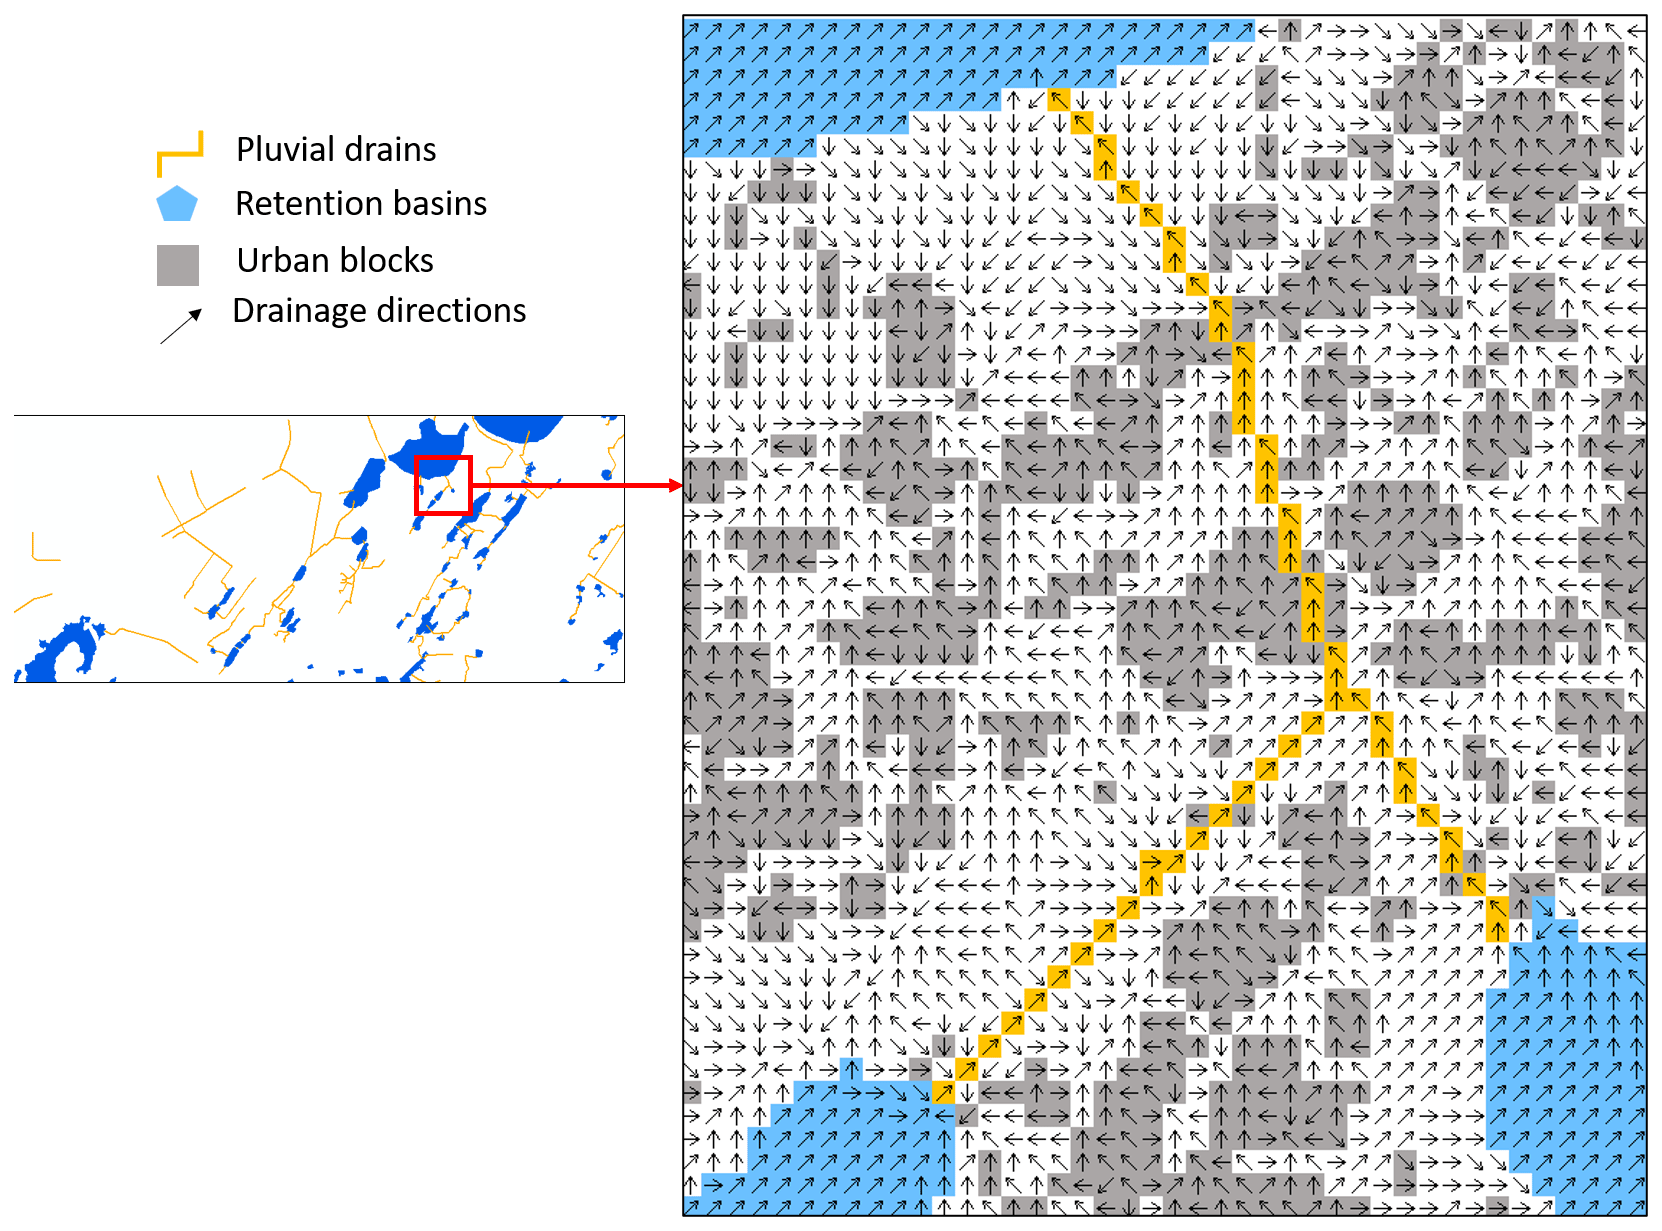
Figure 3Forced drainage directions according to urban blocks (grey), drains (yellow) and retention basins (blue).
The study area was discretised into elementary catchments with an urban area of approximately 10 ha, an algorithm in the Vicair module. The flow network is defined as the meshes that drain more than one hectare.
The hydrological model SCS-LR (Soil Conservation Service – Lag and Route) first calculates the flood hydrographs at the outlet of each catchment, taking into account the type of land use. These hydrographs are then injected and propagated in the network by the KW (Kinematic Wave) hydraulic model.
The parameters required for the SCS production model are S (maximum capacity of soil water) and Ia (losses before runoff). These parameters were calibrated based on rainfall-runoff observations made by Bassel (1996) in the Fann-Mermoz experimental basin. According to these data, the decennial runoff coefficient in the basin is equal to the building coefficient (0.2), which led to consider S = 120 mm and Ia = 0.2 mm. The parameterization and spatialization of the production on the study area was done using the GIS layers of the buildings to estimate the density of the urbanization at the scale of each urban block (Fig. 4) and to classify the production units according to the types of density: not urbanized, not very dense urbanization, medium dense and very dense. For very dense urbanisation class (75 % to 93 %) we find S = 5 mm, Ia = 0.2 mm which corresponds to a runoff coefficient of 0.92.
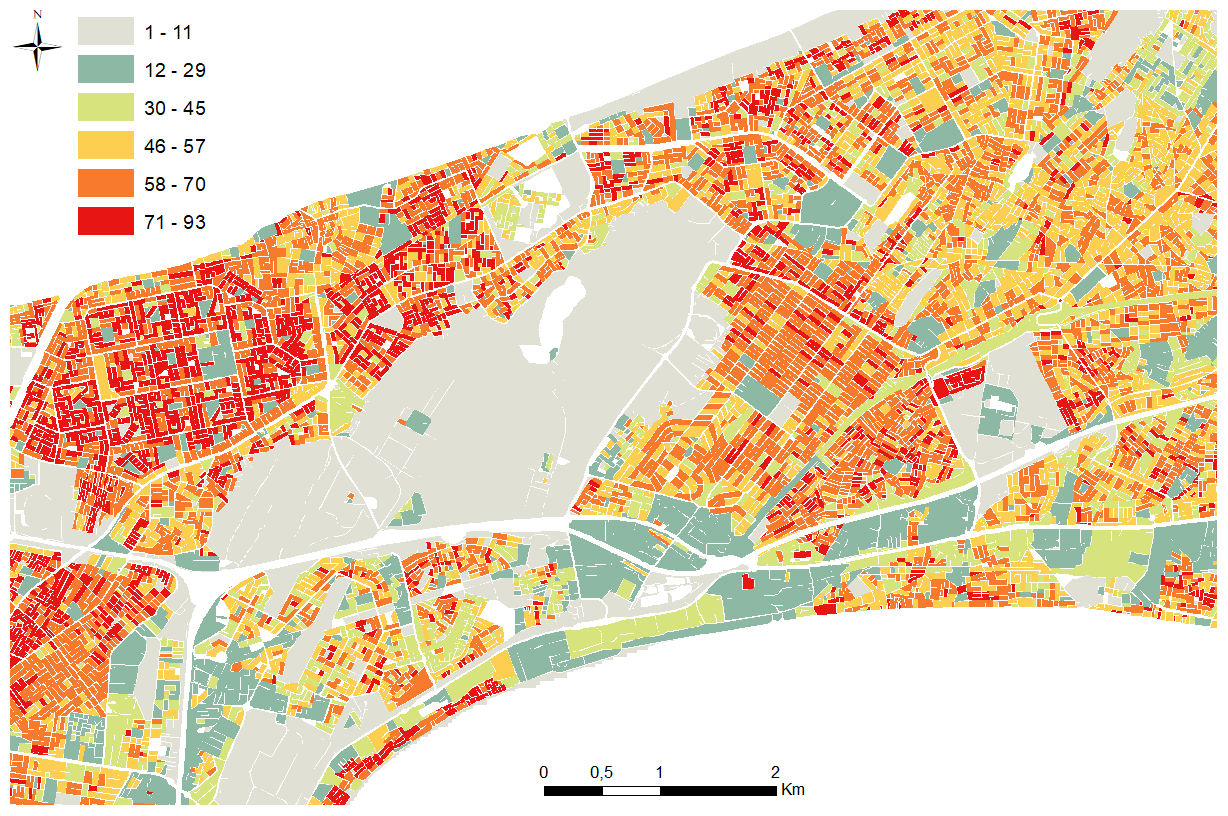
Figure 4Density of urbanisation at the level of each urban block (%).
The LR transfer model applied for the elementary basins has two parameters Vo which is the transfer velocity (in m s−1) on each mesh and Ko the proportionality coefficient between translation and diffusion. Based on the study by Bassel (1996), the parameter Vo was set to 1 m s−1 and Ko was left at 0.7 by default.
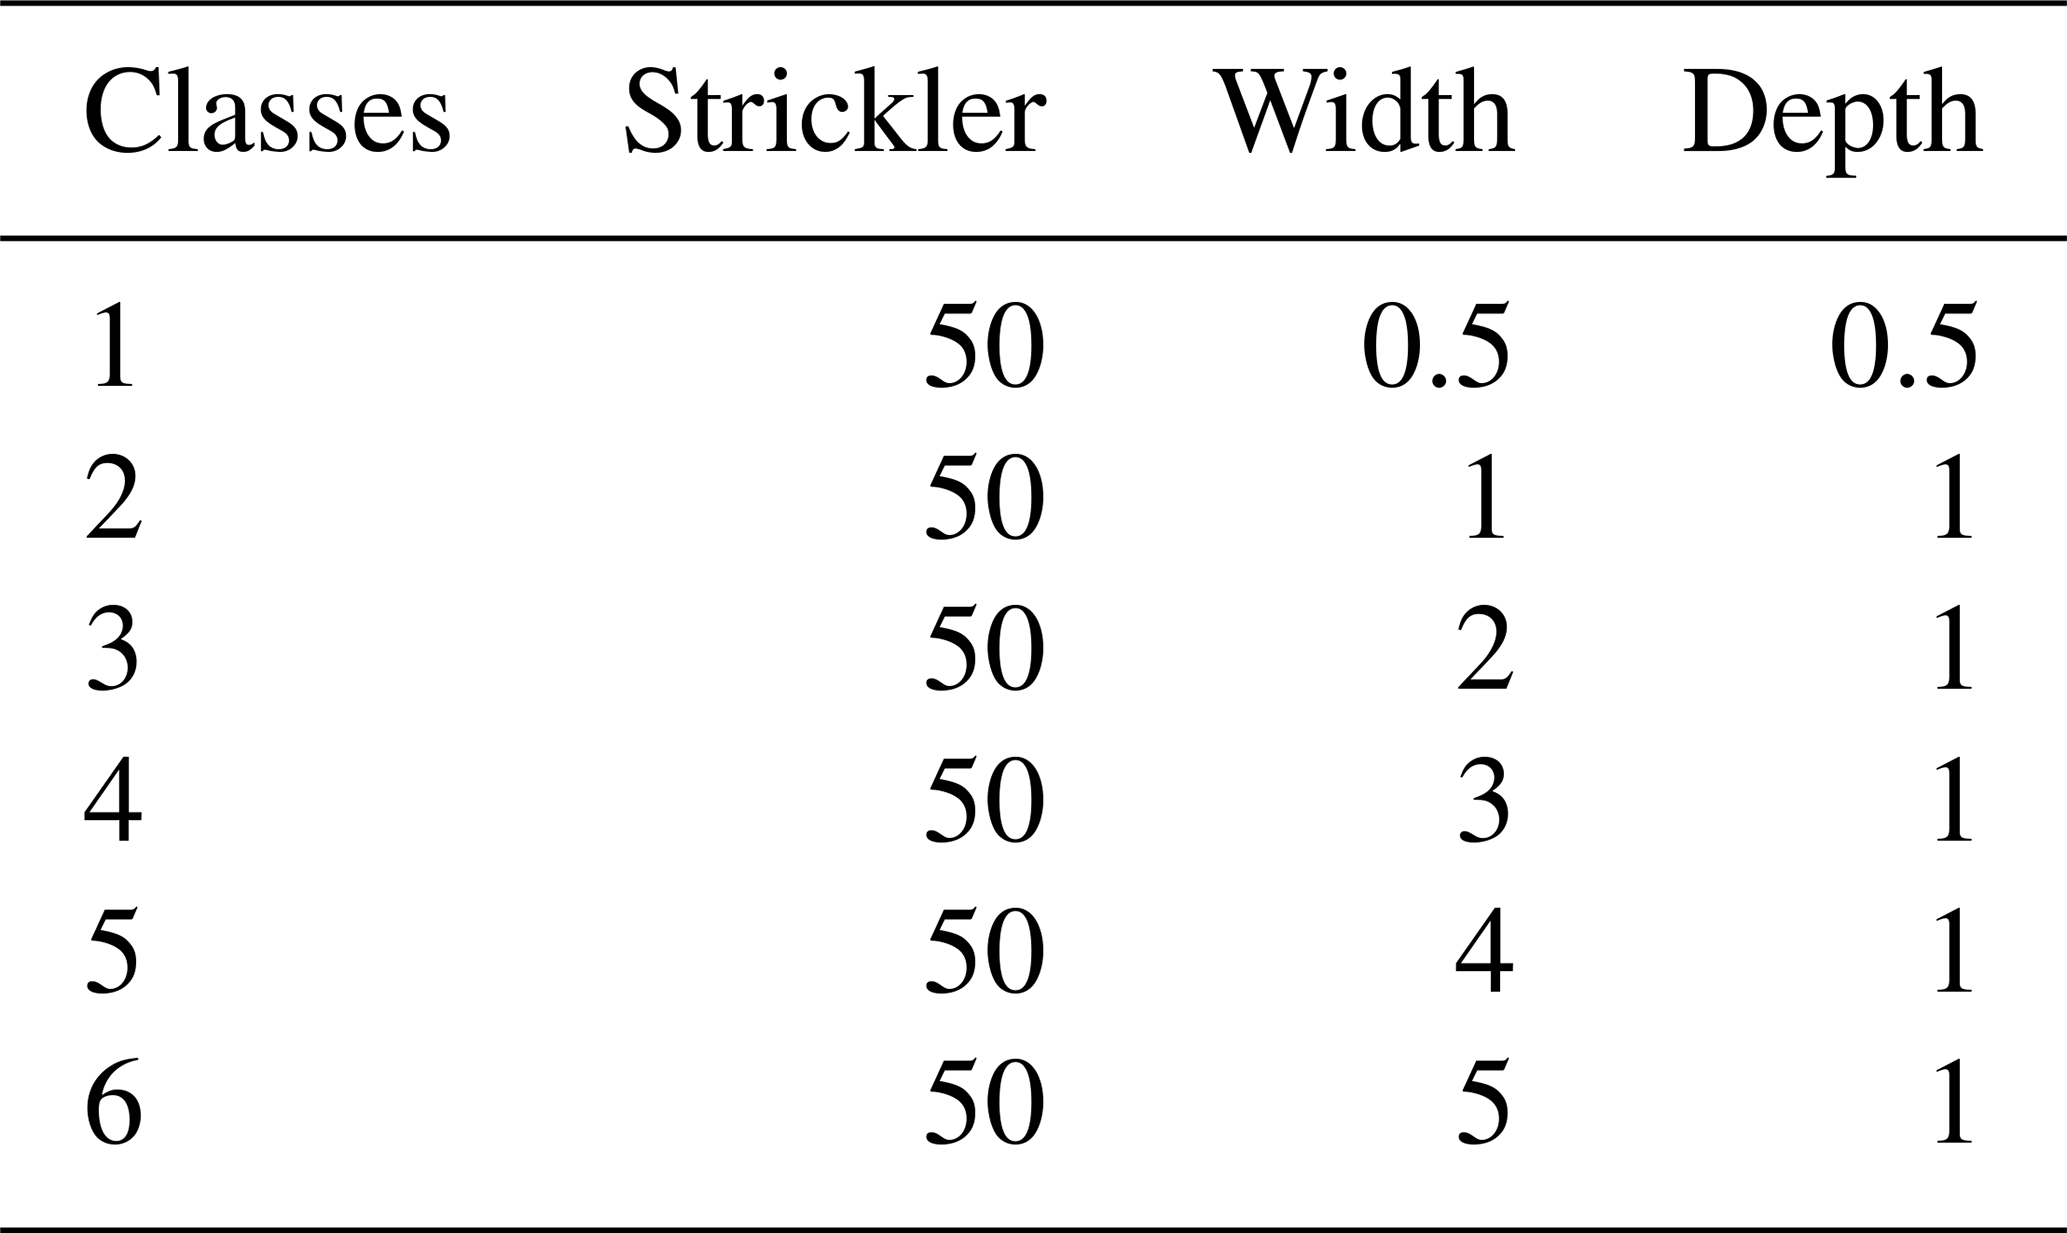
The flow through the collectors is taken into account by the KW hydraulic model by considering the hydraulic properties of the collectors (roughness, width and depth) and the slope of the land. The slopes were smoothed by moving average over 50 meshes downstream of the mesh considered. The roughness Strickler coefficient was set at 50 m s−1 for all the collectors (297). The dimensions of the drains are available in the attribute table of the drains layer and 6 classes (Table 1) of drains were finally considered.
Table 1Constitution of the width and depth classes of storm drains.
The functioning of the reservoirs is regulated by a volume-height-discharge rate law, specific to each reservoir. The absence of information on their storage capacity affects the results of the simulations and could therefore overestimate or underestimate their true operation.
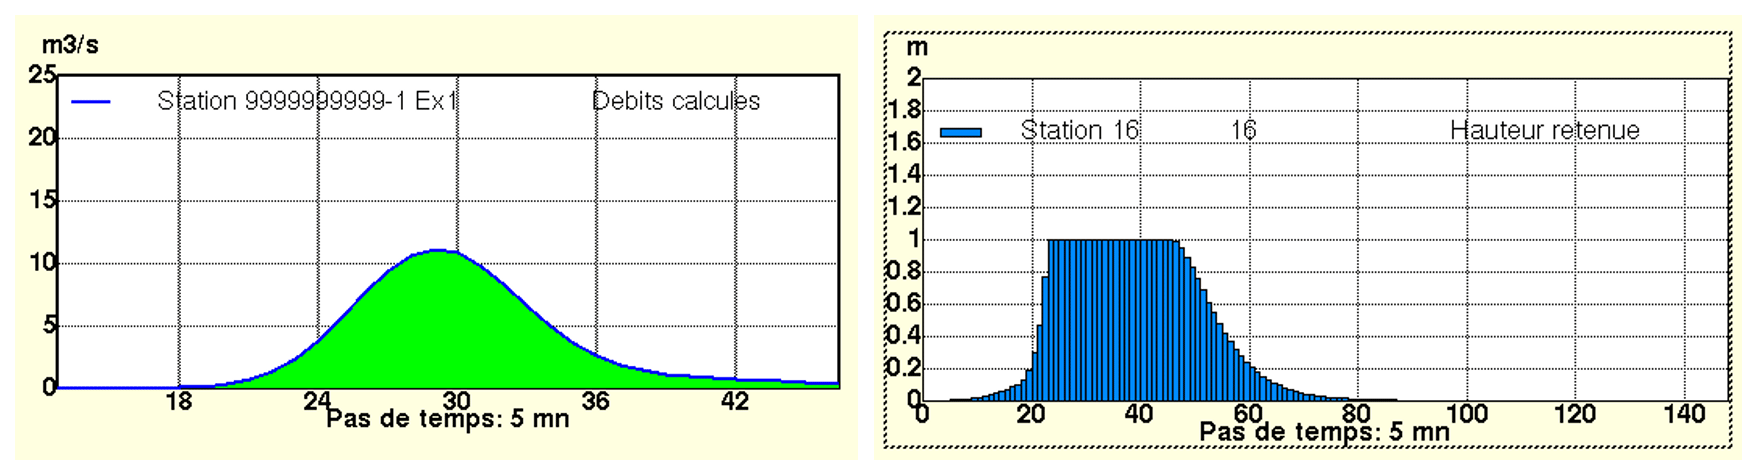
The outputs of the simulations are the hydrographs at the outlet of the elementary basins and the water heights in the reservoirs (Fig. 5), and the mapping of the overflows (Fig. 6).
The overflow points are identified by the difference between the flows simulated by the model and the capacity of the network to evacuate the simulated flows (Fig. 6). This capacity was estimated by applying the Kinematic Wave model at full load. The example in Fig. 6 corresponds to a 100-year design rainfall applied as input to the model. The design rainfall model was built according Desbordes and Raous (1980), combining a total rainfall duration of 4 h and an intense rainfall phase of 1 h, for return periods of 2 to 100 years. The maximum intensities were deduced from the IDF curves produced for Senegal by Sane et al. (2018).
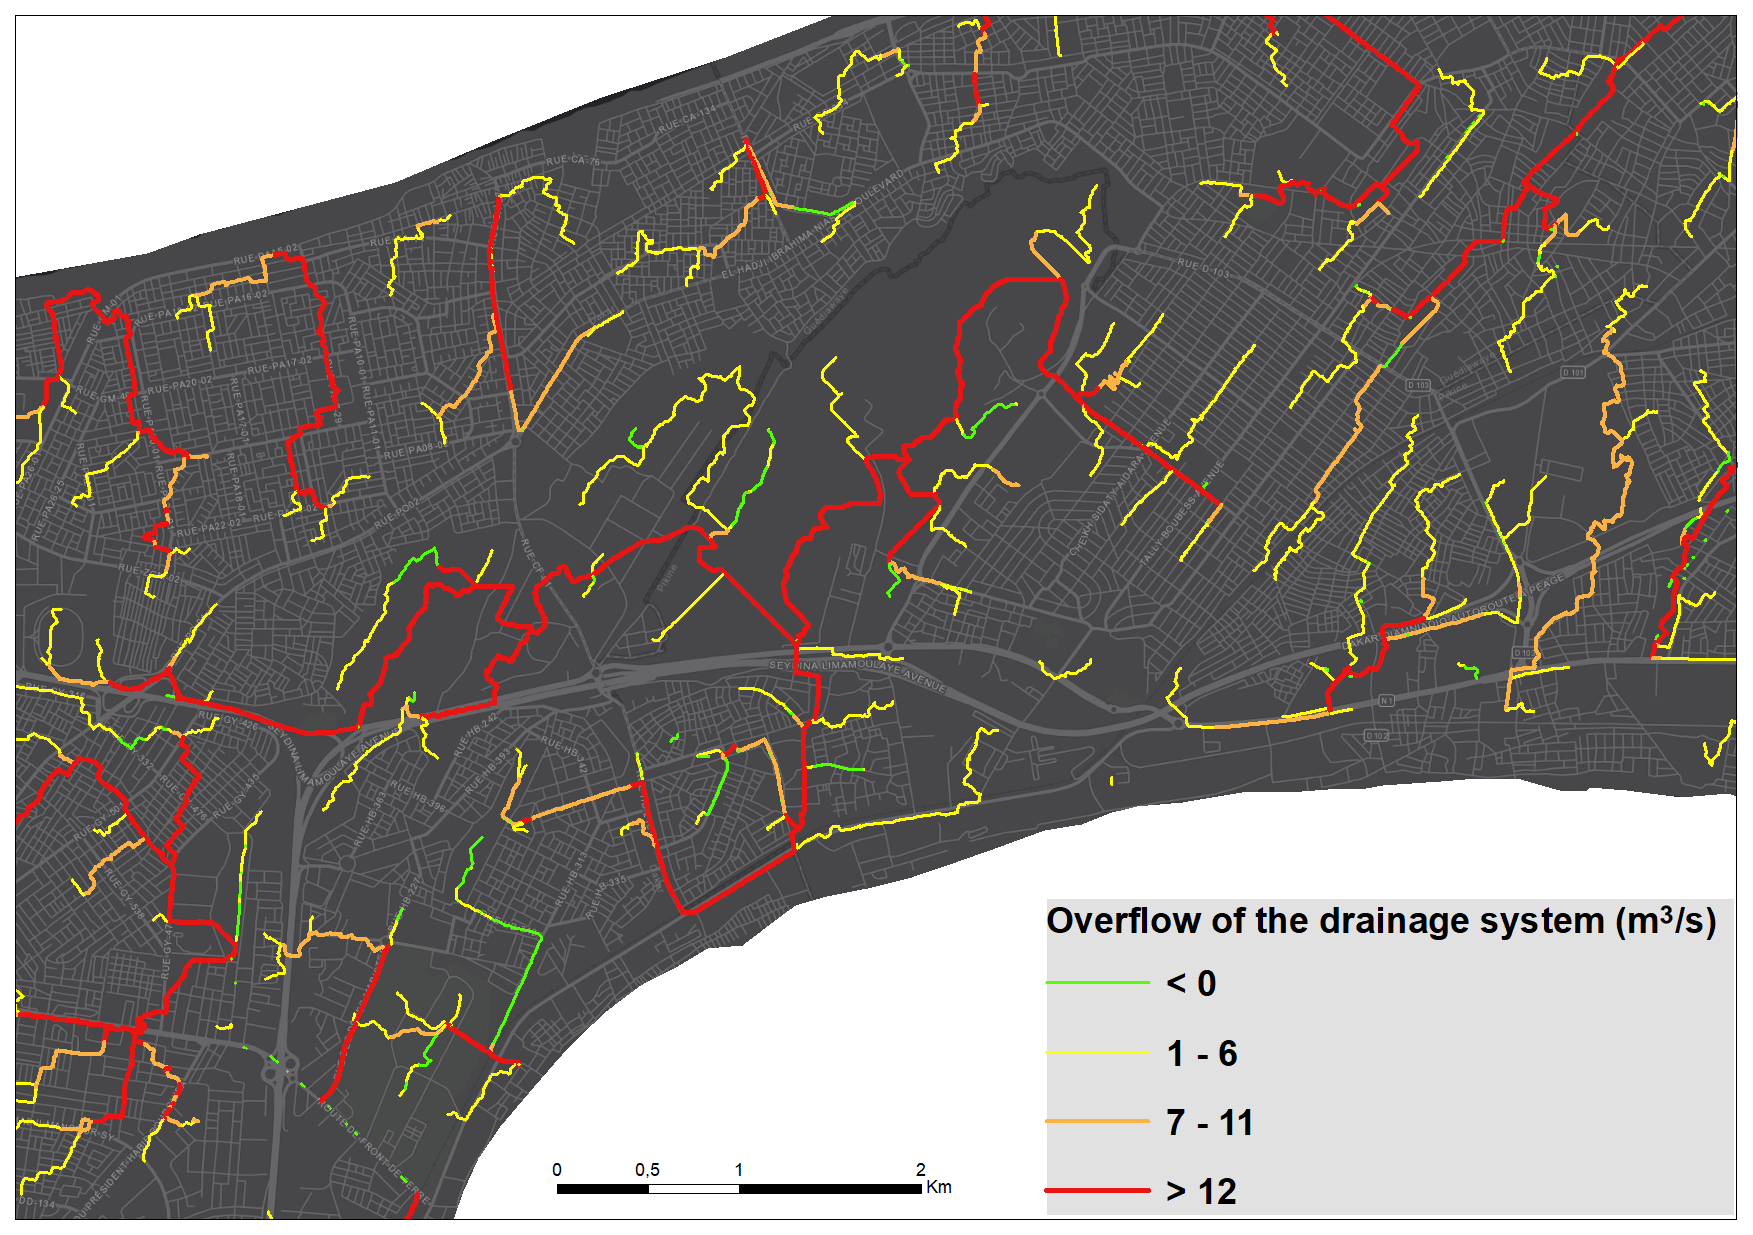
Figure 6Identification of the overflow points of the drains according to different flow rates (m3 s−1).
The method provides maps of the severity of overflows from drainage structures for different rainfall intensities and taking into account local urban conditions. The model has the advantage of covering an entire agglomeration with a fine resolution (5 m), short calculation times (typically 5 min) compatible with real-time forecasting applications of possible overflow risks (monitoring of alert coasts). It is also applicable in project mode to assess the impact of future urban developments and to develop flood risk prevention policies. However, there are some limitations in this work. For the construction of the drainage topology, not all obstacle objects have been taken into account (gullies, walls, road interchanges). The use of a lidar, which is emerging in African cities, would allow to refine the construction of the drainage topology. The implementation of the hydrological production-transfer (SCS-LR) and hydraulic propagation (KW) models applied to this topology can be improved through the equipment of experimental basins to better fix the values of the different parameters to be calibrated, insofar as there are uncertainties on the historical data exploited for this study. Also, the simulations were done without a perfect knowledge of the dimensions (width, depth, …) of all storm drains. This raises the question of the constitution of a quality urban spatial database to help improve the results of the simulations. The validation of the model remains a perspective of this work through feedback (comparing the simulations with recent flood situations).
The method is based on 2 steps, consisting of reconstructing the drainage directions on natural and urban object modified terrain, and then applying hydrological and hydraulic modelling. The method can be applied either for real time forecast or for design mode). It covers the whole agglomeration at a fine spatial scale (5 m), with fast calculation. Its main purpose is to produce simulations of flows and network overflow points that are sufficiently informative in real time or in project mode, to guide the deployment of emergency services in the field, in real time or to diagnose the operation of the network in project mode, or to initiate actions at strategic locations. The representation of the overflow points is associated with a one-dimensional 1D model, and provides the boundary conditions for applying 2D hydraulic models in order to determine locally the impact of the overflow of the structures on limited areas.
The method seems flexible and adaptable to different contexts, and facilitated by the development of open-source global platforms and the possibility of accessing spatial data.
The codes are implemented in the Athys modelling platform which is a free and open source software.
The data used in this article is available from the first author, Laurent Pascal Diémé on the basis of a reasonable request.
LPD has conceived and wrote the paper. CB has implemented the codes on Athys. AS has provided the datas and AB has contributed to the data analysis.
The contact author has declared that none of the authors has any competing interests.
Publisher's note: Copernicus Publications remains neutral with regard to jurisdictional claims in published maps and institutional affiliations.
This article is part of the special issue “IAHS2022 – Hydrological sciences in the Anthropocene: Variability and change across space, time, extremes, and interfaces”. It is a result of the XIth Scientific Assembly of the International Association of Hydrological Sciences (IAHS 2022), Montpellier, France, 29 May–3 June 2022.
The authors are thanking all the data providers.
This paper was edited by Christophe Cudennec and reviewed by Abdoulaye Faty and one anonymous referee.
ANSD: Recensement Général de la Population et de l'Habitat, de l'Agriculture et de l'Élevage (RGPHAE), final report, 418 pp., 2013.
Bassel, M.: Eaux et environnement à Dakar – Pluies, ruissellement, pollution et évacuation des eaux, Contribution à l'étude des problèmes d'environnement liés aux eaux dans la région de Dakar, PhD Thesis, Department of Geography, University Cheikh Anta Diop of Dakar, 1996.
Bruckmann, L., Amanejieu, A., Moffo, M. O. Z., and Ozer, P.: Analyse géohistorique de l'évolution spatio-temporelle du risque d'inondation et de sa gestion dans la zone urbaine de Douala (Cameroun), Physio-Géo, 13, 91–113, https://doi.org/10.4000/physio-geo.8038, 2019.
Chagnaud, G., Panthou, G., Vischel, T., and Lebel, T. A.: synthetic view of rainfall intensification in the West African Sahel, Environ. Res. Lett., 17, 044005, https://doi.org/10.1088/1748-9326/ac4a9c, 2022.
Desbordes M. and Raous P.: Fondement de l'élaboration d'une pluie de projet urbaine: méthode d'analyse et application à la série de Montpellier – Bel-Air, La Météorologie, 6, 317–336, 1980.
Diémé, L. P., Bouvier, C., Bodian, A., and Sidibé, A.: Construction de la topologie de drainage à fine résolution spatiale en milieu urbain: exemple de l'agglomération de Dakar, LHB, 108, 2061313, https://doi.org/10.1080/27678490.2022.2061313, 2022.
Jaglin, S., Didier, S., and Dubresson, A.: Métropolisations en Afrique subsaharienne: au menu ou à la carte?, Métropoles, Hors-série, https://doi.org/10.4000/metropoles.6065, 2018.
Jenson, S. K. and Domingue, J. O.: Extracting topographic structure from digital elevation data for geographic information system analysis, Photogramm. Eng. Rem. S., 54, 1593–1600, 1988.
Landemaine, V.: Érosion des sols et transferts sédimentaires sur les bassins versants de l'Ouest du Bassin de Paris: Analyse, quantification et modélisation à l'échelle pluriannuelle, PhD thesis, University of Rouen-Normandie, 237 pp., 2016.
Lessault, D. and Imbert, C.: Mobilité résidentielle et dynamique récente du peuplement urbain à Dakar (Sénégal), Cybergeo: European Journal of Geography, Espace, Société Territoire, 662, 1–18, https://doi.org/10.4000/cybergeo.26146, 2013.
Panthou, G., Lebel, T., Vischel, T., Quantin, G., Sane, Y., Ba, A., and Diopkane, M.: Rainfall intensification in tropical semi-arid regions: The Sahelian case, Environ. Res. Lett., 13, 064013, https://doi.org/10.1088/1748-9326/aac334, 2018.
Pons, F., Delgado, J. L., Guero, P., and Berthier, E.: ExZeco: A GIS and DEM based method for pre-determination of flood risk related to direct runoff and flash floods, in: 9th International Conference on Hydroinformatics, Tianjin, China, Vol. 25, 2010.
Pons, F., Laroche, C., Fourmigue, P., and Alquier, M.: Cartographie des surfaces inondables extrêmes pour la directive inondation: Cas de la Nartuby, LHB, 2, 34–41, https://doi.org/10.1051/lhb/2014014, 2014.
Pons, F., Alquier, M., Paya, E., Moulin, C., Panier, N., and Chollet, A. E.: Premiers tests de la méthode Cartino2D sur le territoire de Toulon Provence Méditerranée, LHB, 107, 1–13, https://doi.org/10.1080/00186368.2021.1912968, 2021.
Renard, F. and Riquier, J.: Analyse territorialisée du risque de débordements de réseau d'assainissement liés aux eaux pluviales: application au Grand Lyon, Norois – Environnement, aménagement, société, 208, 45–60, https://doi.org/10.4000/norois.2181, 2008.
Sane, Y., Panthou, G., Bodian, A., Vischel, T., Lebel, T., Dacosta, H., Quantin, G., Wilcox, C., Ndiaye, O., Diongue-Niang, A., and Diop Kane, M.: Intensity–duration–frequency (IDF) rainfall curves in Senegal, Nat. Hazards Earth Syst. Sci., 18, 1849–1866, https://doi.org/10.5194/nhess-18-1849-2018, 2018.
Satterthwaite, D.: The impact of urban development on risk in sub-Saharan Africa’s cities with a focus on small and intermediate urban centres, Int. J. Disast. Risk Red., 26, 16–23, https://doi.org/10.1016/j.ijdrr.2017.09.025, 2017.
Williams, D. S., Manez Costa, M., Sutherland, C., Celliers, L., and Scheffran, J.: Vulnerability of informal settlements in the context of rapid urbanization and climate change, Environ. Urban., 31, 157–176, https://doi.org/10.1177/0956247818819694, 2019.