the Creative Commons Attribution 4.0 License.
the Creative Commons Attribution 4.0 License.
 | 16 Nov 2021
Assessment of flood discharge sensitivity to climate indexes in West Africa
Djigbo F. Badou
Aymar Y. Bossa
Yacouba Yira
Julien Adounkpè
Eric A. Alamou
Emmanuel A. Lawin
Luc O. C. Sintondji
Abel A. Afouda
Ernest Amoussou
Floods are natural disasters that widely affect people and goods. Its frequency and magnitude are projected to substantially increase due to the ongoing environmental change. At regional and national levels, some efforts have been made in predicting floods at a short-term range. However, the usefulness of flood prediction increases as the time lead increases. The objective of this work is therefore to investigate flood sensitivity to climate indexes in West Africa as a basis for seasonal flood forecasting. The methodology consists of optimizing the relationship between Annual Maximal Discharge (AMD), a proxy for flood discharge and various climate indexes using correlation coefficient, linear regression and statistical modeling based on 56 river gauging stations across West Africa. The climate indexes considered are the Sea Surface Temperature (SST) of the Tropical Northern Atlantic (TNA), SST of the Tropical Southern Atlantic (TSA), the Sea Level Pressure (SLP) of the Southern Oscillation Indexes (SOI) and the detrended El-Nino Southern Oscillation indexes. It was found that SOI/SLP indexes are the most strongly related to the AMD for the investigated stations with generally high, positive, and statistically significant correlation. The TSA/SST indexes indicated both positive and negative statistically significant correlations with river discharge in the region. The percentage change in AMD per unit change in SOI/SLP for most of the statistically significant stations is within 10 % and 50 % indicating a strong relationship between these two variables. This relationship could serve as a basis for seasonal flood forecasting in the study area.
- Article
(2837 KB) - Full-text XML
- BibTeX
- EndNote


Sea Surface Temperature (SST) plays a remarkable role in spatial and temporal rainfall variability world widely. The teleconnection between different phases of ENSO or El-Nina and rainfall variability over Africa have been found in many studies (Nicholson and Selato, 2000; Nicholson and Kim, 1997). A clear relationship between rainfall and SST has been demonstrated for Eastern Africa (Mutai and Ward, 2000), Sahelian Africa (Dyer et al., 2017; Giannini et al., 2004) and Western Guinean Africa (Balas et al., 2007). Warming in the Indian ocean induces an increase in the Sahelian rainfall while the opposite implies a decrease in the Sahelian rainfall (Dyer et al., 2017). In contrast to the Sahelian region, the relationships between rainfall and SST in West Guinean Africa are not generally symmetric as the same SST pattern may enhance rainfall in one season, but reduce it in the following season (Balas et al., 2007). Factors inducing wet conditions are not necessarily the opposite or the reverse of the one leading dry condition.
Likewise, the links between extreme rainfall in West Africa and the large circulation pattern have received attention. Diatta et al. (2020) show that extreme precipitation in the Sahel and Guinean coast is strongly associated with El Niño 3.4 index (NINO.3.4) and other climate indexes. Extreme rainfall pattern over the Sahel is likely influenced by El Niño-Southern Oscillation (ENSO) and Mediterranean variability (Diakhaté et al., 2019) while extreme precipitation in Ghana is shown to be significantly and positively correlated with the Atlantic Ocean SST and negatively correlated with the Pacific and Indian basin SSTs (Atiah et al., 2020). The teleconnection between rainfall characteristics (including extremes) and climate indexes such as SST and SLP could serve as a basis for seasonal rainfall forecasting in West Africa during the regional climate outlook forum (http://acmad.net/rcc/presao.php, last access: 15 February 2020).
The knowledge of extreme rainfall is a good proxy for flood assessment. However, other flood-related characteristics such as high river discharge, flood magnitude, and flood loss can also be influenced by the global circulation pattern. At a global scale, flooding duration appears to be more sensitive to the ENSO index than for flood frequency (Ward et al., 2016) and ENSO exerts strong and widespread influences on both flood hazard and flood risk (Ward et al., 2014c). While the linkage between flood factors and climate indicators has been extensively investigated in Europe, Asia and America (See a review by Kundzewicz et al., 2019), information on this teleconnection is very limited in Africa and mainly in West Africa. Li et al. (2016) analyzed flood events for 55 countries in Africa relatively to ENSO (SOI) years and found a statistically significant relationship at a continental level. A strong linear correlation between annual discharges and ENSO was found in South Africa (Alemaw and Chaoka, 2006) and the Nile river basin (Siam and Eltahir, 2015). To the best of our knowledge, no study specifically investigated this topic in West Africa. There is therefore a need for filling this gap. The objective of this work is to assess the sensitivity of the annual maximal river flow of West Africa to different climate indexes and explore their use for seasonal flood forecasting.
Data used are the discharge data obtained from the Global Runoff Data Center (GRDC) and some national hydrological services in West Africa. The climate indexes used are the tropical southern Atlantic indexes (TSA; NOAA, 2020), the tropical northern Atlantic indexes (TNA; NOAA, 2020), the El-Nino southern oscillation indexes (ENSO, JISAO, 2011) and the Southern oscillation indexes (SOI; Climatic Research Unit, 2019).
The block maxima approach (BMA) over the calendar year was used for discharge data sampling since high discharge is an excellent proxy for the river flood magnitude. However, to avoid a preponderant missing data effect on the BMA, the period of extraction of the annual maximal discharge was limited to the rainfall season which spans generally from June to mid-November in West Africa. In addition, the boxplot approach was used to identify possible outliers in the extracted data following the approach of Chambers et al. (2018). For any given station, after computing the interquartile range IQR = Q(0.75)−Q(0.25), the lower adjacent value of the boxplot defined as the smallest value greater of equal to is identified. The upper adjacent value of the boxplot is defined as the largest observation lesser than or equal to . Values below the lower adjacent are considered possible outliers due to missing data and are particularly screened.
The sensitivity of the AMD to the climate indexes was first evaluated using the Pearson correlation. For stations indicating significant correlation at 10 % level, a linear relationship between the AMD and a weighted mean of a given climate index for different time steps was established. The ith weighted mean (WMCIi) of four-monthly climate indexes (JFMA for i=1, FMAM for i=2, …, MJJA for i=5) was computed as
where CIi are the monthly climate indexes from January (i=1) to August (. The coefficient αi were obtained by optimizing the absolute correlation between the logarithm of the AMD and WMCIi.
A significant correlation between the logarithm of the Annual maximal discharge of the jth station and the climate indexes (WMCIi) imply that there is a linear relationship between these two variables. Therefore, when both correlation is statistically significant, the associated sensitivity β to the variation of climate indexes is determined following the approach of Ward et al. (2014) such as
with βi,j and αi,j the regression coefficients. A unit change in WMCIi is associated with an average change of in and it can be referred to as “sensitivity” in percentage after Ward et al. (2014a).
3.1 Selected River basins
In addition to the criteria indicated in the methodology, the river gauging stations were further selected based on a minimum data length of 30 years leading to the 56 stations (out of 150 initial stations) spread throughout the region. The study area encompasses many transboundary basins such as the Niger basin, the volta basin, and the complex Ouémé-Mono-Couffo basin. Figure 1 presents the data length equivalent to the number of years of data available. Among these stations, 50 % have a data length between 30 and 45 years, while for 45 to 60 years, it is 32.1 % of the stations. In the same way, 14 % of the stations indicated a data length between 60 and 75 years. For the data with the highest length (between 75 and 92 years), their percentage is about 3.6 % and these stations are in the Niger river.
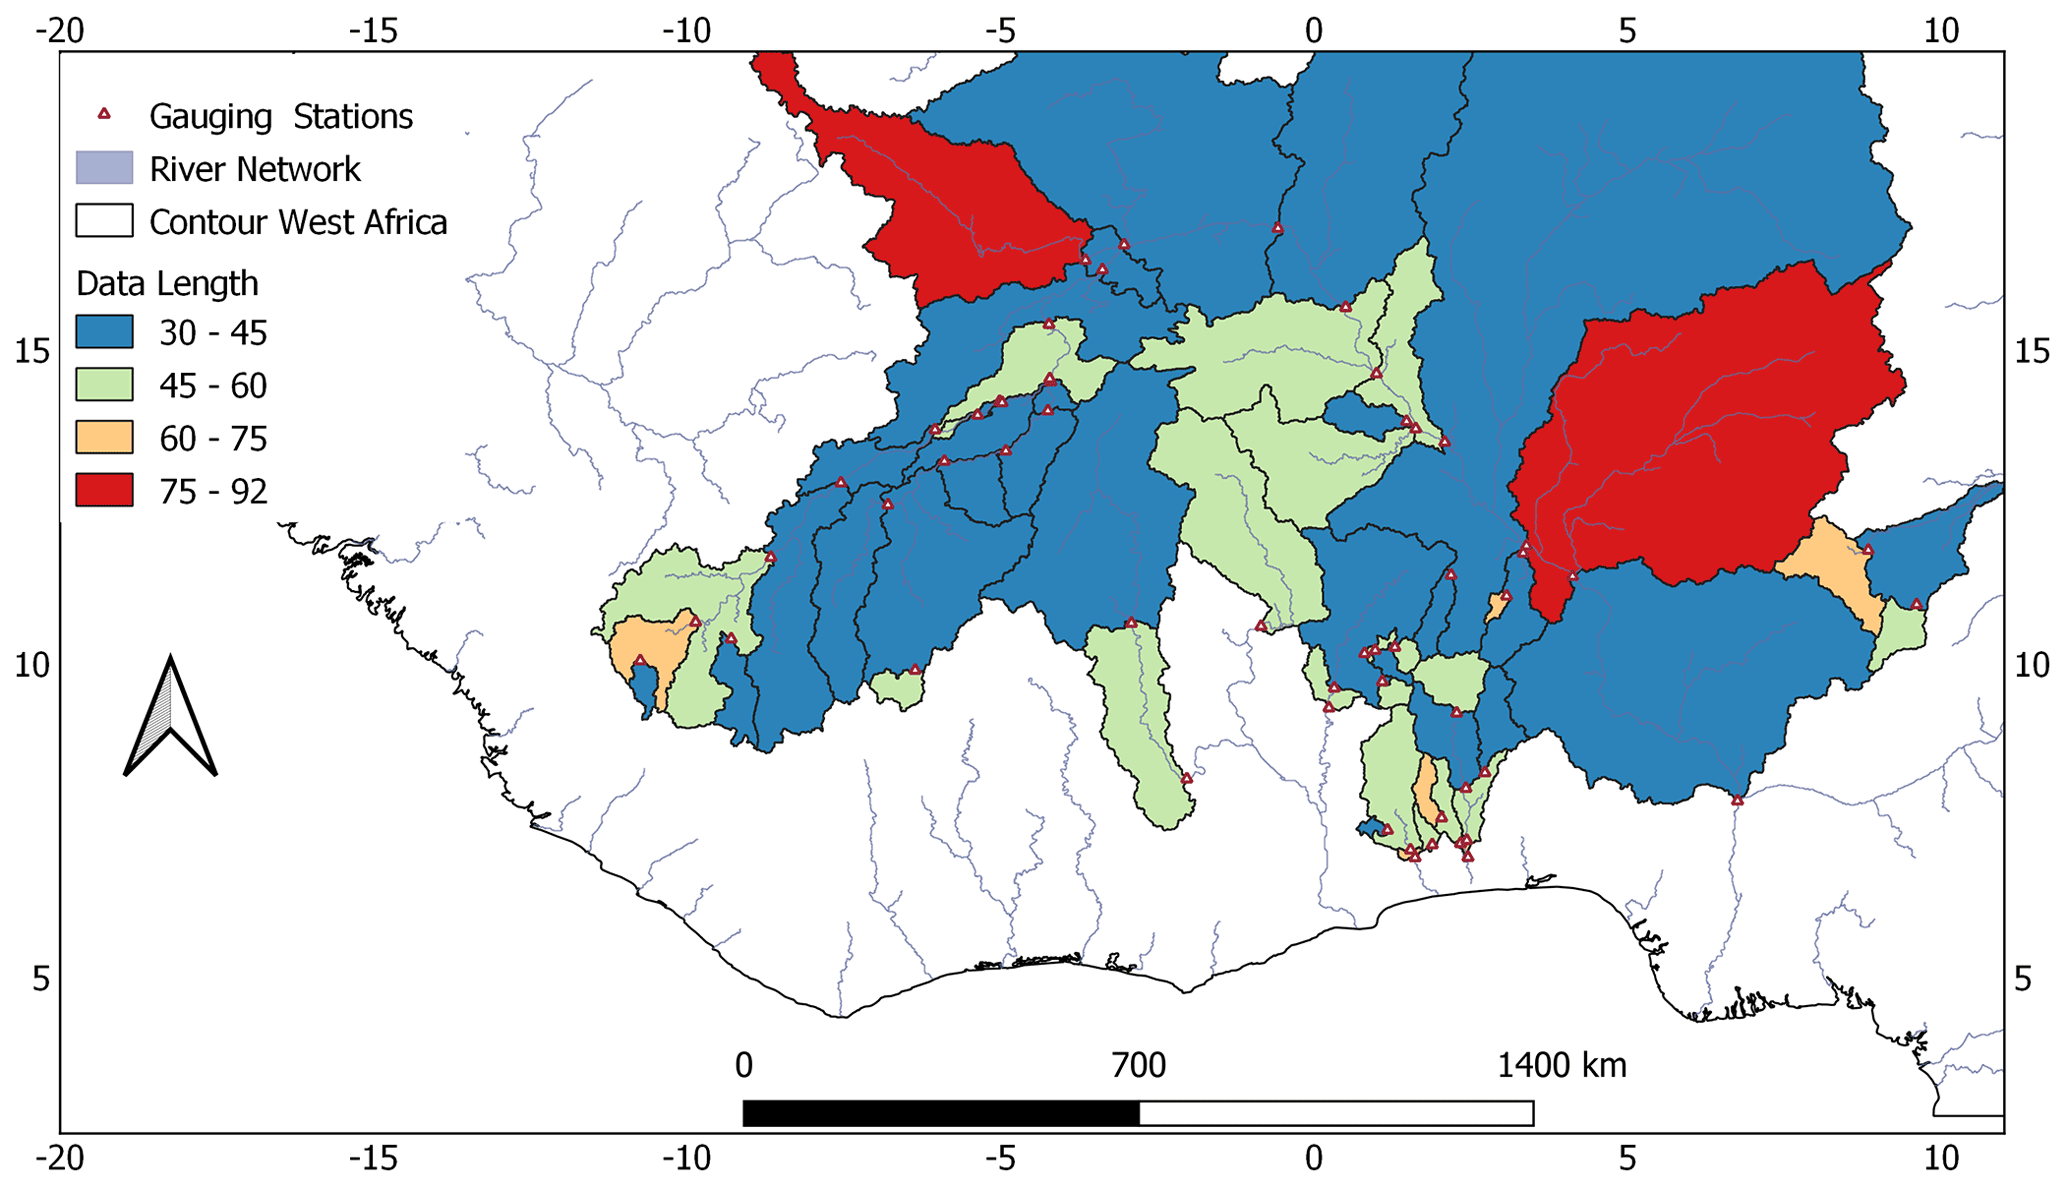
Figure 1Selected West Africa basins, the associated data length, and gauging stations.
3.2 Relationship between annual maximal discharge and climate indexes
Figure 2 displays the correlation coefficient between the annual maximal discharge over the selected basins and the four-monthly weighted mean of four climate indexes (TSA/SST, TNA/SST, SOI/SLP and El-Nino) with information shown for statistically significant correlation. The strength of the relationship with the AMD depends on the climate indexes considered and the associated period. The strongest teleconnection with the river discharge in West Africa was found for the SOI/SLP while the weakest was obtained for TNA/SST indexes.
The sea level pressure of the southern oscillation indexes shows a very high and positive correlation with the AMD in West Africa compared to other climate indexes implying that estimated flood discharge based on these indexes could provide a substantial basis for seasonal flood forecasting. The SST indexes of the TSA indicated a good relationship with river discharge in the region with no general spatial pattern between the positive and negative correlation implying diverging effects. The maximal number of stations indicating a significant correlation with climate indexes are obtained in the period JFMA for TNA/SST (37.5 %), in MAMJ and AMJJ for the detrended El-Nino indexes (44.6 %), in AMJJ for TSA/SST (53.6 %) and, in MAMJ for SOI/SLP (83.9 %). The SOI/SLP outperformed the other climate indexes irrespective of the period considered. Its minimum number of stations indicating significant correlation is greater than the maximum number of significant stations indicated by the other climate indexes.
When considering the climate indexes of the first four months of the year (JFMA), obtaining a significant and relatively high correlation with a given station implies that there are possibilities to estimate AMD of that station several months ahead of flood season which generally is between July and October depending on the station location. The time lead for the forecast would be two and one months for the four-monthly climate indexes of respectively FMAM and MAMJ.
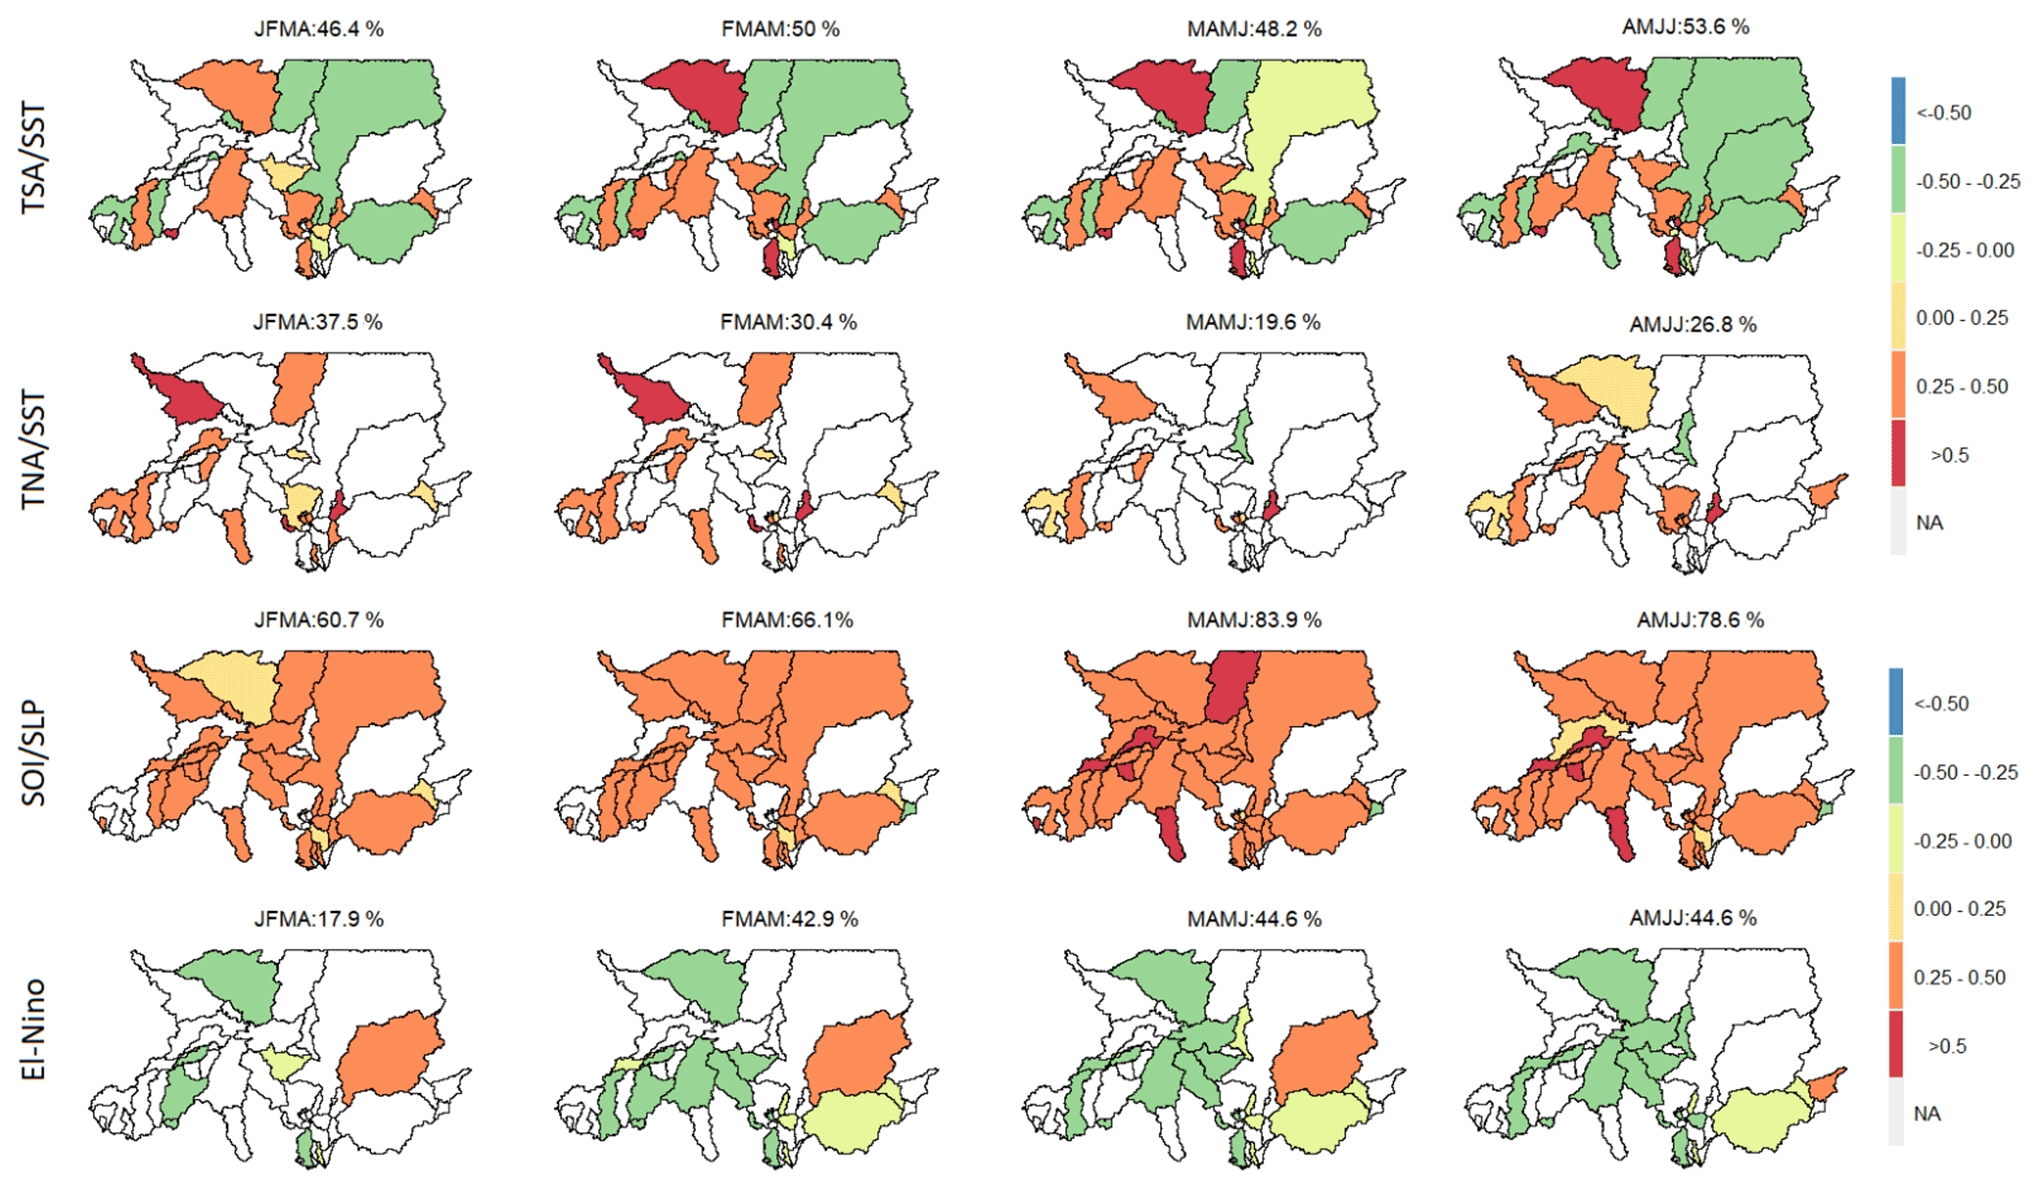
Figure 2Correlation coefficient between the four monthly climate indexes and the logarithm of the annual maximal.
The statistically significant correlation of the SST indexes of the Tropical Southern Atlantic did not show any clear direction about the sign of the correlation in contrast to the TNA/SST and SOI/SLP which generally are positively correlated with the AMD. The El-Nino indexes indicated a mostly negative correlation with the AMD. The positive correlation implies that AMD increases with an increase in the climate indexes while the negative correlation implies that a decrease in AMD is associated with an increase in climate indexes. A combination of many climate indexes would help to improve the obtained correlation. Generally, all the AMDs are statistically correlated with at least one climate index.
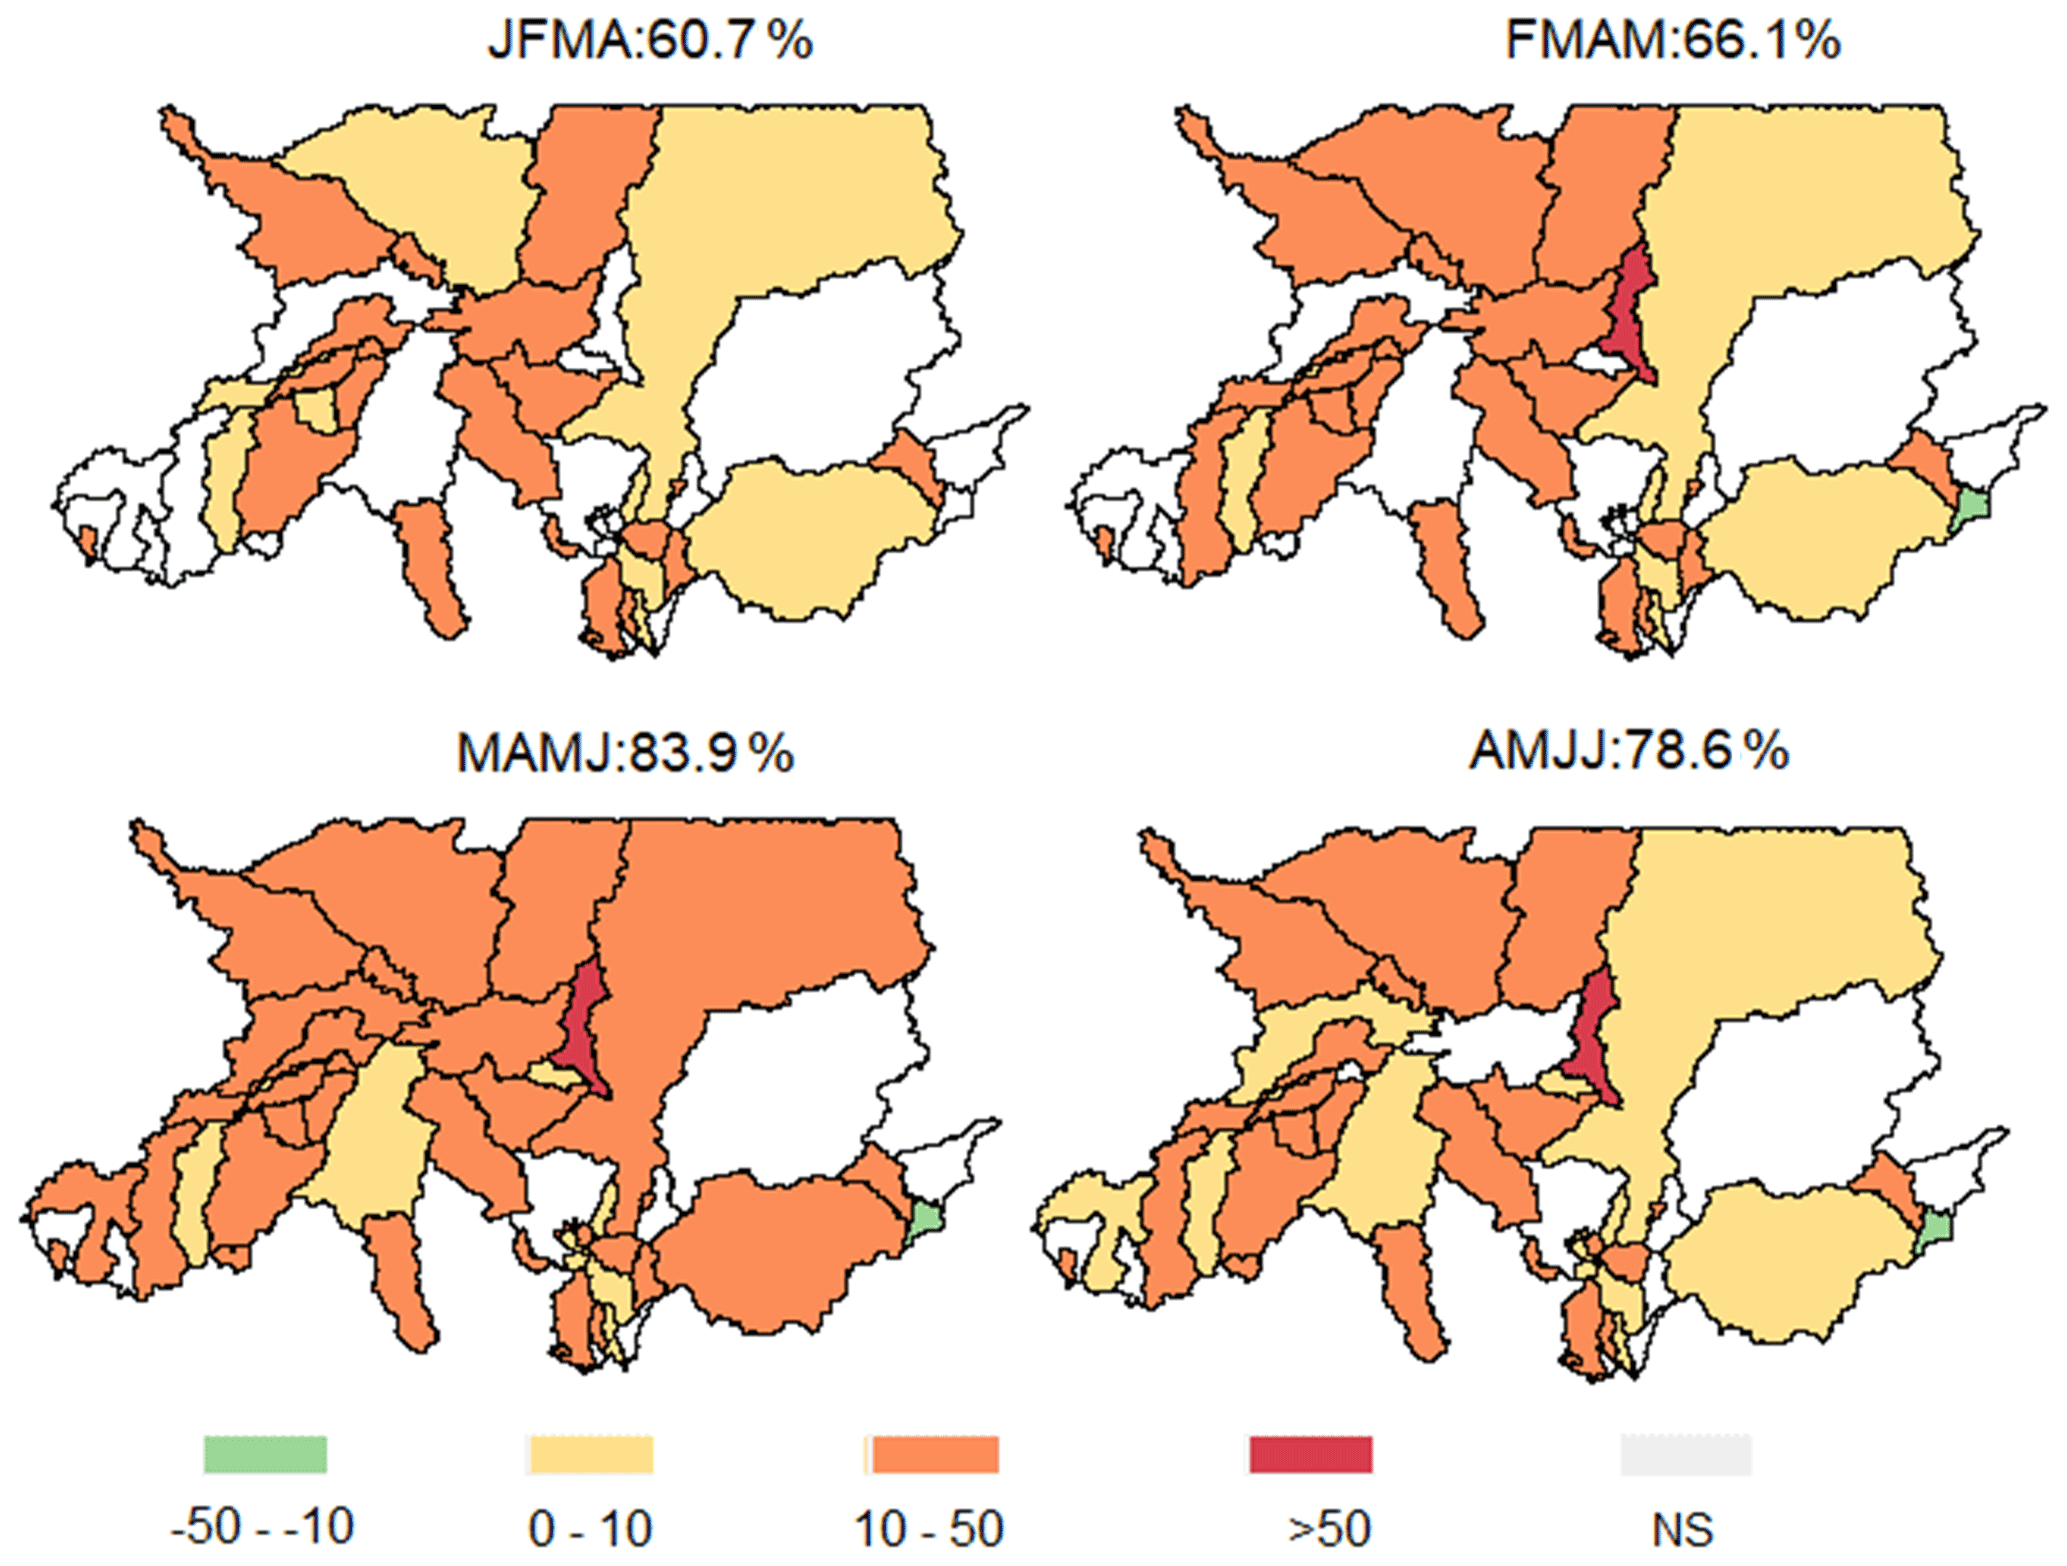
Figure 3Percentage change of annual maximal discharge per unit change SOI/SLP for stations with significant correlation at 10 %.
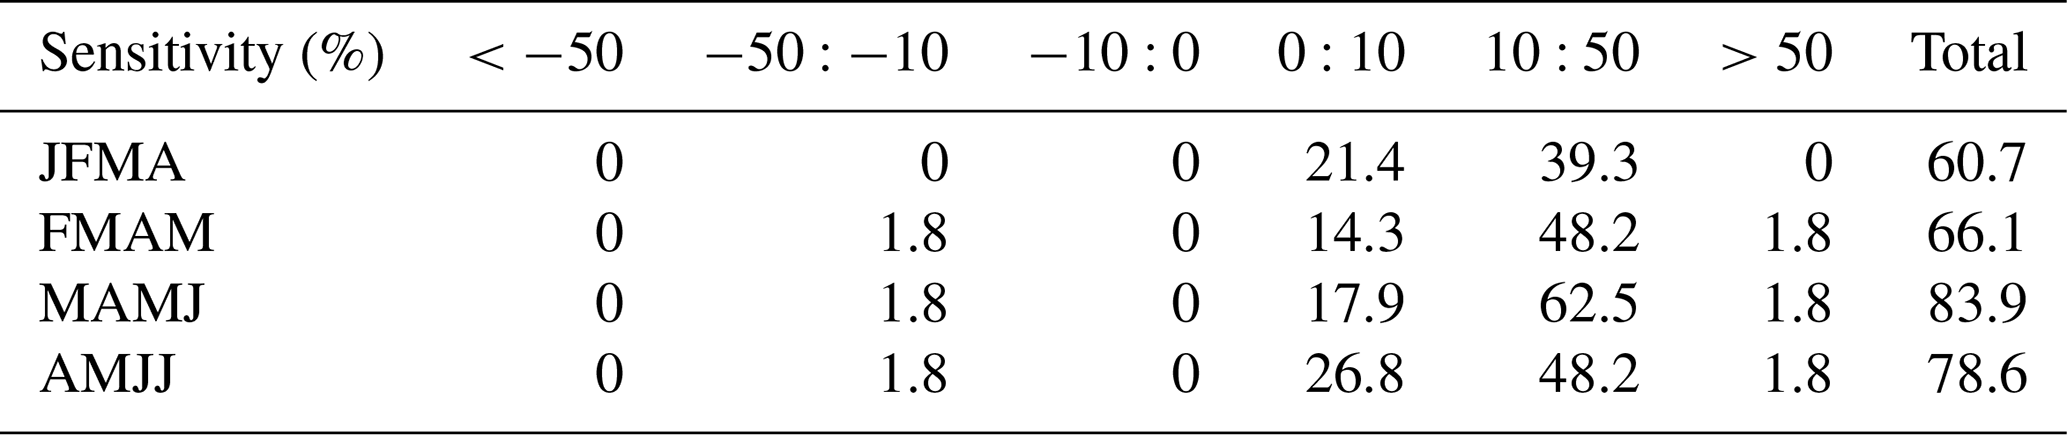
Table 1Percentage of stations with the associated sensitivity level computed using the SOI/SLP (See Fig. 3).
3.3 Flood discharge sensitivity
Figure 3 presents the percentage change in annual maximal discharge per unit change in climate indexes. The flood discharge sensitivity varies substantially across basins and this sensitivity increases as the SOI period gets closer to the flood period. Generally, in the basins with significant correlation, AMD varies mostly between 10 % and 50 % per unit change in SOI/SLP implying a positive relationship. This positive relationship is consistent with the findings of Ward et al. (2014a) for the West Africa region. The highest sensitivities are spread throughout the region with an emphasis on the high latitude. The strength of the teleconnection between the SOI/SLP and AMD varies depending on the period considered for the SOI/SLP. For instance, the highest percentage (in term of the number of stations) for the sensitivity between 10 % and 50 % is 62.5 (Table 1) obtained while considering the SOI/SLP for March to June which correspond to the first rainy season in the West Africa Guinean Coast.
For the SOI of January to April, 39.3 % of the stations exhibited a sensitivity between 10 % and 50 % implying that substantial variation in the AMDs in the region could be explained ahead using the SOI of January to April. This opens the door for exploring seasonal annual maximal discharge forecasting, a strong proxy for seasonal flood forecasting. This kind of relationship has been established between rainfall amount in the Sahel and the SST anomaly in the Equatorial Atlantic upwelling, and the position of the Saint-Helena high-pressure center (Mahe and Citeau, 1993). Strong connections between precipitations in West Africa and the oceanic zones of the Atlantic frontage of Africa located on the course of the African monsoon were found by (Hamatan et al., 2004) and this relationship helps improve substantially the scores of the seasonal rainfall forecast in the region. However, estimating the discharge based on the climate indexes through a direct relationship is beyond the scope of this work.
This study evaluated the relationship between the annual maximal discharge (AMD) and four climate indexes using statistical methods. The results indicated a strong relationship between AMD and the climate indexes. The Sea Level Pressure (SLP) of the Southern Oscillation indexes (SOI) is the most correlated and statistically significant (10 % level) with flood discharges in the region irrespective of the period considered. Most of the sensitivity indexes meaning the change in AMD per unit change in climate indexes are within 10 % and 50 % confirming the strong relationship previously found. The established strong relation between climate indexes and AMD could serve as a basis for exploring the seasonal annual maximal discharge forecasting, a strong proxy for seasonal flood forecasting. A promising research path would be to use the potential predictability of climate indexes such as SOI to provide probabilistic estimates of flood hazard with lead times up to several months (Ward et al., 2014a, b).
The discharge data is not publicly available due to research institution policy. The climate indexes used such as the tropical southern Atlantic indexes (https://psl.noaa.gov/data/correlation/tna.data, last access: 15 February 2020, NOAA, 2020), the tropical northern Atlantic indexes (https://psl.noaa.gov/data/correlation/tsa.data, last access: 15 February 2020, NOAA, 2020), the El-Nino southern oscillation indexes (http://research.jisao.washington.edu/data_sets/globalsstenso/, last access: 15 February 2020, JISAO, 2011) and the Southern oscillation indexes (SOI, https://crudata.uea.ac.uk/cru/data/soi/, last access: 15 February 2020, Climatic Research Unit, 2019) were freely downloaded from the indicated links.
The contribution of JH to the work consists in the collection and processing of hydrological data and climate indexes, design of graphic materials, presentation and discussion of the results. The contribution of DFB, AYB, YY and EAL is the formulation of the problem, preparation of the manuscript, analysis of literature sources and discussion of the results. JA, EAA, LOCS, AAA, EA reviewed the manuscript and reinforced its different sections.
The contact author has declared that neither they nor their co-authors have any competing interests.
Publisher’s note: Copernicus Publications remains neutral with regard to jurisdictional claims in published maps and institutional affiliations.
This article is part of the special issue “Hydrology of Large River Basins of Africa”. It is a result of the 4th International Conference on the “Hydrology of the Great Rivers of Africa”, Cotonou, Benin, 13–20 November 2021.
This research has been supported by the Bundesministerium für Bildung und Forschung. This research was supported by DAAD within the framework of the climapAfrica programme with funds of the Federal Ministry of Education and Research. The publisher is fully responsible for the content.
Alemaw, B. F. and Chaoka, T. R.: The 1950-1998 warm ENSO events and regional implications to river flow variability in Southern Africa, Water SA, 32, 459–464, 2006.
Atiah, W. A., Mengistu Tsidu, G., Amekudzi, L. K., and Yorke, C.: Trends and interannual variability of extreme rainfall indices over Ghana, West Africa, Theor. Appl. Climatol., 140, 1393–1407, https://doi.org/10.1007/s00704-020-03114-6, 2020.
Balas, N., Nicholson, S. E., and Klotter, D.: The relationship of rainfall variability in West Central Africa to sea-surface temperature fluctuation, Int. J. Climatol., 27, 1335–1349, https://doi.org/10.1002/joc, 2007.
Chambers, J. M., Cleveland, W. S., Kleiner, B., and A., T. P.: Graphical Methods for Data Analysis, Taylor & Francis Group., 2018.
Climatic Research Unit: Southern Oscillation Index (SOI), Data [online] Available from: https://crudata.uea.ac.uk/cru/data/soi/ (last access: 15 February 2020), 2019.
Diakhaté, M., Rodríguez-Fonseca, B., Gómara, I., Mohino, E., Dieng, A. L., and Gaye, A. T.: Oceanic forcing on interannual variability of Sahel heavy and moderate daily rainfall, J. Hydrometeorol., 20, 397–410, https://doi.org/10.1175/JHM-D-18-0035.1, 2019.
Diatta, S., Diedhiou, C. W., Dione, D. M., and Sambou, S.: Spatial variation and trend of extreme precipitation in west africa and teleconnections with remote indices, Atmosphere (Basel)., 11, 999, https://doi.org/10.3390/atmos11090999, 2020.
Dyer, E. L. E., Jones, D. B. A., Li, R., Sawaoka, H., and Mudryk, L.: Sahel precipitation and regional teleconnections with the Indian Ocean, J. Geophys. Res., 122, 5654–5676, https://doi.org/10.1002/2016JD026014, 2017.
Giannini, A., Saravanan, R., and Chang, P.: Oceanic Forcing of Sahel Rainfall on Interannual to Interdecadal Time Scales, Science, 19, 113–128, https://doi.org/10.1016/S1364-8152(03)00114-2, 2004.
Hamatan, M., Mahe, G., Paturel, J. E., and Amani, A.: Synthèse et évaluation des prévisions saisonnières en Afrique de l'Ouest, Sécheresse, 15, 279–286, 2004.
JISAO: Global-SST ENSO index, available at: http://research.jisao.washington.edu/data_sets/globalsstenso/ (last access: 15 February 2020), 2011.
Kundzewicz, Z. W., Szwed, M., and Pińskwar, I.: Climate variability and floods-A global review, Water (Switzerland), 11, 1399, https://doi.org/10.3390/w11071399, 2019.
Li, C., Chai, Y., and Yang, L.: Spatio-temporal distribution of flood disasters and analysis of influencing factors in Africa, Nat. Hazards, 82, 721–731, https://doi.org/10.1007/s11069-016-2181-8, 2016.
Mahe, G. and Citeau, J.: Interactions between the Ocean, Atmosphere and Continent in Africa, Related to the Atlantic Monsoon Flow: General Pattern and the 1984 Case Study, Veill. Clim. Satellitaire, 44, 34–54, 1993.
Mutai, C. C. and Ward, M. N.: East African rainfall and the tropical circulation/convection on intraseasonal to interannual timescales, J. Climate, 13, 3915–3939, https://doi.org/10.1175/1520-0442(2000)013<3915:EARATT>2.0.CO;2, 2000.
Nicholson, S. and Selato, J.: The influence of La Nina on the rainfall of the Western Pacific, Int. J. Climatol., 20, 1761–1776, 2000.
Nicholson, S. E. and Kim, J.: The relationship of the El Nino–southern oscillation to african rainfall, Int. J. Climatol., 17, 117–135, 1997.
NOAA: Linear Correlations in Atmospheric Seasonal/Monthly Averages, [online] available from: https://psl.noaa.gov/data/correlation/tna.data, https://psl.noaa.gov/data/correlation/tsa.data, last access: 15 February 2020.
Siam, M. S. and Eltahir, E. A. B.: Explaining and forecasting interannual variability in the flow of the Nile River, Hydrol. Earth Syst. Sci., 19, 1181–1192, https://doi.org/10.5194/hess-19-1181-2015, 2015.
Ward, P. J., Eisner, S., Flörke, M., Dettinger, M. D., and Kummu, M.: Annual flood sensitivities to El Niño–Southern Oscillation at the global scale, Hydrol. Earth Syst. Sci., 18, 47–66, https://doi.org/10.5194/hess-18-47-2014, 2014a.
Ward, P. J., Pelt, S. C. Van, Keizer, O. De, Aerts, J. C. J. H., Beersma, J. J., and Hurk, B. J. J. M. Van Den: Including climate change projections in probabilistic flood risk assessment, J. Flood Risk Manage., 7, 141–151, https://doi.org/10.1111/jfr3.12029, 2014b.
Ward, P. J., Jongman, B., Kummu, M., Dettinger, M. D., Weiland, F. C. S., and Winsemius, H. C.: Strong influence of El Niño Southern Oscillation on flood risk around the world, P. Natl. Acad. Sci. USA, 111, 15659–15664, https://doi.org/10.1073/pnas.1409822111, 2014c.
Ward, P. J., Kummu, M., and Lall, U.: Flood frequencies and durations and their response to El Niño Southern Oscillation: Global analysis, J. Hydrol., 539, 358–378, https://doi.org/10.1016/j.jhydrol.2016.05.045, 2016.