the Creative Commons Attribution 4.0 License.
the Creative Commons Attribution 4.0 License.
 | 16 Sep 2020
Long-term persistence in discharge time series of mountainous catchments in the Elbe River basin
Thomas Recknagel
Statistical detection of trends in hydrometeorological time series is a crucial task when revealing how river systems react to environmental and human-induced changes. It was shown that the autocorrelation structure of a series influences the power of parametric and nonparametric trend tests. While the order of short-memory processes can be sufficiently captured by AR(I)MA models, the determination of the Hurst exponent, which describes the long memory, is still challenging, considering that the available methods partially give different results. In the Elbe River basin, Europe, several studies focusing on the detection (or description) of long-term persistence were performed. However, different lengths of series and different methods were used. The aim of the present work is to gather the results gained in various parts of the Elbe basin in Central Europe and to compare them with our estimation of the Hurst exponent using six discharge series observed in selected subbasins. Instead of the dependence of the exponent on the catchment area suggested by the theory of aggregated short-memory processes, we rather found a relationship between this parameter and the series length. As the theory is not supported by our findings, we suppose that the Hurst phenomenon is caused by a complex interplay of low-frequency climate variability and catchment processes. Experiments based on distributed water balance models should be the further research objective, ideally under the umbrella of mutual international projects.
- Article
(8577 KB) - Full-text XML
- BibTeX
- EndNote


The question of the existence and cause for trends in hydrometeorological (HM) time series has already been posed since the 19th century (e.g. v. Berg, 1867). In the course of the 20th century, predominantly nonparametric trend tests have been employed to analyze HM series. Theoretical works have shown (often through Monte Carlo experiments; e.g. Yue et al., 2002a) that these classical tests, although powerful in many cases (e.g. Yue et al., 2002b), are in fact sensitive to the violation of the assumption of independence in time series. Because HM series, as well as many other geophysical series, often reveal autocorrelation which is incompatible with that assumption, many modifications of trend tests came into being. This especially applies to the assumption of short-term persistence (STP) in HM time series that can be addressed by AR(I)MA models (or their variants) before utilizing trend tests themselves. However, building on others, Hamed (2008) showed that also long-term persistence (LTP) can adversely affect trend analyses through influencing the variance of test statistics.
Bearing the afore-mentioned facts in mind, we focus here specifically on the Elbe River basin located in Europe for which the decision on the presence of LTP in various HM series is very important for predicting the future development of discharge response to climate change, especially in connection with better estimating the uncertainty limits, which should be beneficial for future activities related to the Elbe and its tributaries, such as river navigation, water supply, hydropower production, irrigation, and so on. As there has been neither a closing result about the causes of LTP in HM series nor a single superior approach to the estimation of its parameter H, we offer a concise overview of the state of the discussion and put our own results into the context outlined by the outcomes of previous studies.
The Hurst phenomenon (along with LTP) is well known among today's hydrologists. Therefore, we only stress some important points and possible misconceptions. An overview of the history of investigating LTP can be found in Beran (1994), Graves et al. (2017) or Montanari (2003). Hurst analysed the rescaled range R (see Sect. 3.1) as a measure of reservoir capacity and found that for many runoff series Eq. (1) applies:
with standard deviation S, sample size Nand the parameter H taking a mean value of 0.73 which differs clearly from the theoretical value 0.5 (Montanari, 2003). This is equivalent to the fact that the series autocorrelation function does not decay exponentially, but follows a power law and diverges. A large part of the amazement, these findings have caused, originates from the assumptions that runoff can be characterized by a stationary process for which H about 0.5 is expected. Mandelbrot and Van Ness (1968) and Mandelbrot and Wallis (1968) proposed a statistical model based on stationarity that should account for LTP: the fractional Brownian motion (fBm) model, which brought two other terms: infinity and self-similarity. Unwittingly, this model maybe pushed the search for the comprehension of the Hurst effect towards an unfavourable direction. The Gaussian distributed random process underlying runoff was already questioned by Louis M. Laushely in the discussion part of Hurst's seminal paper (Hurst, 1951). Even Hurst himself mentioned shifting mean as a possible reason for the phenomenon (Montanari, 2003). Eventually, Mandelbrot and Wallis (1968) stated that models underestimate the complexity of hydrological fluctuations and considered fluctuations on all timescales: macrometeorological, anthropological, climatological and paleoclimatological (Mandelbrot and Wallis, 1969). The fBm model was therefore never supposed to provide an explanation for LTP discovered in runoff series, but rather to be a tool able to simulate these series in a satisfactory manner. Although Mandelbrot and Wallis (1969) explained how the term “infinity” should be understood, a number of hydrologists refused to use the fBm approach together with its spooky “infinite memory” and considered LTP a mysterious intrinsic property of runoff series whose stochastic behaviour should be distinguished from deterministic trends (e.g. Kantelhardt et al., 2001). The concept was already questioned early by others. For example, Klemeš (1974) wondered “by what sort of physical mechanism” a measured value should be dependent on all previous values. Later, the operational school drew a lot of criticism. Klemeš (1978) stated that it failed “to see that the statistical and stochastic properties of hydrologic processes have definite physical causes”. Mesa and Poveda (1993) wrote that “the so-called Hurst effect and other related anomalities are probably the result of a mixture of scales more than infinite memory. Knowledge of those scales is a more fundamental issue from a physical viewpoint”. Beran (1994) demanded models “that can be explained by the physical mechanism that generates the data”. One example of such a model is the concept of storage cascade mechanisms, which was proposed by Klemeš (1974), and in which Mudelsee (2007) saw the explanation for the Hurst phenomenon. However, Klemeš (1974) also postulated that LTP observed in hydrological series is caused by a complex interplay of different processes on different scales. This postulate, as Montanari (2003) stated, can nowadays have a broad acceptation within the hydrological community.
There are different approaches to quantify the strength of LTP through the parameter H called the Hurst exponent (or coefficient). In the following section, we briefly describe the two methods that have been applied in the Elbe River basin and also in our case study.
We used (1) rescaled range (R∕S) analysis which is based on the works of Hurst (1951) and Mandelbrot and Wallis (1969), and (2) detrended fluctuation analysis (DFA) which was proposed by Peng et al. (1994). With regard to validity and performance, Willems and Min (2016) compared functions of the programming language R which have implemented R∕S or DFA. Inspired by the review, we used the package “pracma” (Borchers, 2019) for R∕S and the package “nonlinearTseries” (Garcia, 2020) for DFA.
3.1 Rescaled range analysis
The adjusted range (R) is defined as the difference between the most positive and the most negative departures from the mean cumulated (discharge) curve, which is normalized by the sample standard deviation (S) to get the rescaled adjusted range statistic R∕S(n). The procedure can be formalized as in Eq. (2):
where Xk is a sequence of random variables and Yn the nth partial sum . The parameter H can then be estimated by the slope of a double logarithmic plot of R∕S(n) against n∕2 (for details see e.g. Graves et al., 2017).
3.2 Detrended fluctuation analysis
The idea behind DFA is to remove trends prior estimating the scaling behaviour. It is also based on the sequence of partial sums Yn which is divided into segments of equal length s. For each segment, a polynomial regression model is fitted to the part of the time series and subtracted from it. Subsequently, the variance σ is calculated for each segment. The fluctuation function is the square root of the average variance subject to the segment width: . Similar to R∕S analysis, H can be estimated by the slope of a double logarithmic plot of F(s) against s.
Mudelsee (2007) fitted an ARFIMA(1, d, 0) model to the data of six water-gauging stations in the Elbe basin and analyzed if there was a correlation between catchment area and LTP. Although Mudelsee (2007) pointed out that, using a permutation test, a positive relationship was found also in the case of the Elbe basin, looking at the figures presented in that paper, one could argue that such a finding might be questionable.
Marković and Koch (2005) analyzed LTP in monthly high flows at the gauge Dresden (Elbe) and compared six different estimation methods which were applied to the raw data and to four time series derived by various filtering techniques. The comparison of methods, such as R∕S analysis or the level of zero crossings approach, resulted in a wide range of H estimates.
Kantelhardt et al. (2006) analyzed daily runoff series of the gauge Dresden, covering the period 1852–2002. Through DFA, they found that H= 0.80.
Markovic and Koch (2014) determined H from discharge records of the gauges Neu Darchau (on the Elbe) and Niederstriegis (Mulde). Analyzing raw data, they found that for Neu Darchau H= 0.80 and for Niederstriegis H= 0.63. After filtering the series (i.e. subtracting annual and low-frequency components), they observed considerable decreases of H. They concluded that LTP in discharge was caused by seasonal and decadal variability.
Regarding the Czech part of the Elbe basin, mainly Ledvinka (2014, 2015a, b) carried out several calculations that incorporated also a number of water-gauging stations relevant to this study. Three series of mean daily discharge from the Ore Mts. (i.e. one of the headwater areas of the Elbe basin) were subjected to wavelet and R∕S analyses, and to the aggregated variance method. Also, maximum likelihood estimation of the fractional differencing parameter for ARFIMA models was conducted. Unexpectedly, quite high values of H were detected. Furthermore, it was found that many series involving indices related to hydrological drought in Czechia reveal high values of H as well, which was confirmed by unit root tests. On the other hand, precipitation series in Czechia for the period 1961–2012 showed no LTP (Ledvinka, 2015c). The differences between discharge and climate variables from this point of view, using selected stations within the Czech part of the Elbe basin, were highlighted also in Ledvinka and Jedlicka (2018).
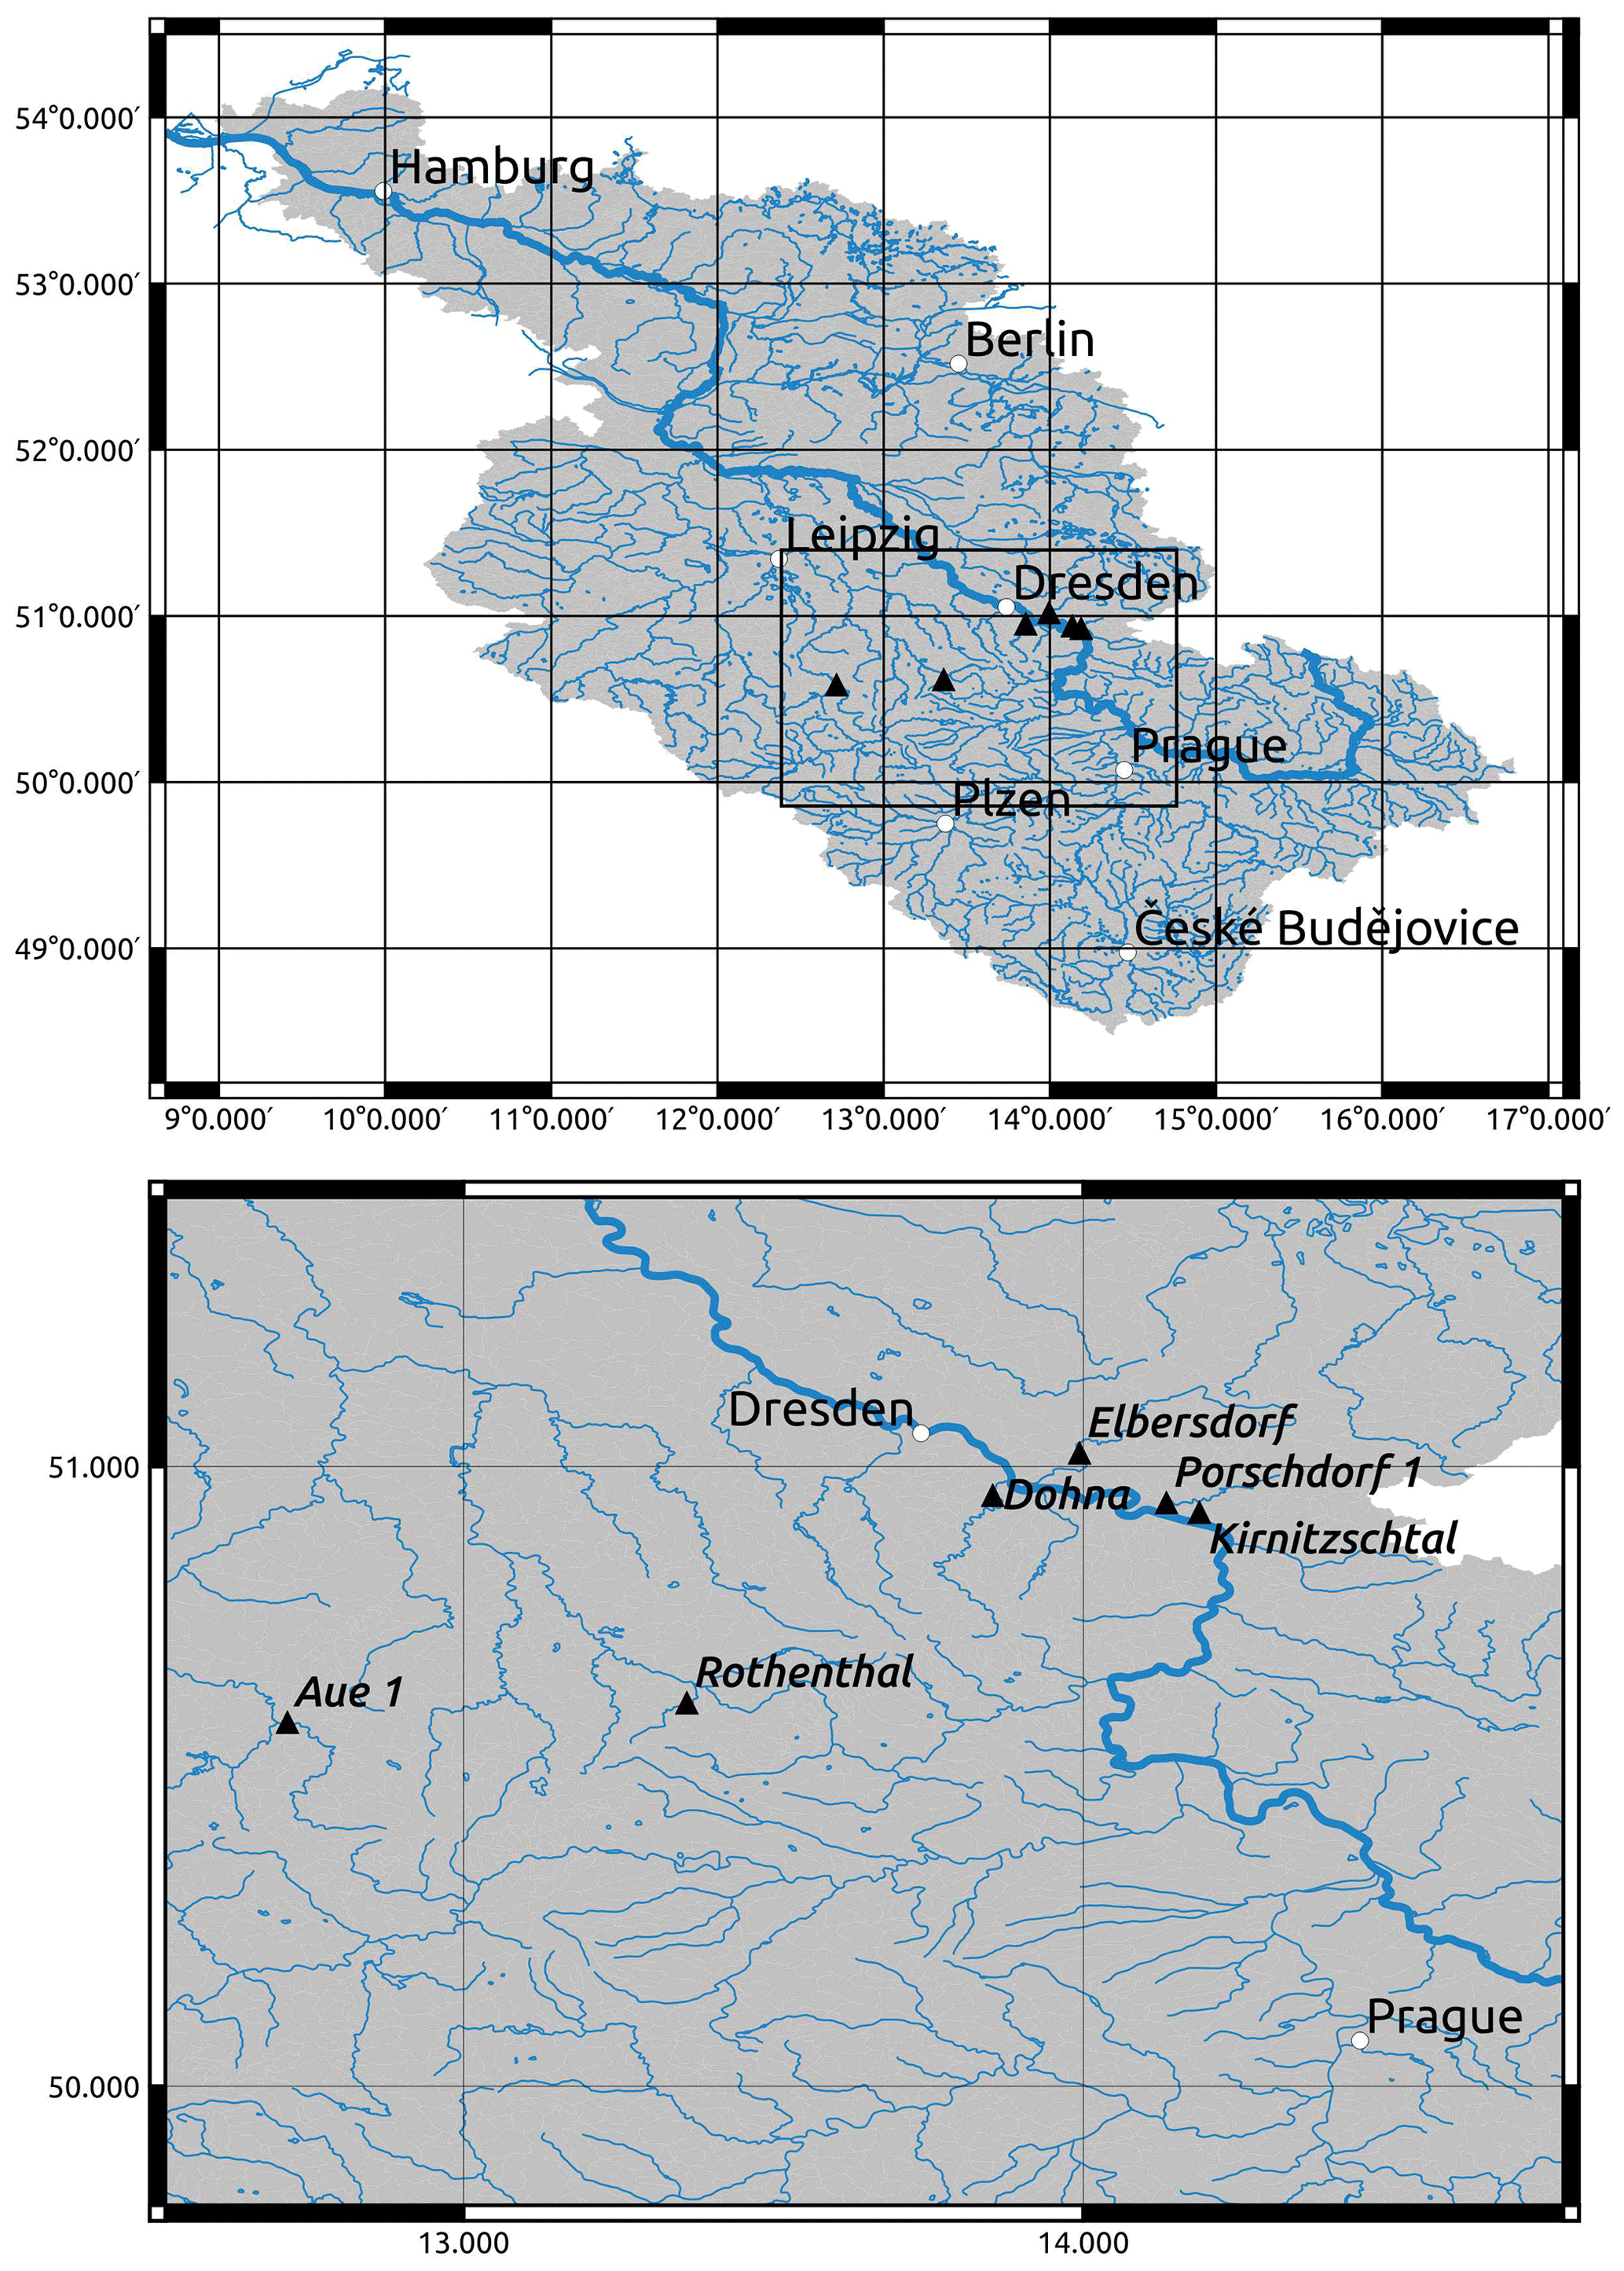
Figure 1Location of six water-gauging stations selected for the case study within the Elbe River basin.
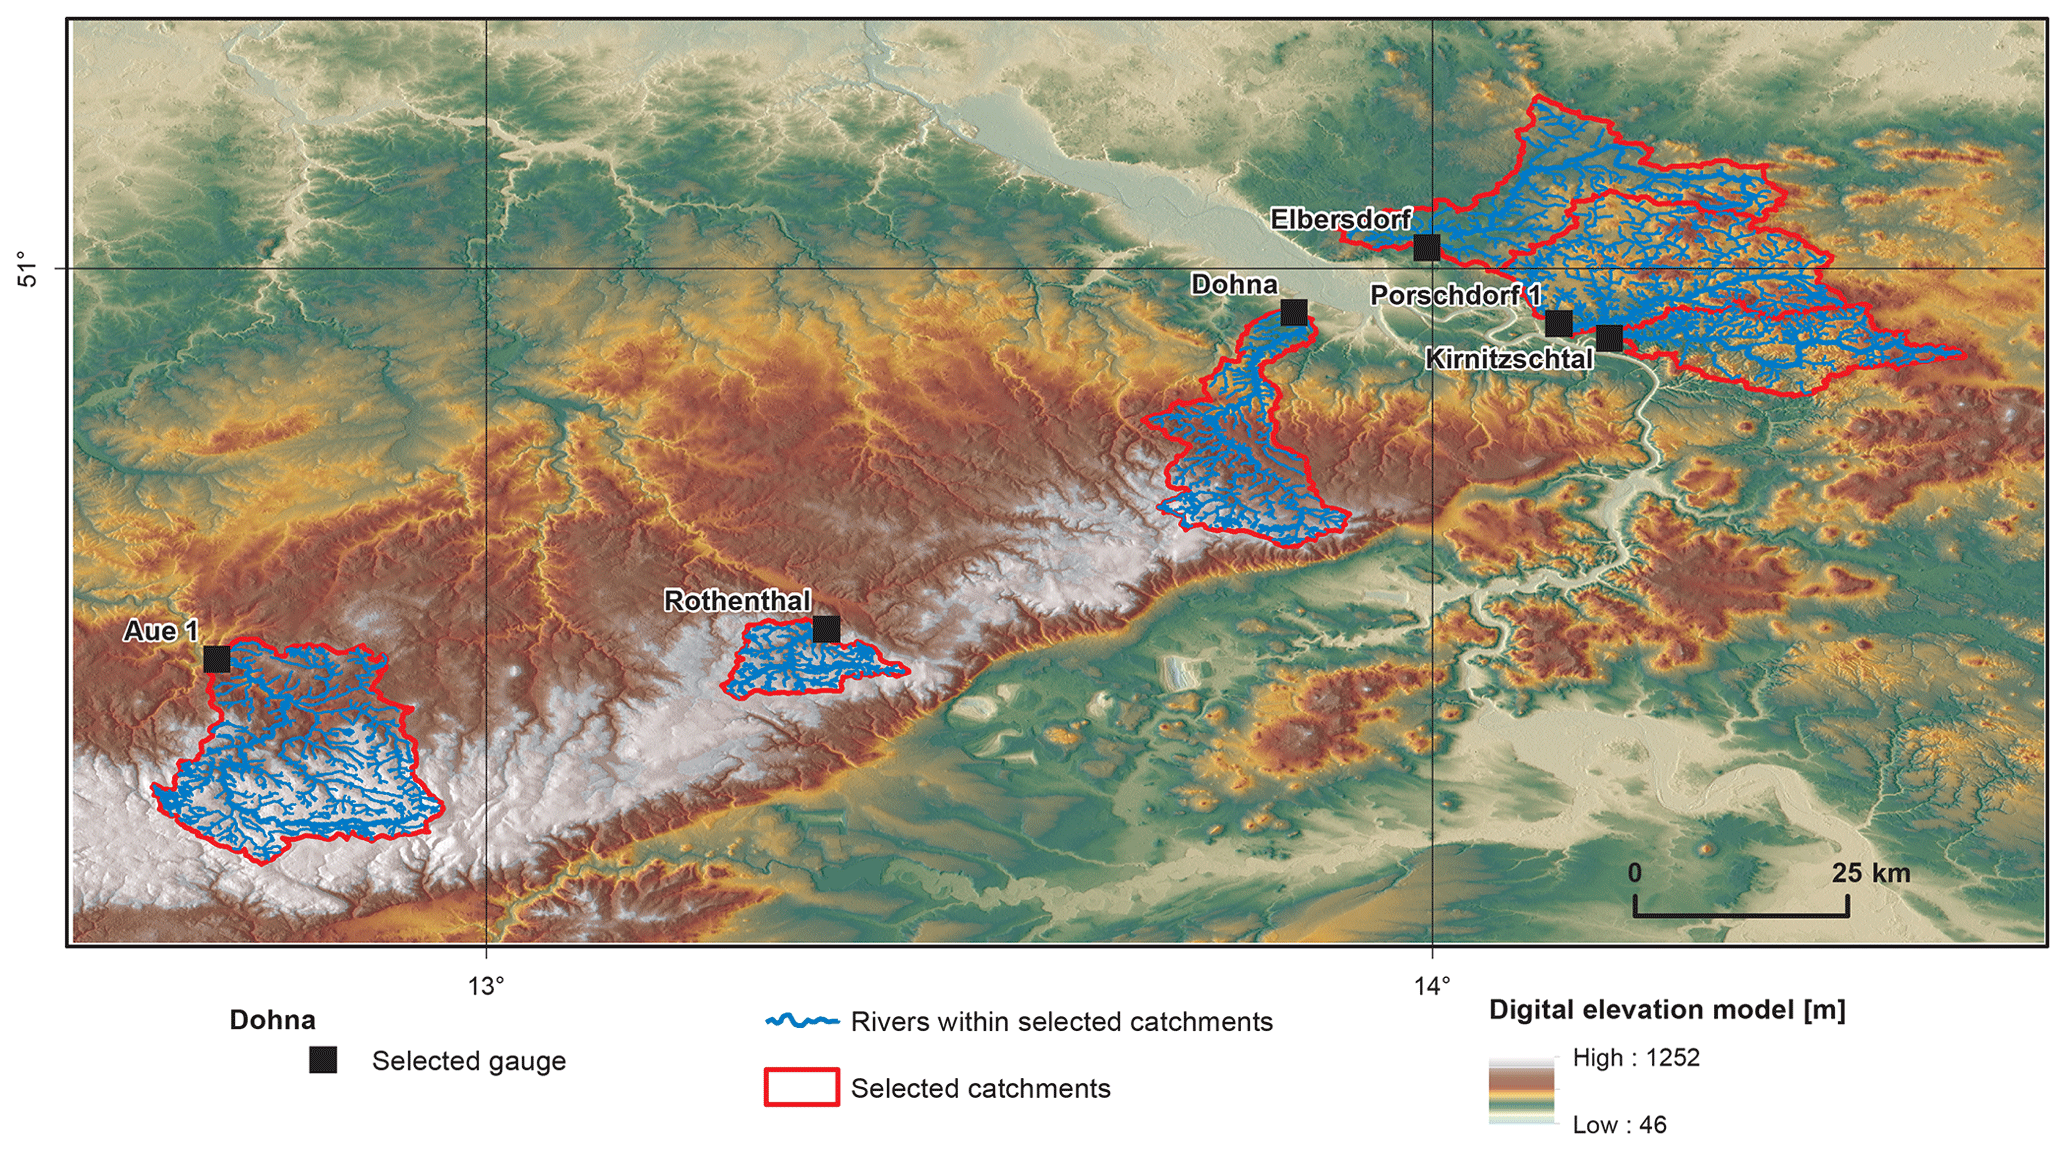
Figure 2Closer look at the catchments represented by investigated gauges, river network within the catchments and elevation conditions in the case study area.
For our own analyses, we selected six discharge time series representing small tributaries in the central part of the Elbe basin close to the borders between Germany and Czechia. All gauges are located within a mountain range (see Figs. 1–2): Aue 1 (on the Schwarzwasser), Rothenthal (on the Natzschung) and Dohna (on the Müglitz) belong to the Ore Mts.; Elbersdorf (on the Wesenitz), Porschdorf 1 (on the Lachsbach) and Kirnitzschtal (on the Kirnitzsch) belong to the Elbe Sandstone Mts. The period, for which all gauges have complete mean daily discharge data, spans from 1929 to 2005. The gauges Kirnitzschtal and Porschdorf 1 had, at the time of writing, the longest time series (i.e. 1911–2017). The Hurst exponent was calculated using the R∕S and DFA methods based on mean monthly discharge time series which were deseasonalized using the method described in Hipel and McLeod (1994) and implemented in the R package “deseasonalize” (McLeod and Gweon, 2013). The results are summarized in Table 1. For all gauges, we found that H>0.5, which means that, very likely, the series contain LTP. DFA gives higher values for H and shows a higher variability in comparison to R∕S. Figure 3 shows a plot of H against catchment area. Based on the series of Porschdorf 1, Fig. 4 depicts how the estimates of H depend on varying sample size. It is obvious that for both applied methods, H decreases with increasing time series length.
Table 1Estimated H exponents for deseasonalized monthly mean discharge time series (1929–2005).
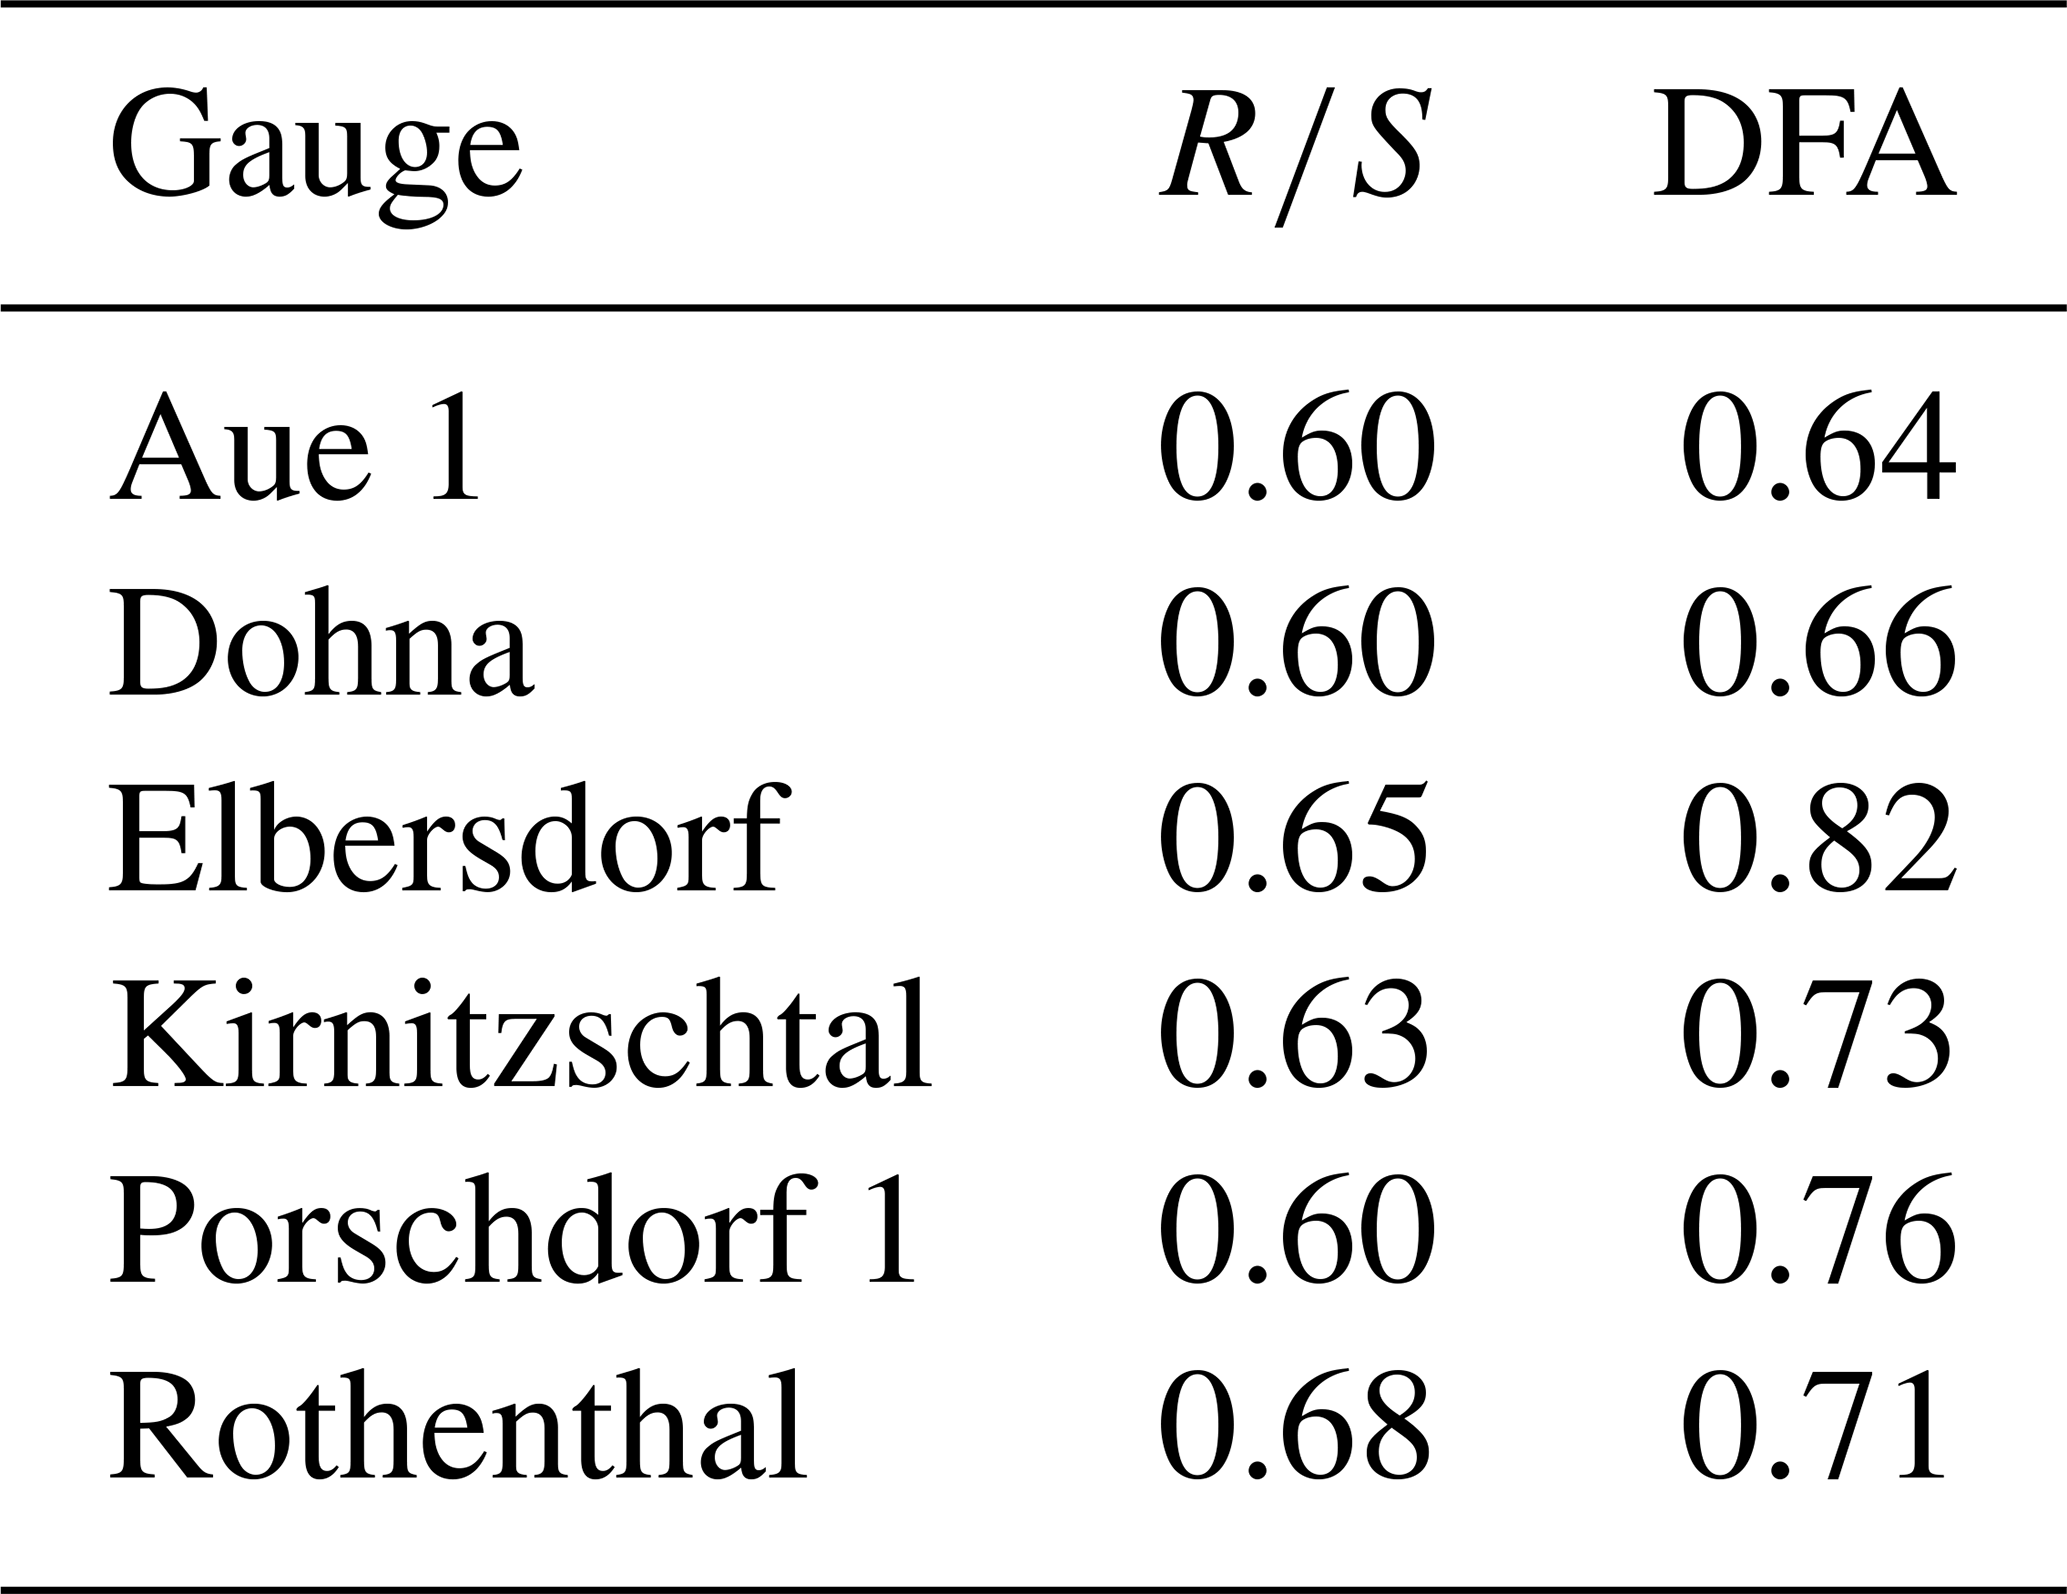
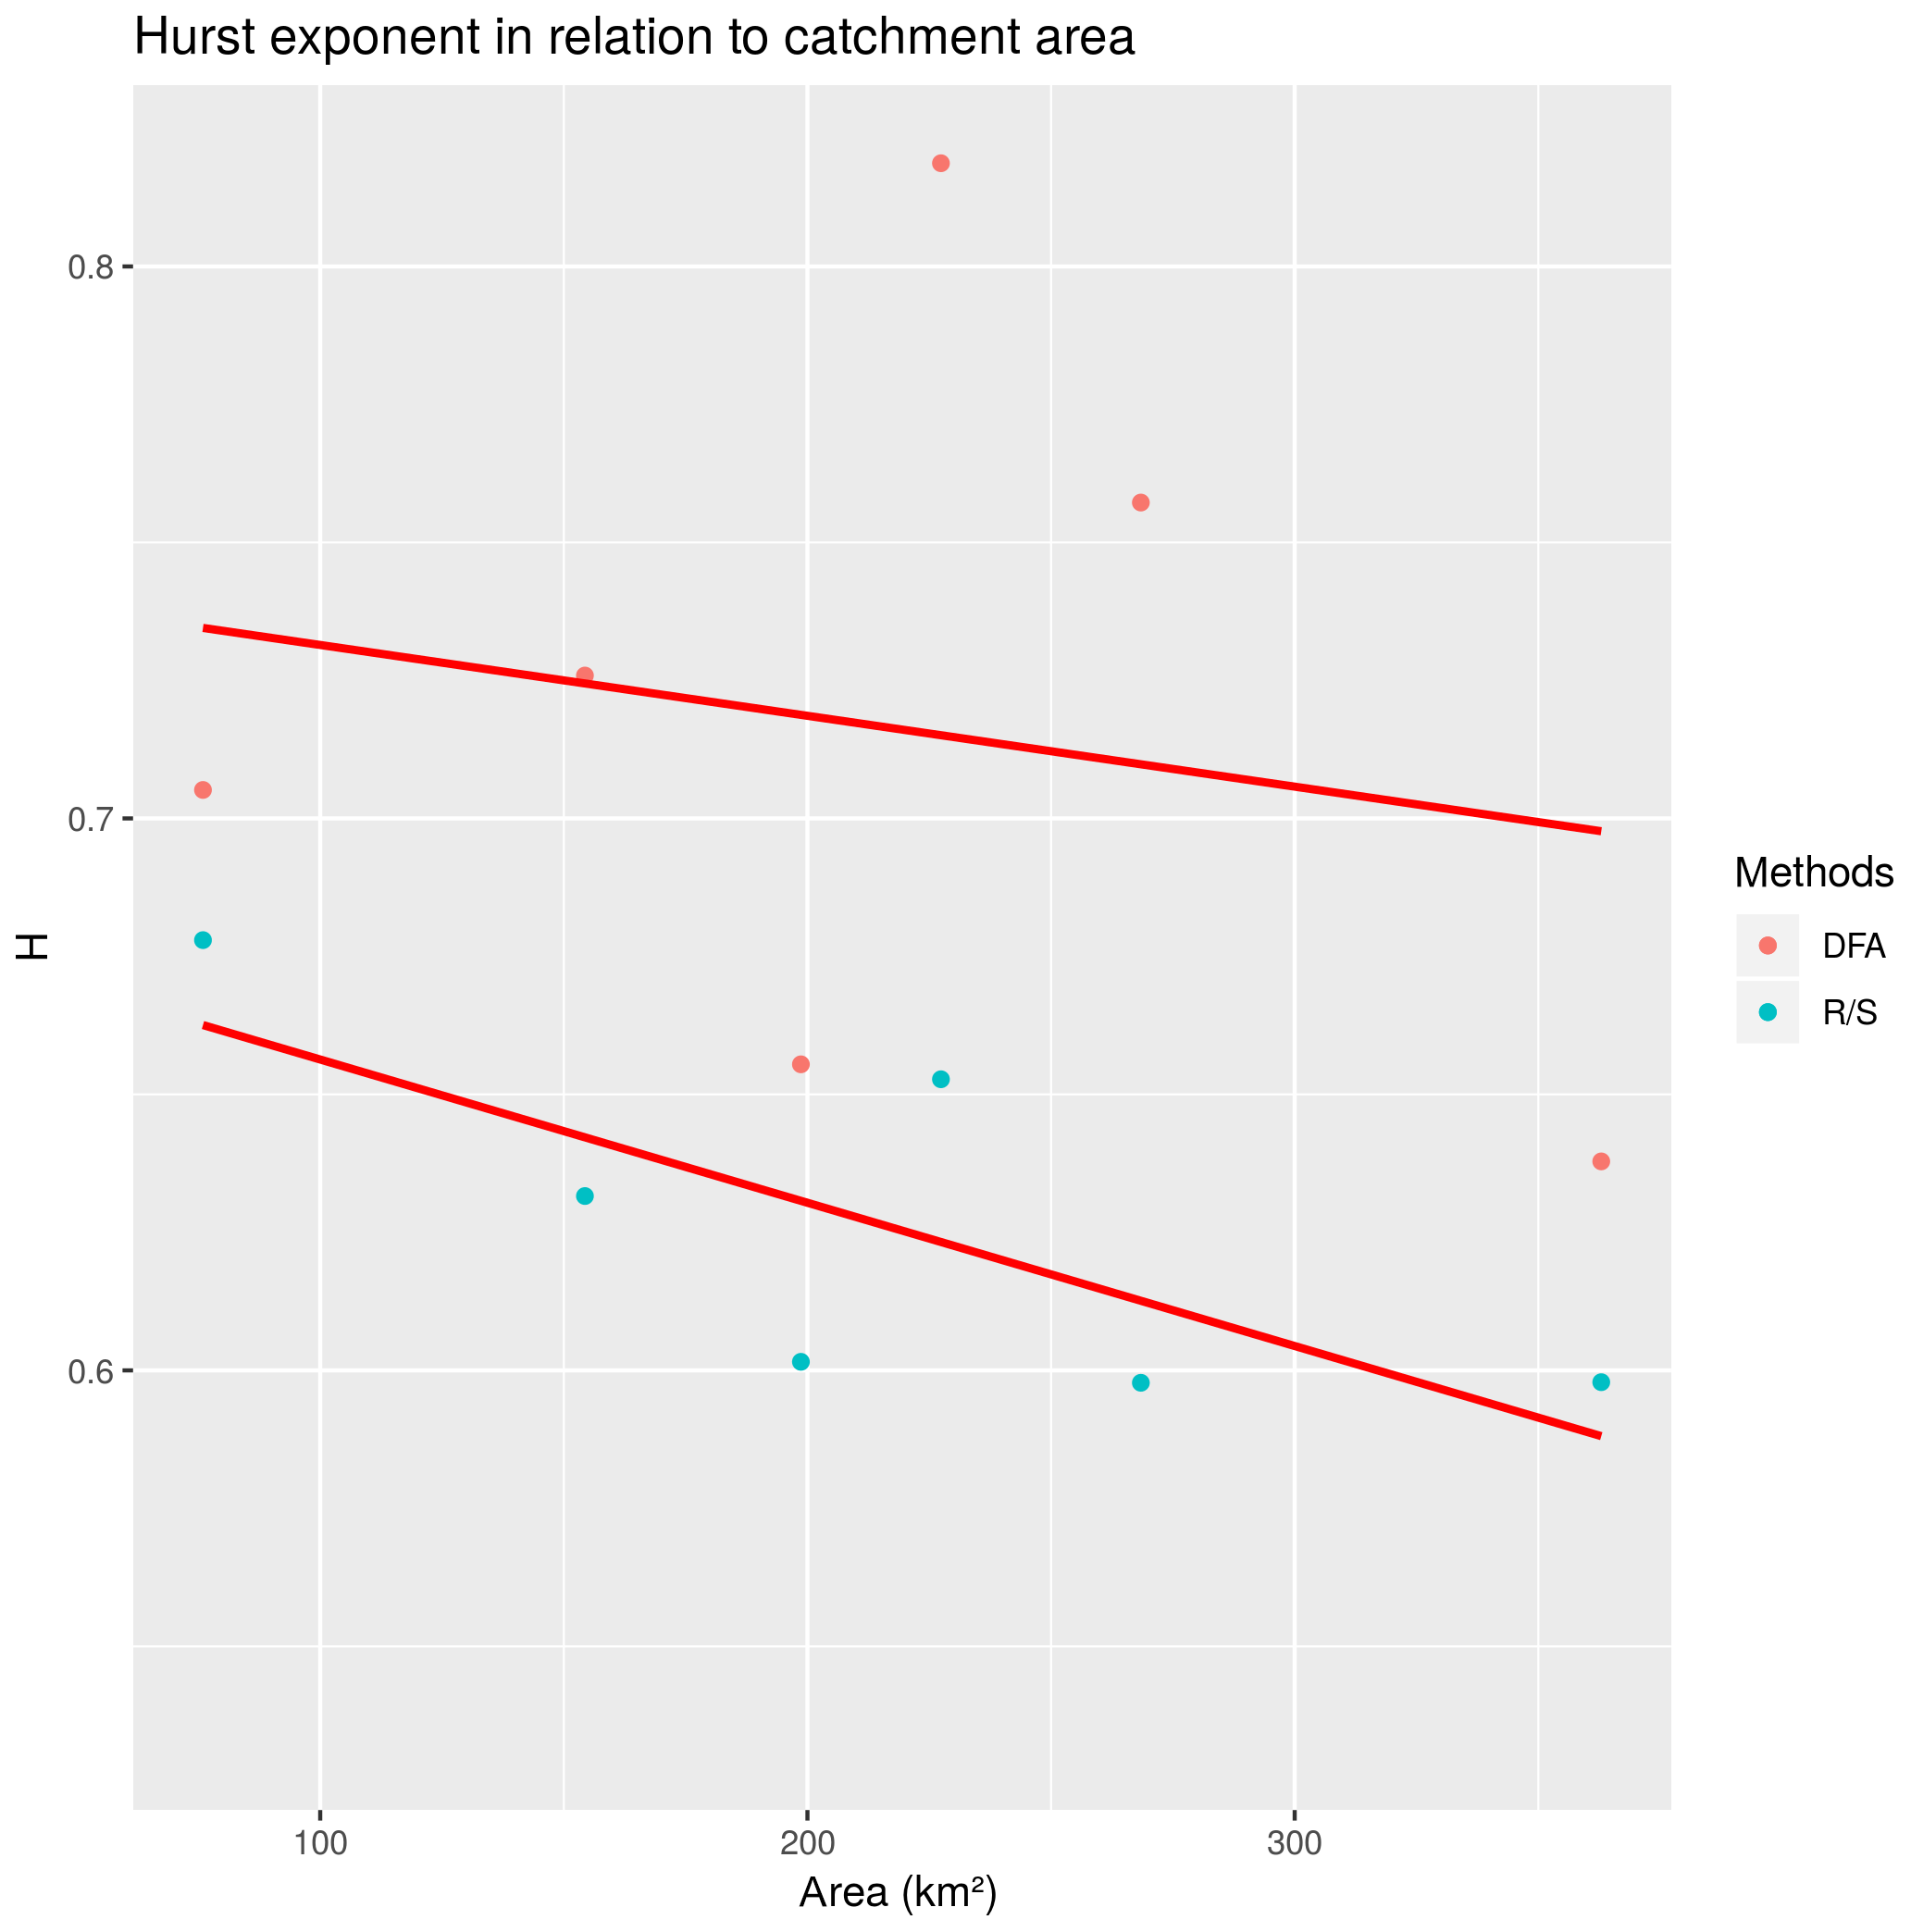

Figure 4Dependence of the estimates of the Hurst exponent H on the length of analyzed series (shown for the Porschdorf 1 gauge).
The quantification of LTP in HM series is a difficult task, especially due to the fact that many estimation methods give different results regarding the magnitude of the LTP parameter H. This is evident also from our case study where only two methods were chosen (see Figs. 3–4). As shown in Fig. 4, also the length of available time series influences the estimation of H. Regarding the obvious tendency for H to decrease in Fig. 4, we must state that our series are still too short to give a clear answer to the question about the general behaviour of H for very long time series. Both convergence to the value of 0.5 as well as to the value signifying LTP might be possible. The issue of the time series length was demonstrated very clearly for precipitation by Markonis and Koutsoyiannis (2016) who compared the behaviour of instrumental records with that of much longer time series derived from proxy data. However, when dealing with changes or trends in hydrological regimes, LTP is a key player since the outcomes of various tests strongly depend on the correct setting of null hypotheses. As the instrumental records are usually short, one should keep in mind the issues mentioned above before constructing models for practical purposes such as setting the lifetime of water works.
Overall, it is believed that LTP is stronger in discharge time series than in other HM series. Today, many hydrologists suggest that LTP is inherited by discharge from the low-frequency climate variability that may be reflected, for instance, in precipitation. The discrepancy between the behaviour of discharge and precipitation could be explained by physical processes similar to filtering (Milly and Wetherald, 2002). The theory that only aggregated short-memory processes are the cause for LTP is somewhat contradictory to our findings in the Elbe basin because the small catchments here reveal relatively high values of the parameter H as well. Moreover, Fig. 3 shows that there is no such dependence suggested by Mudelsee (2007). Further research into this topic should focus on the low-frequency variability of driving forces of runoff and their possible amplification by the catchment system. Distributed water balance models can be a tool for suitable experiments because studying time series of components, such as soil moisture, groundwater recharge, evapotranspiration and others, might give valuable answers regarding interactions and thresholds occurring in the Elbe River basin, many of which may still not be fully understood.
As already stated in several past papers (e.g. Koutsoyiannis, 2003, 2006; Koutsoyiannis and Montanari, 2007), not considering LTP properly may in practice lead to underestimation of process variability that, moreover, needs to be distinguished from change caused by external drivers. Especially in the fields of hydrology and water management, this is a very difficult but important task for designing water works. Therefore, the research into this topic should definitely continue.
Demanded files with data and geodata from Saxony can be currently selected and downloaded using the iDA information system (https://www.umwelt.sachsen.de/umwelt/infosysteme/ida/, last access: 15 July 2020, LfULG, 2019). Individual tiles of digital elevation model for Fig. 2 were selected and retrieved using the USGS EarthExplorer Portal (https://earthexplorer.usgs.gov/, last access: 15 July 2020, USGS, 2020). Both sources require user's registration first, which is for free.
TR worked on the theoretical part, the case study (including the table and figures apart from Fig. 2) and the literature overview regarding Germany. OL worked on the rest of the manuscript.
The authors declare that they have no conflict of interest.
This article is part of the special issue “Hydrological processes and water security in a changing world”. It is a result of the 8th Global FRIEND–Water Conference: Hydrological Processes and Water Security in a Changing World, Beijing, China, 6–9 November 2018.
We would like to acknowledge Petra Walther (LfULG Sachsen) for providing suitable time series from the Saxon part of the Elbe basin.
Beran, J.: Statistics for Long-Memory Processes, Chapman & Hall, New York, 1994.
Borchers, H. W.: pracma: Practical Numerical Math Functions, R package version 2.2.9, available at: https://CRAN.R-project.org/package=pracma (last access: 21 April 2020), 2019.
Garcia, C. A.: nonlinearTseries: Nonlinear Time Series Analysis, R package version 0.2.8, available at: https://CRAN.R-project.org/package=nonlinearTseries (last access: 21 April 2020), 2020.
Graves, T., Gramacy, R., Watkins, N., and Franzke, C.: A brief history of long memory: Hurst, Mandelbrot and the road to ARFIMA, 1951–1980, Entropy, 19, 437, https://doi.org/10.3390/e19090437, 2017.
Hamed, K. H.: Trend detection in hydrologic data: the Mann–Kendall trend test under the scaling hypothesis, J. Hydrol., 349, 350–363, https://doi.org/10.1016/j.jhydrol.2007.11.009, 2008.
Hipel, K. W. and McLeod, A. I.: Time Series Modelling of Water Resources and Environmental Systems, Elsevier, Amsterdam, 1994.
Hurst, H. E.: Long term storage capacity of reservoirs (with discussions), Trans. Am. Soc. Civ. Eng., 116, 770–808, 1951.
Kantelhardt, J. W., Koscielny-Bunde, E., Rego, H. H., Havlin, S., and Bunde, A.: Detecting long-range correlations with detrended fluctuation analysis, Phys. Stat. Mech. Its Appl., 295, 441–454, https://doi.org/10.1016/S0378-4371(01)00144-3, 2001.
Kantelhardt, J. W., Koscielny-Bunde, E., Rybski, D., Braun, P., Bunde, A., and Havlin, S.: Long-term persistence and multifractality of precipitation and river runoff records, J. Geophys. Res.-Atmos., 111, D01106, https://doi.org/10.1029/2005JD005881, 2006.
Klemeš, V.: The Hurst phenomenon: a puzzle?, Water Resour. Res., 10, 675–688, https://doi.org/10.1029/WR010i004p00675, 1974.
Klemeš, V.: Physically based stochastic hydrologic analysis, in Advances in Hydroscience, vol. 11, edited by: Chow, V. T., Academic Press, New York, 285–356, 1978.
Koutsoyiannis, D.: Climate change, the Hurst phenomenon, and hydrological statistics, Hydrol. Sci. J., 48, 3–24, https://doi.org/10.1623/hysj.48.1.3.43481, 2003.
Koutsoyiannis, D.: Nonstationarity versus scaling in hydrology, J. Hydrol., 324, 239–254, https://doi.org/10.1016/j.jhydrol.2005.09.022, 2006.
Koutsoyiannis, D. and Montanari, A.: Statistical analysis of hydroclimatic time series: Uncertainty and insights, Water Resour. Res., 43, W05429, https://doi.org/10.1029/2006WR005592, 2007.
Ledvinka, O.: Are there nonstationarities and the Hurst phenomenon in discharge series within the Ore Mountains region?, in: Hydrology of a Small Basin 2014, vol. 1, edited by: Brych, K. and Tesař, M., Czech Hydrometeorological Institute, Praha, 287–295, 2014.
Ledvinka, O.: Evolution of low flows in Czechia revisited, Proc. IAHS, 369, 87–95, https://doi.org/10.5194/piahs-369-87-2015, 2015a.
Ledvinka, O.: Scaling of low flows in Czechia – an initial assessment, Proc. IAHS, 366, 188–189, https://doi.org/10.5194/piahs-366-188-2015, 2015b.
Ledvinka, O.: Nonstationarities in technical precipitation series in Czechia, Acta Hydrol. Slovaca, 16, 199–207, 2015c.
Ledvinka, O. and Jedlicka, M.: Freely available daily hydrometeorological data from Czechia: further insights, edited by: Kaźmierczak, B., Kutyłowska, M., Piekarska, K., and Jadwiszczak, P., E3S Web Conf., 44, 00093, https://doi.org/10.1051/e3sconf/20184400093, 2018.
LfULG: interdisziplinäre Daten und Auswertungen, available at: https://www.umwelt.sachsen.de/umwelt/infosysteme/ida/ (last access: 15 July 2020), 2019.
Mandelbrot, B. B. and Van Ness, J. W.: Fractional Brownian motions, fractional noises and applications, SIAM Rev., 10, 422–437, https://doi.org/10.1137/1010093, 1968.
Mandelbrot, B. B. and Wallis, J. R.: Noah, Joseph, and operational hydrology, Water Resour. Res., 4, 909–918, https://doi.org/10.1029/WR004i005p00909, 1968.
Mandelbrot, B. B. and Wallis, J. R.: Some long-run properties of geophysical records, Water Resour. Res., 5, 321–340, https://doi.org/10.1029/WR005i002p00321, 1969.
Markonis, Y. and Koutsoyiannis, D.: Scale-dependence of persistence in precipitation records, Nat. Clim. Change, 6, 399–401, https://doi.org/10.1038/nclimate2894, 2016.
Marković, D. and Koch, M.: Sensitivity of Hurst parameter estimation to periodic signals in time series and filtering approaches, Geophys. Res. Lett., 32, L17401, https://doi.org/10.1029/2005GL024069, 2005.
Markovic, D. and Koch, M.: Long-term variations and temporal scaling of hydroclimatic time series with focus on the German part of the Elbe River Basin, Hydrol. Process., 28, 2202–2211, https://doi.org/10.1002/hyp.9783, 2014.
McLeod, A. I. and Gweon, H.: Optimal deseasonalization for monthly and daily geophysical time series, J. Environ. Stat., 4, 1–11, 2013.
Mesa, O. J. and Poveda, G.: The Hurst effect: The scale of fluctuation approach, Water Resour. Res., 29, 3995–4002, https://doi.org/10.1029/93WR01686, 1993.
Milly, P. C. D. and Wetherald, R. T.: Macroscale water fluxes 3. Effects of land processes on variability of monthly river discharge, Water Resour. Res., 38, 1235, https://doi.org/10.1029/2001WR000761, 2002.
Montanari, A.: Long-range dependence in hydrology, in: Theory and Applications of Long-Range Dependence, edited by: Doukhan, P., Oppenheim, G., and Taqqu, M. S., Birkhäuser, Boston, Massachusetts, 461–472, 2003.
Mudelsee, M.: Long memory of rivers from spatial aggregation, Water Resour. Res., 43, W01202, https://doi.org/10.1029/2006WR005721, 2007.
Peng, C.-K., Buldyrev, S. V., Havlin, S., Simons, M., Stanley, H. E., and Goldberger, A. L.: Mosaic organization of DNA nucleotides, Phys. Rev. E, 49, 1685–1689, https://doi.org/10.1103/PhysRevE.49.1685, 1994.
USGS: EarthExplorer Portal, available at: https://earthexplorer.usgs.gov/, last access: 15 July 2020.
v. Berg: Wie kann man die Verminderung des Wasserstandes in der Elbe erklären?, Wiss. Beil. Leipz. Ztg., 13 June 1867.
Willems, W. and Min, A.: Praxisgerechte Detektion von Trends unter Berücksichtigung von Kurz- und Langzeit-Autokorrelationsstrukturen, IAWG, Ottobrunn, 2016.
Yue, S., Pilon, P., Phinney, B., and Cavadias, G.: The influence of autocorrelation on the ability to detect trend in hydrological series, Hydrol. Process., 16, 1807–1829, https://doi.org/10.1002/hyp.1095, 2002a.
Yue, S., Pilon, P., and Cavadias, G.: Power of the Mann–Kendall and Spearman's rho tests for detecting monotonic trends in hydrological series, J. Hydrol., 259, 254–271, https://doi.org/10.1016/S0022-1694(01)00594-7, 2002b.