the Creative Commons Attribution 4.0 License.
the Creative Commons Attribution 4.0 License.
 | 22 Apr 2020
DInSAR data assimilation for optimising maintenance at transition zones between bridges and road embankments: a numerical study
Claudio Giangreco
Arjan A. M. Venmans
Dario Peduto
Transition zones between bridges and embankments are the most maintenance-prone locations in the road network of The Netherlands due to the very compressible soft soil layers that are widespread in the subsoil of the country. This aspect causes (differential) settlements at the ground surface, damage and maintenance costs for the road owner, and delays to road users. This paper provides the proof-of-concept of an innovative multi-source data-driven method based on the assimilation of both conventional settlement plate and satellite DInSAR data in numerical geotechnical modelling with the aim of supporting informed maintenance decisions.
- Article
(4265 KB) - Full-text XML
- BibTeX
- EndNote


Historically, the Netherlands have always been prone to subsidence due to the presence of very soft and compressible soils in the shallow subsoil layers, resulting in damage to both buildings and the infrastructure network. These layers, mainly composed by peat, organic clay and silt, are characterised by low stiffness, high compressibility and high creep rates (Den Haan and Kruse, 2006). Rijkswaterstaat, the Dutch National Road Authority, estimates that the money yearly spent on maintaining the transition zones between bridges and embankments sums up to about EUR 1.5 million corresponding to 1 %–2 % of the entire budget yearly allocated for subsurface-related maintenance works of all the road infrastructure (Dieteren, 2011; Venmans and Kwast, 2011). When the differential settlement between a bridge and its approach embankment reaches unacceptable values, the problem is commonly faced with the restoration of the road pavement through the addition of new asphalt layers without considering other possible solutions. The paper suggests a new approach in the analysis of settlements affecting infrastructure with the aim of helping the Road Authorities and the contractors in the decision-making process of future maintenance operations. The validation test was carried out by exploiting both conventional and DInSAR data sets. The latter represents nowadays a well-known technique to measure subsidence-induced ground displacements (Peduto et al., 2019) – with an accuracy of a few mm yr−1 (Peduto et al., 2018) – and to monitor structures and infrastructure (Nicodemo et al., 2017; Peduto et al., 2017, 2018).
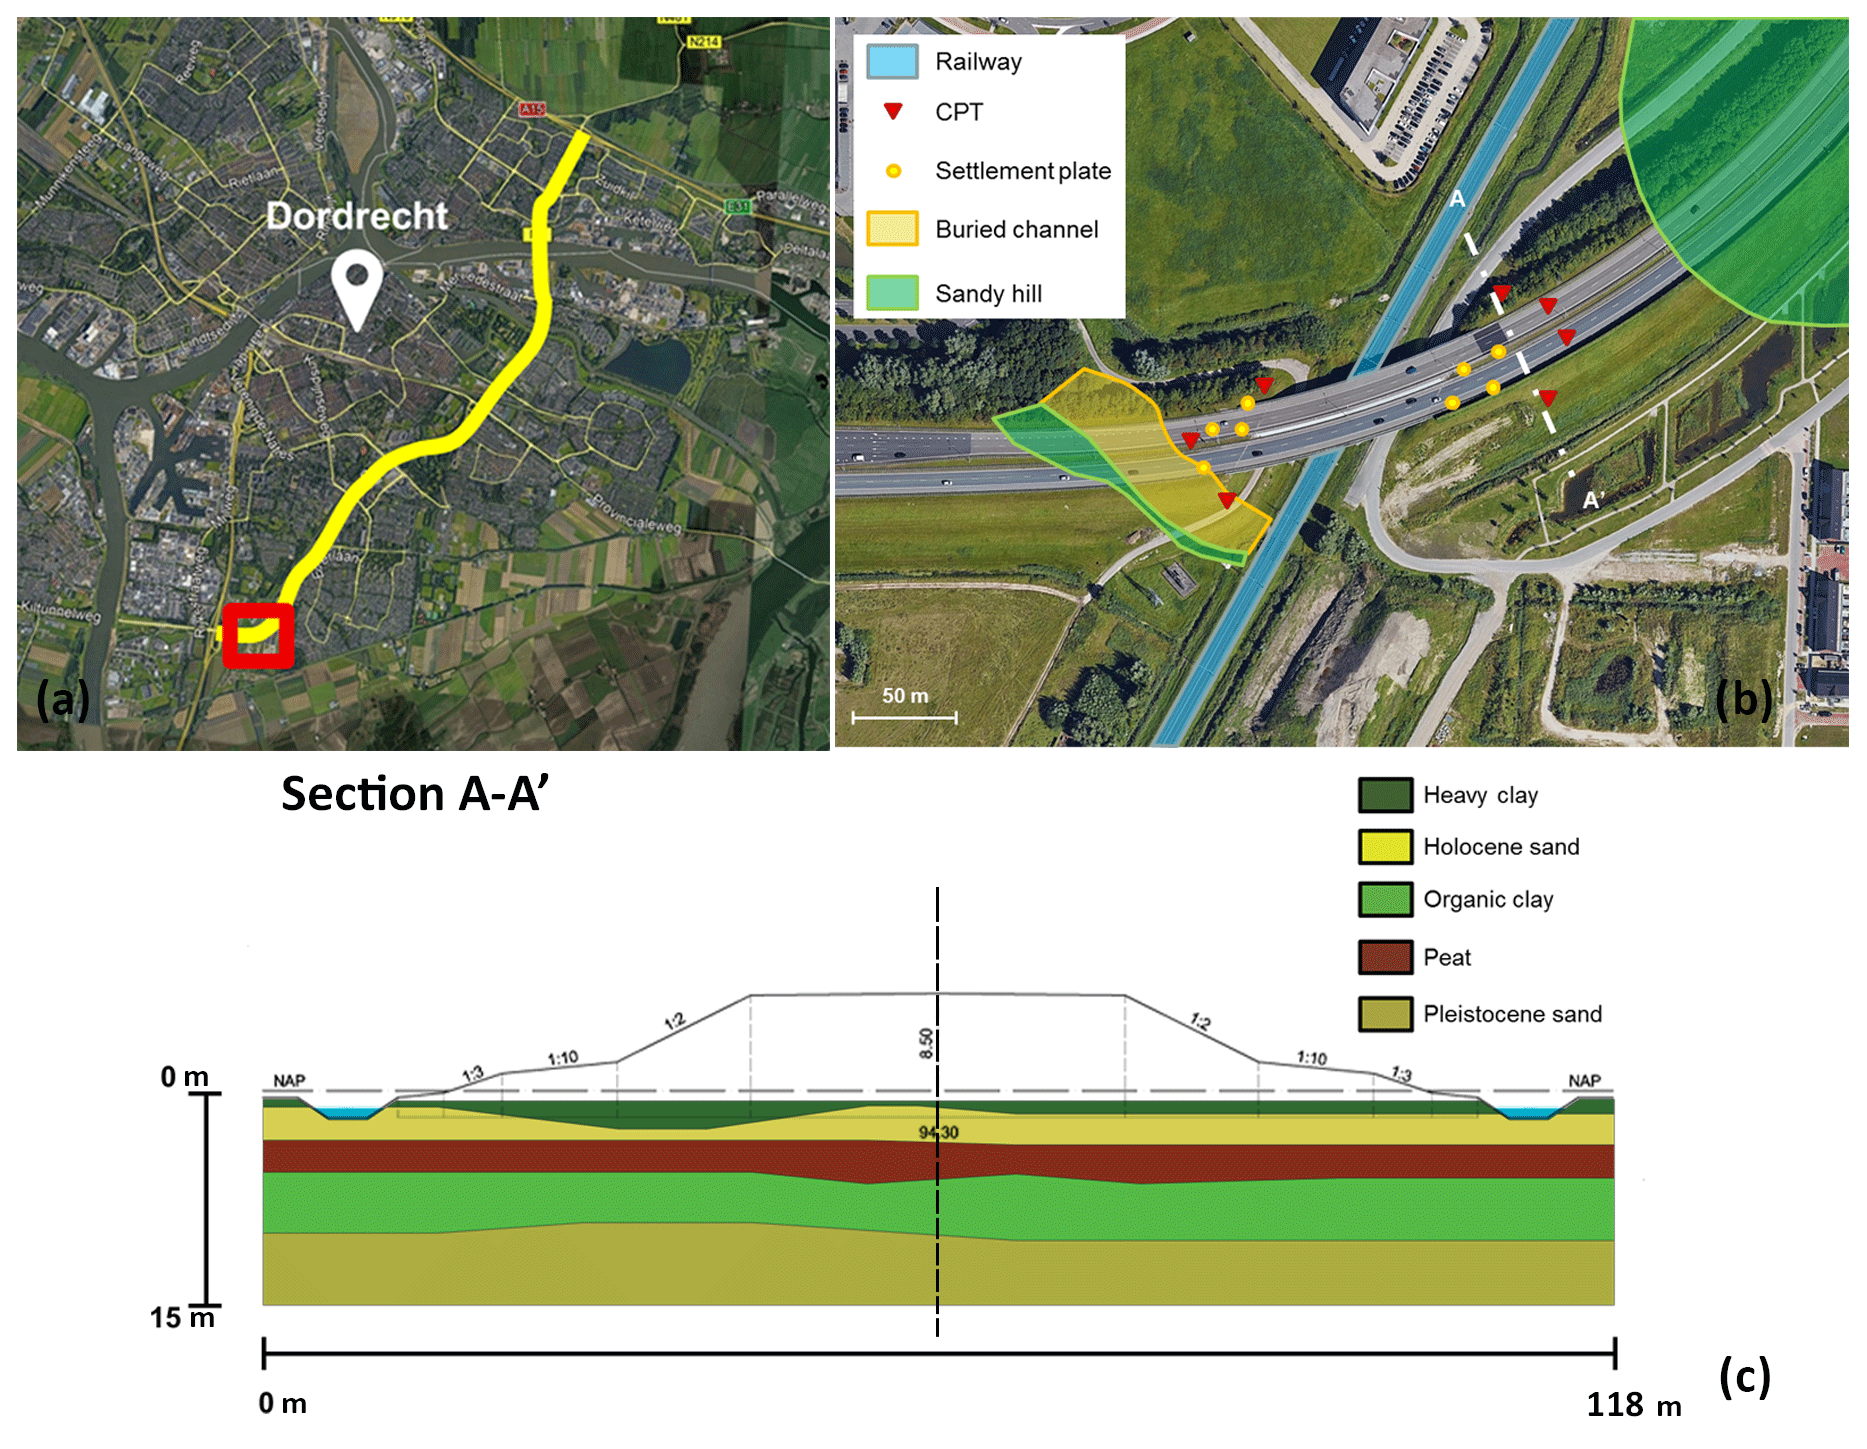
Figure 1(a) View of N3 road; (b) map of the analysed road section with locations of CPTs and settlement plates; (c) soil stratigraphy and embankment cross section. (Source: base photos from © Google Maps.)
The N3 is a Dutch road located in the south-western part of the Netherlands, near the city of Dordrecht (Fig. 1a). The N3, with a length of approximately 10 km, is characterised by elevated embankments on top of which the road is positioned. The presence of the embankments linked to the bridges allows having cross-junctions with other network systems (Fig. 1b). Rijkswaterstaat is planning different maintenance operations to take place in the next years. In particular, the N3 is scheduled to be maintained mainly all along its length between 2020 and 2022. The location selected for this study is identified in Fig. 1a with the red rectangle. The embankment (identified by the cross-section named A–A′, see Fig. 1b and c) is as high as +8.50 m N.A.P. near the junction to the bridge. In this area, there is a cross-junction (Fig. 1b) with a railway track. In situ tests (i.e. CPTs), laboratory tests and conventional monitoring data (i.e. settlement plates) are available. As for soil stratigraphy, some less compressible inserts dating from the Pleistocene age are present.
The embankment construction took place from 25 May 1991 until the first months of 1993 by means of filling operations that raised the embankments with stages of 0.5 up to 1.0 m.
The soil stratigraphy and the cross sections of the embankment are depicted in Fig. 1c. Five main soil types can be identified (from top to bottom): heavy clay (depth −0.70 m to −3.20 m N.A.P.); Holocene sand (depth −1.20 m to −4.60 m N.A.P.); peat (depth −4.20 m to −8.00 m N.A.P.); organic clay (depth −7.00 m to −12.90 m N.A.P.); Pleistocene sand (depth from −11.40 m N.A.P.).
The unit weights and the permeability the involved soils (Table 1) are known from laboratory tests; the compression constants a, b and c of the Isotache model (den Haan, 1996) are computed through the empirical correlations with volumetric weight proposed by Den Haan and Kruse (2006). Table 1 shows all soil properties.
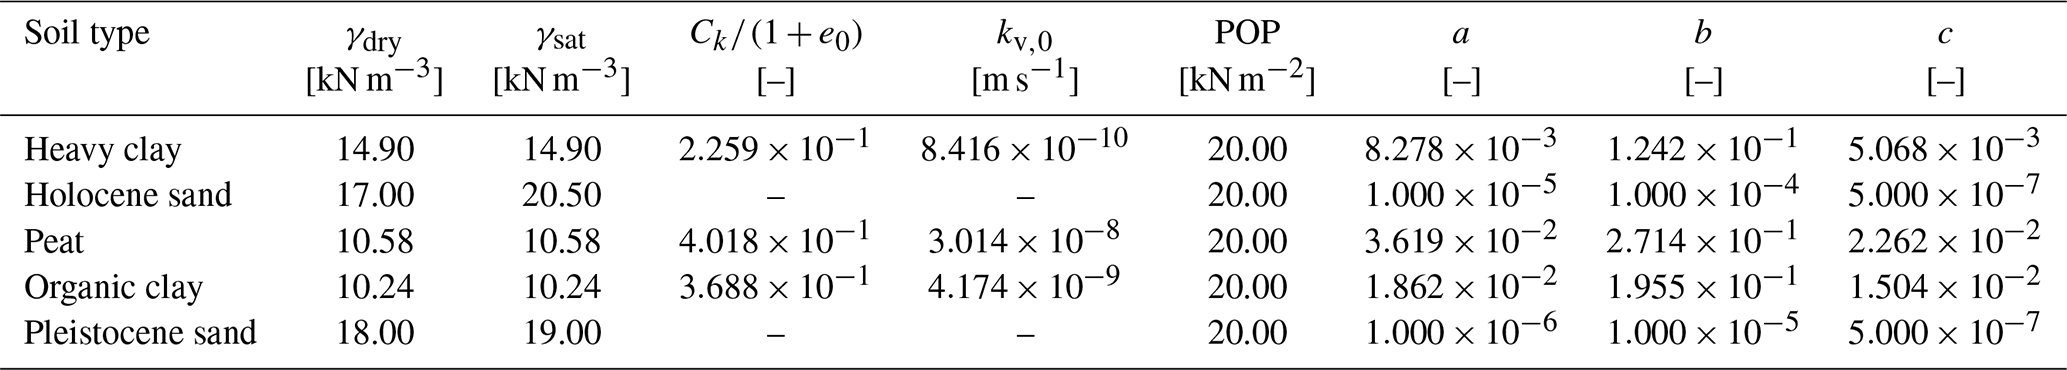
Table 1Soil parameters. γdry and γsat are the volumetric weights above and below the groundwater table, is the permeability strain modulus, e0 is the initial void ratio, kv,0 is the initial vertical permeability, POP is the past overburden pressure, a, b and c are the compression constants for recompression/swelling, virgin compression and creep.
The procedure followed consists of three phases. In Phase 1, all the available information on the selected location was collected. The geotechnical subsoil model of the embankment – deriving from the information concerning geometry, CPTs and laboratory tests – was implemented in the software D-Settlement (Visschedijk et al., 2016) to perform the settlement prediction. Phase 2 dealt with the calibration of the previously defined model. This phase was divided into two sub-phases: first, both conventional monitoring data (i.e. settlement plates) and DInSAR observations were merged. Then, these measurements were assimilated with the previously defined model in order to calibrate the initial predictions updated by the Maximum A-Posteriori estimate (MAP) method. Phase 3 dealt with the analysis of different maintenance scenarios based on the calibrated geotechnical model.
The knowledge on the real filling schedules of the embankment allowed simulating the real construction phases. The settlement prediction (see Fig. 2) in the period (1991–2019) from the start of the construction to present leads to an absolute settlement of 2.750 m including a post-construction settlement (1993–2019) equal to 0.280 m in the centre-line of the embankment (Fig. 2).

Figure 2Predicted settlement of the centre-line of the embankment (vertical red-dashed line in Fig. 1c). Time is reported on a logarithmic scale.
The following monitoring datasets were combined: settlement plates (Fig. 1b) covering the construction period from 1991 to 1992; DInSAR data (Fig. 3a), covering the serviceability period from 1995 to 2018, deriving from the processing of images acquired by 4 different satellites: ERS-2 (from 1995 to 2001), Envisat (from 2003 to 2010), Radarsat-2 (from 2010 to 2017) and TerraSAR-X (from 2015 to 2018). DInSAR data were pre-processed by SkyGeo via a PSI-like algorithm (Ferretti et al., 2001). First, all available DInSAR observations were merged (Fig. 3b) assuming a constant velocity in time (equal to the average velocity value derived from the linear regression of each time series, see the solid lines in Fig. 3b) for the timespan for which no data were available. Then, DInSAR time series were combined with the average measurements of the selected settlement plates. For this purpose, the settlements predicted by the model were fitted to the settlement plates information and the merged DInSAR observations were attached (Fig. 4) to the value of the settlement prediction at the time of the first satellite acquisition (i.e. Ers-2 in 1995). The combined observations were introduced in the D-Settlement model to calibrate the predictions of the model on the observations by modifying the fitting factors. The absolute settlement in the centre-line in 2019 after fitting is 2.531 m, with post-construction settlement (1993–2019, the black-dashed line in Fig. 4) equal to 0.384 m. The fitting factors and the calibrated values of soil parameters are listed in Table 2. Phase 3 pursued three different settlement predictions (period 2019–2034) considering the following three scenarios:
-
The “do nothing” scenario (scenario 0 hereafter) assumes no maintenance works will take place in 2019.
-
The “adding of asphalt” scenario (scenario 1 hereafter) assumes that the old asphalt pavement will be replaced by a new top layer in 2019. The new top layer entity will fully compensate the settlement during the period between 2009 and 2019 (i.e. around 0.06 m, see Table 3).
-
The “EPS fill” scenario (scenario 2 hereafter) assumes the replacement of 1.50 m of the original sand fill by the lighter Expanded Polystyrene (EPS) Foam and the renewal of the approach slab above it.
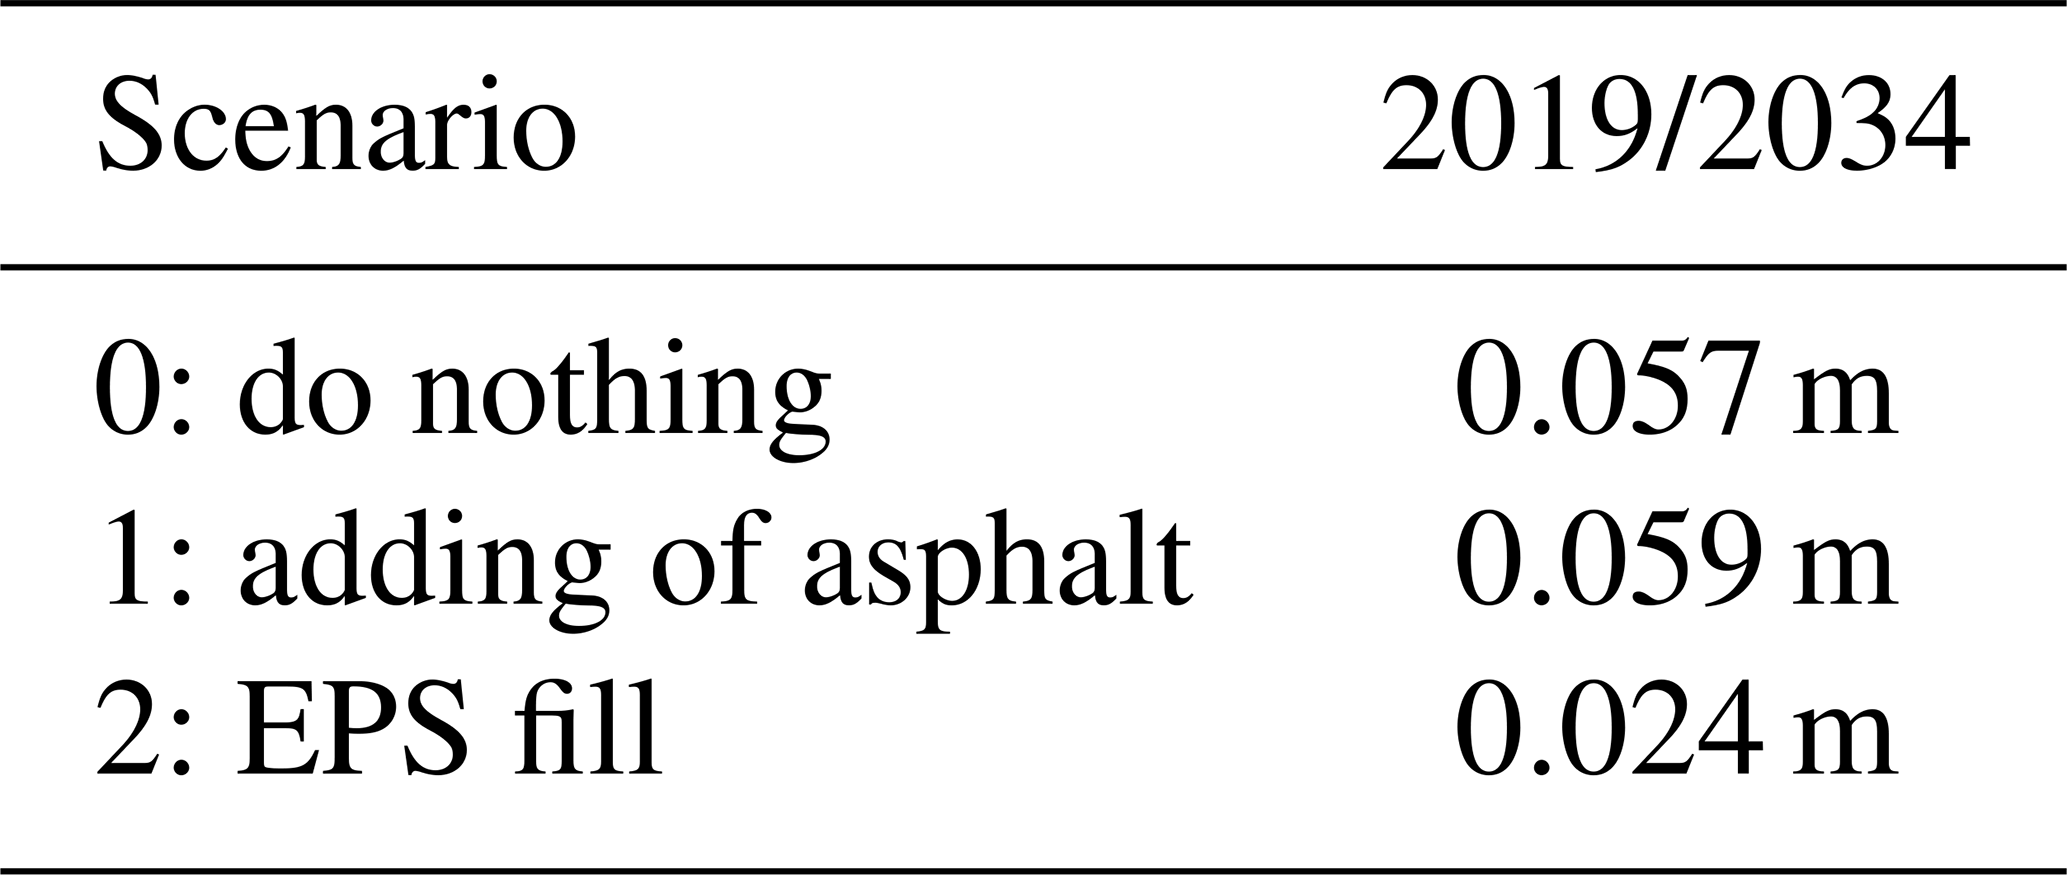
Figure 5 depicts the results of the three-scenario analysis in terms of predicted settlements up to 2034. Table 3 shows the values of post-maintenance settlements.
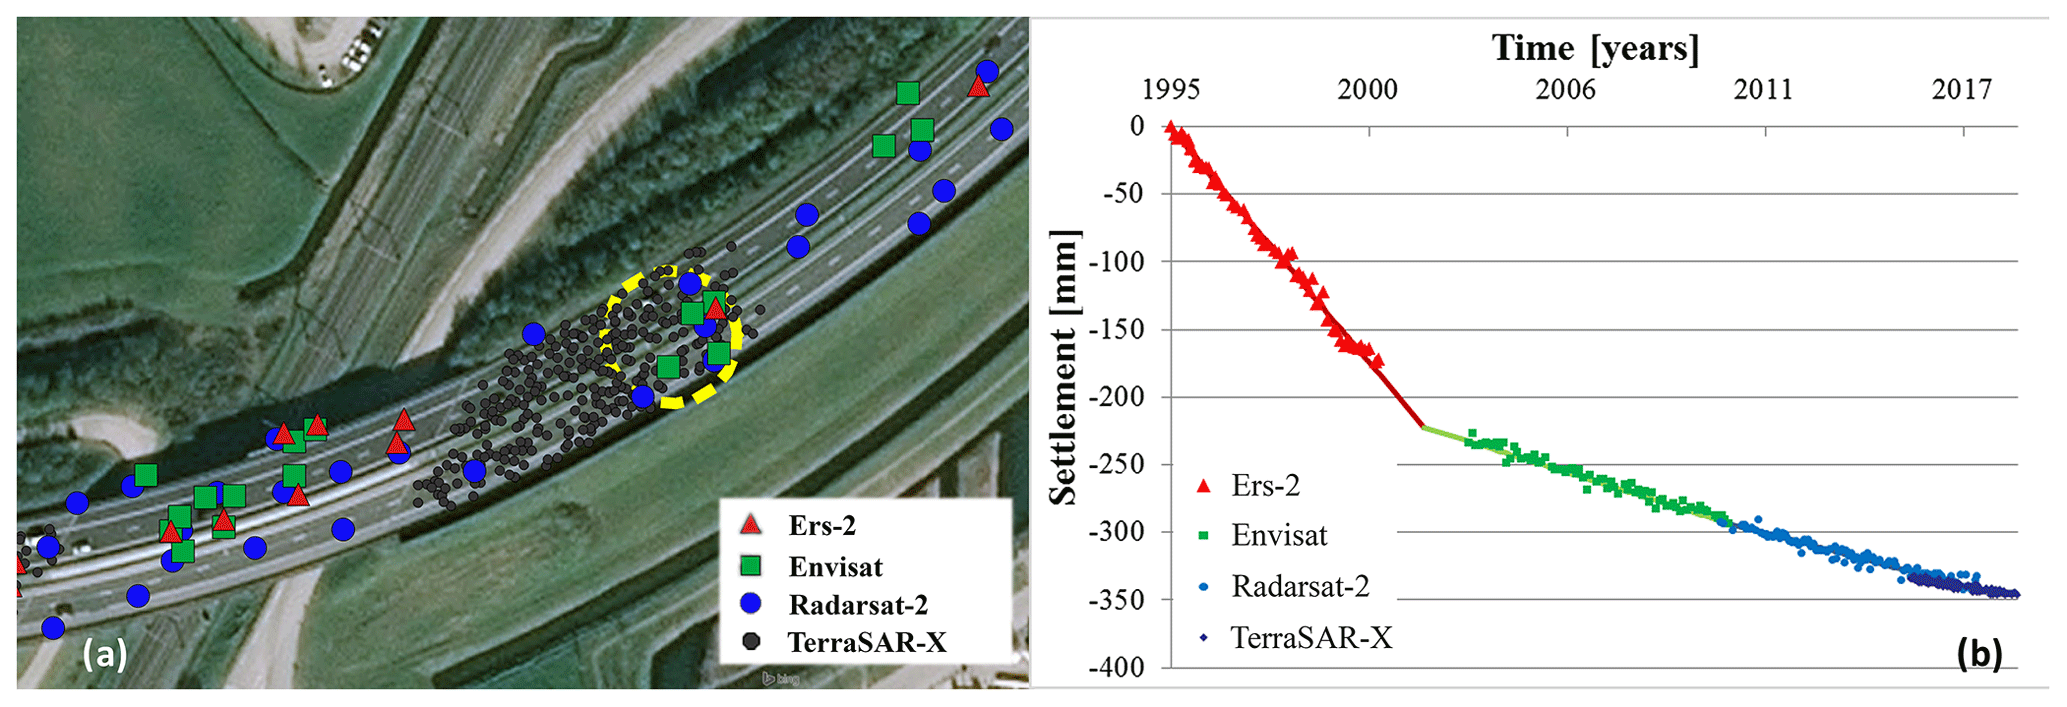
Figure 3(a) Map of DInSAR benchmarks from four different SAR sensors: ERS-2, Envisat, Radarsat-2 and TerraSAR-X. (b) Merge of the DInSAR time series. Time is reported on a linear scale. (Source: base photo from © Google Maps.)
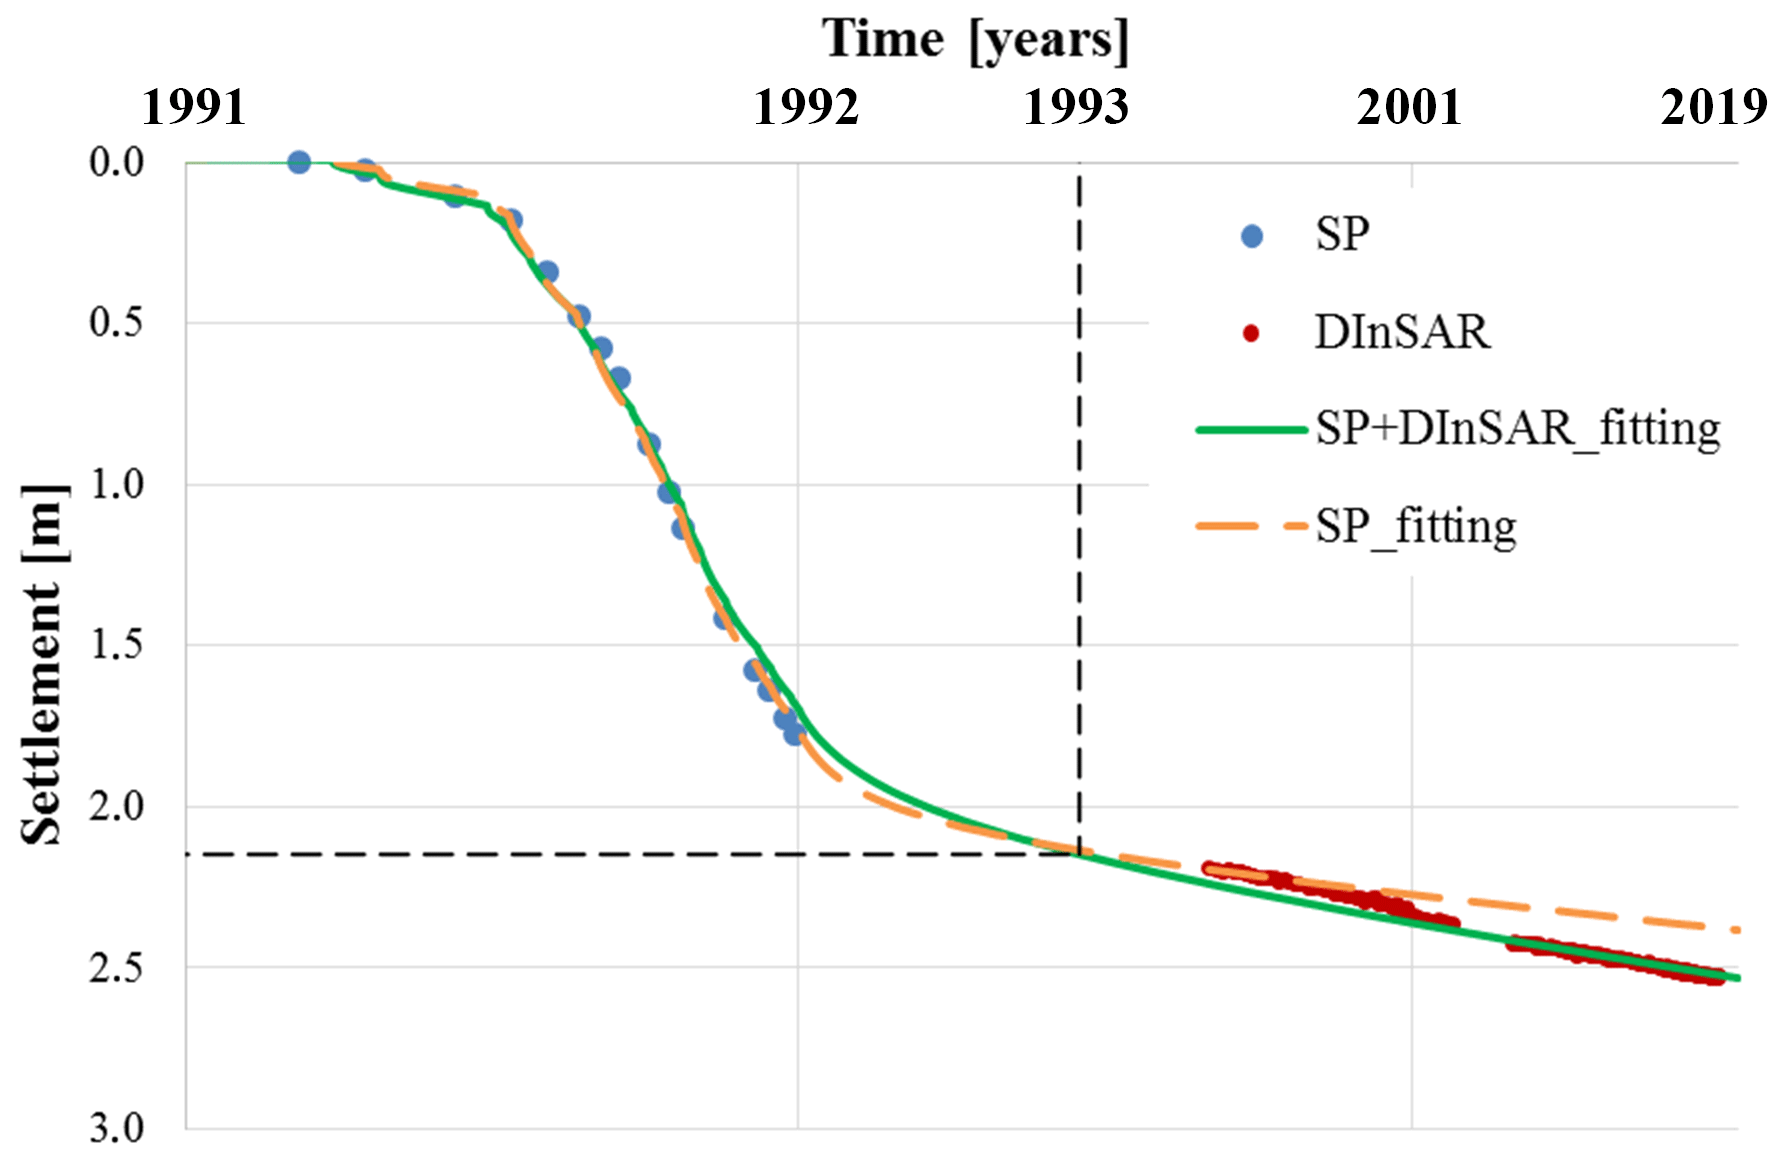
Figure 4Comparison between the fitting carried out only with SP and the fitting made also with DInSAR data. Time is reported on a logarithmic scale.
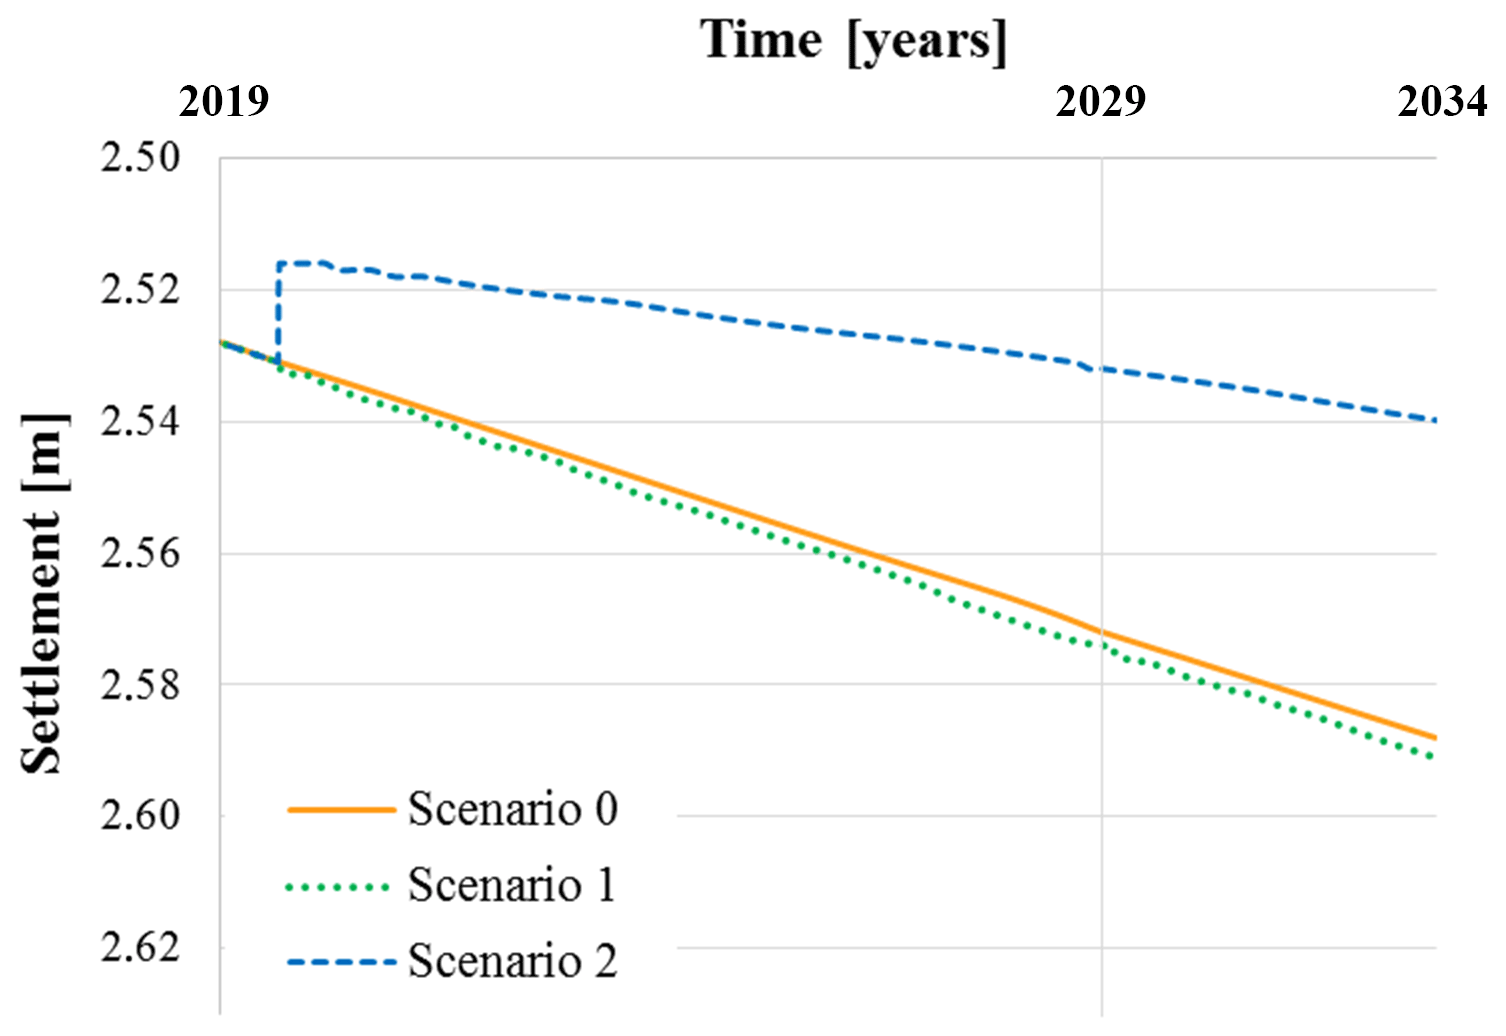
Table 2Fitting factors and soil parameters after the calibration of the model.

Table 3Predicted cumulative total settlements for different scenarios.
The “do nothing” scenario does not require maintenance work, thus it is not considered in this phase. Indeed, this scenario was defined just to understand what could happen if nothing changes on the infrastructure. Referring to scenario 1, re-profiling the pavement with a new porous asphalt only requires the milling of the old pavement and the substitution with a new one. Referring to the scenario 2, it is important to note that the replacement of the original fill with the EPS is complex and time-consuming. It is worth stressing that the Road Authority prescribes that “the post-construction differential settlement of the embankment below an approach slab shall not exceed the 1 % out of the length of the approach slab” (Beukema, 2016). For the specific case of a 5 m long approach slab, the allowable differential settlement equals 50 mm. This means that every time a differential settlement higher than 50 mm is recorded between the bridge and the approach embankment, maintenance works are required.
In the period from 2019 to 2034, the predictions for scenario 1 suggest a differential settlement equal to 59 mm (see Table 3), meaning that additional maintenance works are needed since the requirement imposed by the road manager will be exceeded. For scenario 2, instead, the predicted post-maintenance settlement is 24 mm.

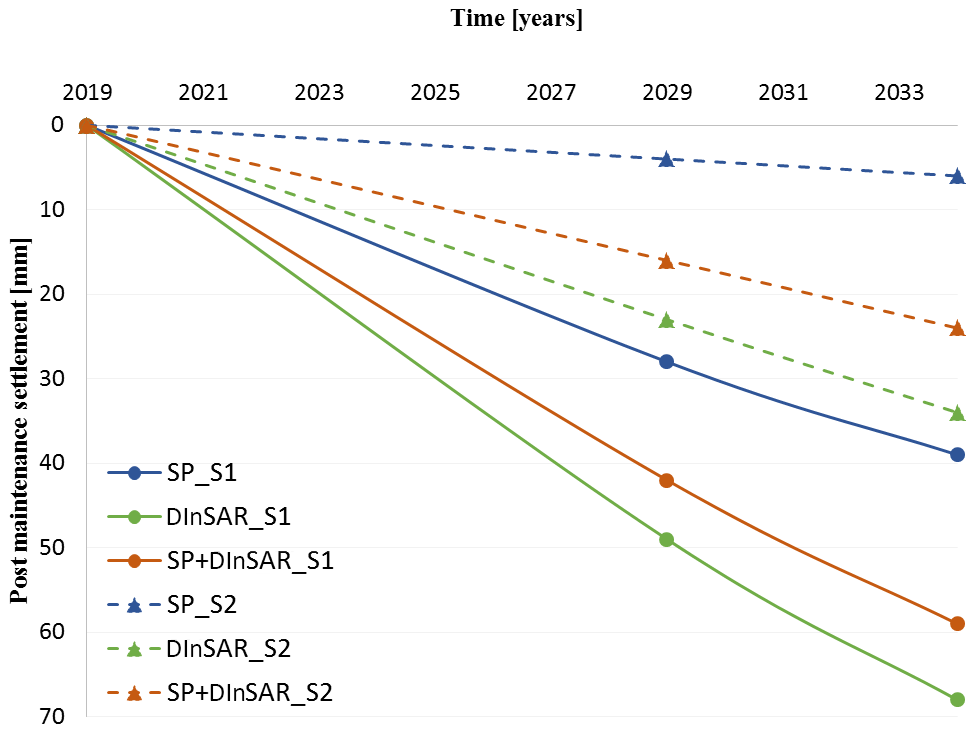
The availability of monitoring observations covering the entire lifecycle of an infrastructure, from the construction to nowadays, is almost a one-of-a-kind case. For the case study at hand, DInSAR data improved the reliability of the predictions performed by the model. Information added by this technique helped to better understand the performance of the embankment during the creep phase that is usually not monitored by the conventional systems. The drawback of DInSAR is the need of high resolution time-series coverage and long timespan. This aspect can be problematic since only recent very high-resolution sensors (e.g., TerraSAR-X, Cosmo-SkyMed) can ensure higher coverage and precision. Figure 6 shows the settlement time-history for different cases: the red curve when both conventional and DInSAR data are available (SP + DInSAR); the blue curve when only conventional monitoring is available (SP); and the green one when only DInSAR data are available (DInSAR).
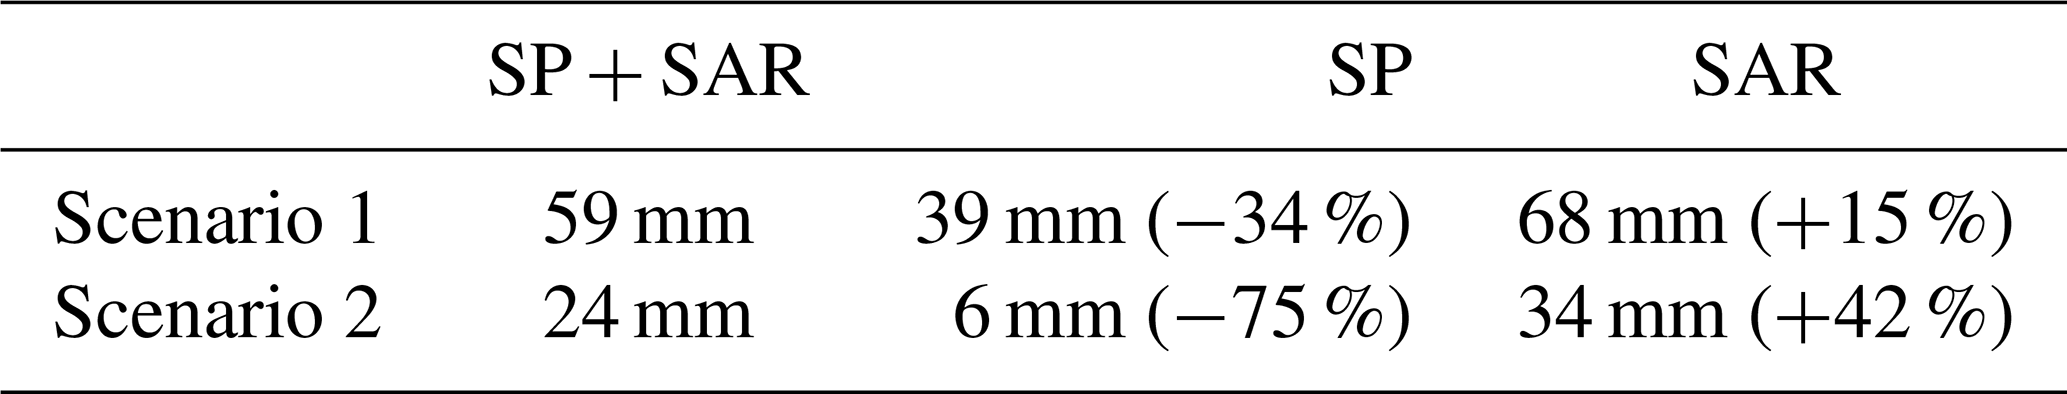
The calibration performed by using only settlement plates leads to the lowest creep settlement. Looking at the case of calibration carried out by exploiting only DInSAR data the creep trend is similar to the ideal case in terms of inclination of the secondary settlement curve. The post-maintenance settlement for scenarios 1 and 2 (S1 and S2) for the three calibration options are shown in Fig. 7. Table 4 summarises the total predicted settlements highlighting percentage differences from the SP + DInSAR case. It is worth noting that the significance of the underestimation (pertaining to SP) is always higher than of the overestimation (pertaining to DInSAR).
Table 4Predicted post-maintenance settlement for the three cases in the timespan 2019/2034.
The authors confirm that the data supporting the results of this study are available within the paper. The ownership of the raw data relating to DInSAR data used in this work belongs to SkyGeo Netherlands B.V. company.
All Authors contributed to this work by conceiving the idea, designing the methodology, performing the analyses that allowed to retrieve the presented results, writing and revising the paper.
The authors declare that they have no conflict of interest.
This article is part of the special issue “TISOLS: the Tenth International Symposium On Land Subsidence – living with subsidence”. It is a result of the Tenth International Symposium on Land Subsidence, Delft, the Netherlands, 17–21 May 2021.
SkyGeo company is gratefully acknowledged for providing DInSAR data.
This research has been supported by the ERASMUS+ programme within an agreement signed by Deltares, the University of Salerno and SkyGeo company.
Beukema, H.: Eisen onderbouw, Rijkswaterstaat, 2016.
den Haan, E. J.: A compression model for non-brittle soft clays and peat, Géotechnique, 46, 1–16, 1996.
Den Haan, E. J. and Kruse, G. A. M.: Characterisation and engineering properties of Dutch peats, in: Character, edited by: Tan, T. S., Phoon, K. K., Hight, D. W., and Leroueil, S., Eng. Prop. Nat. Soils, Taylor & Francis Group, London, 3, 2101–2133, 2006.
Dieteren, G. G. A., Hölscher, P., Pereboom, D., Siemerink, T., Venmans, A. A. M., and van Vliet, D.: Test site for robust 15 bridge approach constructions, report 1203822-004-GEO-0005, Deltares, 2011.
Ferretti, A., Prati, C., and Rocca, F.: Permanent scatterers in SAR interferometry, IEEE T. Geosci. Remote, 39, 8–20, https://doi.org/10.1109/36.898661, 2001.
Nicodemo, G., Peduto, D., Ferlisi, S., and Maccabiani, J.: Investigating building settlements via very high-resolution SAR sensors, in: Life-Cycle of Engineering Systems – Emphasis on Sustainable Civil Infrastructure, edited by: Bakker, J., Frangopol, D. M., and van Breugel, K., Taylor & Francis Group, London, 2256–2263, ISBN 978-1-138-02847-0, 2017.
Peduto, D., Huber, M., Speranza, G., van Ruijven, J., and Cascini, L.: DInSAR data assimilation for settlement prediction: case study of a railway embankment in The Netherlands, Can. Geotech. J., 54, 502–517, 2017.
Peduto, D., Elia, F., and Montuori, R.: Probabilistic analysis of settlement-induced damage to bridges in the city of Amsterdam (The Netherlands), Transport. Geotech., 14, 169–182, 2018.
Peduto, D., Korff, M., Nicodemo, G., Marchese, A., and Ferlisi, S.: Empirical fragility curves for settlement-affected buildings: analysis of different intensity parameters for seven hundred masonry buildings in The Netherlands, Soils Foundat., 59, 380–397, 2019.
Venmans, A. A. M. and Kwast, E.: Life cycle cost optimisation of bridge approach constructions in local and national roads in the Netherlands, in: Proc. 4th Int. Conf. on the use of Geofoam in Construction Applications, EPS2011, 5–8 June 2011, Lillestrøm, Norway, 2011.
Visschedijk, M. A. T., Trompille, V., Best, H., den Haan, E. J., Sellmeijer, J. B., and van Zantvoort, E.: D-settlement user manual, Embankment design and soil settlement prediction, Deltares, available at: https://content.oss.deltares.nl/delft3d/manuals /DSettlement_User_Manual.pdf (last access: 19 February 2020), 2016.