the Creative Commons Attribution 4.0 License.
the Creative Commons Attribution 4.0 License.
 | 01 Aug 2019
Contemporary suspended sediment yield of Caucasus mountains
Matthias Vanmaercke
Valentin Golosov
Processes linked to climate change and intensified anthropogenic pressure influence the environment, the hydrology and by extent the denudation processes in the Caucasus mountain belt. Quantitative assessments of sediment fluxes and their temporal evolution in this mountain region are required for various environmental and engineering purposes, including the planning and maintenance of water reservoirs and other structures. In this paper, we present a first analysis of the hitherto largest suspended sediment yield (SSY) database for the Caucasus region, comprising data from 198 catchments (> 4000 catchment-years of observations). We present an overview of the existing contemporary SSY data from gauging stations observations. Based on these data and different models, we propose preliminary maps of the spatial patterns of SSY and denudation rates in the Caucasus region.
- Article
(1767 KB) - Full-text XML
- BibTeX
- EndNote


Denudation rates in the mountains are controlled by both endogenic and exogenic factors. Endogenic factors include the degree of tectonic uplift and seismic activity and are typically considered to be the dominant driving force of denudation rates in tectonically active mountain ranges (e.g. Malamud et al., 2004; Montgomery and Brandon, 2002). Nonetheless, also exogenic factors play a crucial role. These include climatic conditions and vegetation cover (e.g. Syvitski and Milliman, 2007). They are especially key factors to understand temporal trends in sediment fluxes and denudation rates at contemporary time scales.
The Caucasus mountains are a highly tectonically and seismically active region, resulting most probably in high long-term denudation rates. At the same time, patterns and trends of climate and vegetation cover likely also exert significant control on suspended sediment yields (SSY, [t km−2 yr−1]) at annual to decadal timescales. Disentangling the role of tectonic and geomorphic controls SSY from the role of climate and land cover is a central challenge (e.g. Syvitski and Milliman, 2007; Vanmaercke et al., 2015). This is not only of fundamental scientific importance but also of great relevance from a catchment and water resources management perspective (e.g. for the construction and maintenance of water reservoirs). This challenge is especially pertinent in the light of ongoing climate change and increasing anthropogenic pressure (including land use/land cover changes).
A key obstacle in addressing this research challenge is the availability of sufficient and reliable SSY observations in order to statistically discern the relative importance of its different driving factors (e.g. Vanmaercke et al., 2011, 2015). Here we aim to help addressing this gap by quantitatively assessing the spatial patterns of contemporary SSY in the Caucasus region, based on a large dataset of gauging stations observations from mid the 1920 to 2015.
A large number of studies focussed on compiling and understanding patterns of SSY at regional to global scales. Several of these also consider (parts of) the Caucasus region (Dedkov and Moszherin, 1984, 1992; Jaoshvili, 2002; Milliman and Syvitski, 1992; Vanmaercke et al., 2011). We developed a comprehensive database of contemporary SSY observations for the Caucasus mountains by integrating these existing datasets and complementing them with hydrological observations at gauging stations in the Russian Federation (State Water Cadastre; https://gmvo.skniivh.ru/, last access: 19 June 2019) as well as SSY observations for specific catchments reported by individual studies (Abduev, 2015; Eyubova, 2015; Khmeleva et al., 2000; Magritskii, 2011).
Table 1SSY database overview (with outliers).
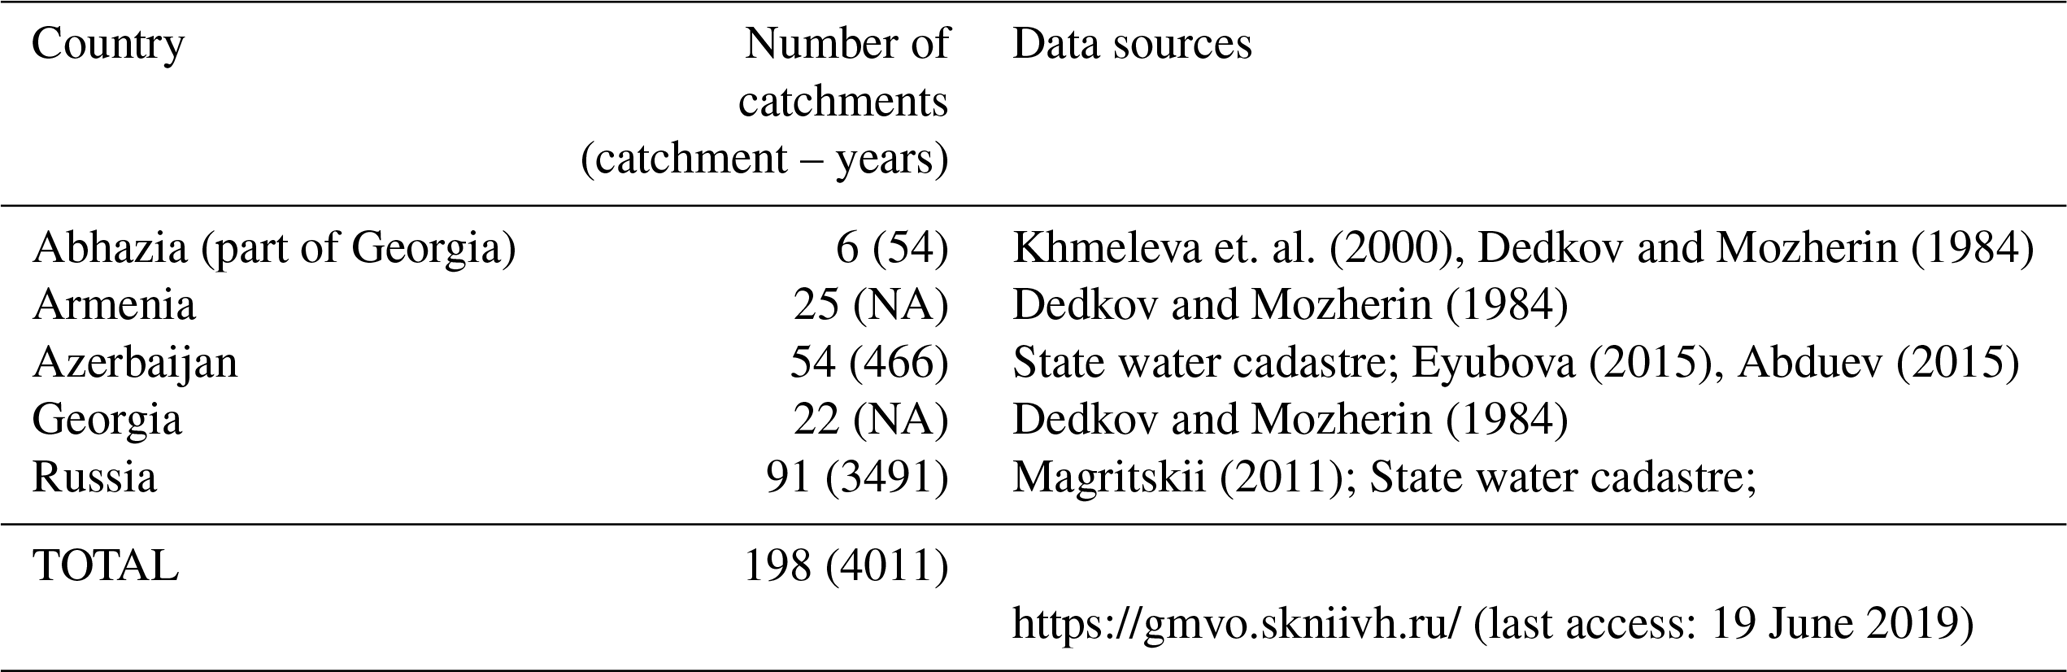
NA: not available.
Given that these observations were derived from different sources, also the reliability of the resulting SSY varies. This reliability depends on the measuring procedure and especially the sampling frequency (e.g. Moatar et al., 2006). However, also the length of the SSY observation periods is an essential factor. Vanmaercke et al. (2012) showed that uncertainties on average SSY values based on a short measuring period (1–5 years) due to inter-annual variations in sediment yield are typically at least as large as the uncertainty relating to the measuring period. Moreover, such average SSY values are relatively more likely to underestimate the actual average SSY (Vanmaercke et al., 2012). Given these concerns, we only considered catchment SSY values from direct gauging station (GS) observations with a measuring period (MP) of at least 10 years.
In total, our Caucasus database comprised SSY observations for 198 catchments. An overview of the data is given in Table 1, while the temporal coverage of the database is shown in Fig. 1. The sum of all MPs yields a total of 4011 catchment-years of observations. However, for several entries from Dedkov and Moszherin (1984) start and end date was unknown. We assumed a value of 10 years for such entries. With respect to catchment sizes, 17 GSs have a catchment area < 100 km2, 101 GSs have a catchment area between 100 and 1000 km2, 64 between 1000 and 10 000 km2, and 16 have a catchment area > 10 000 km2 (see Fig. 2).
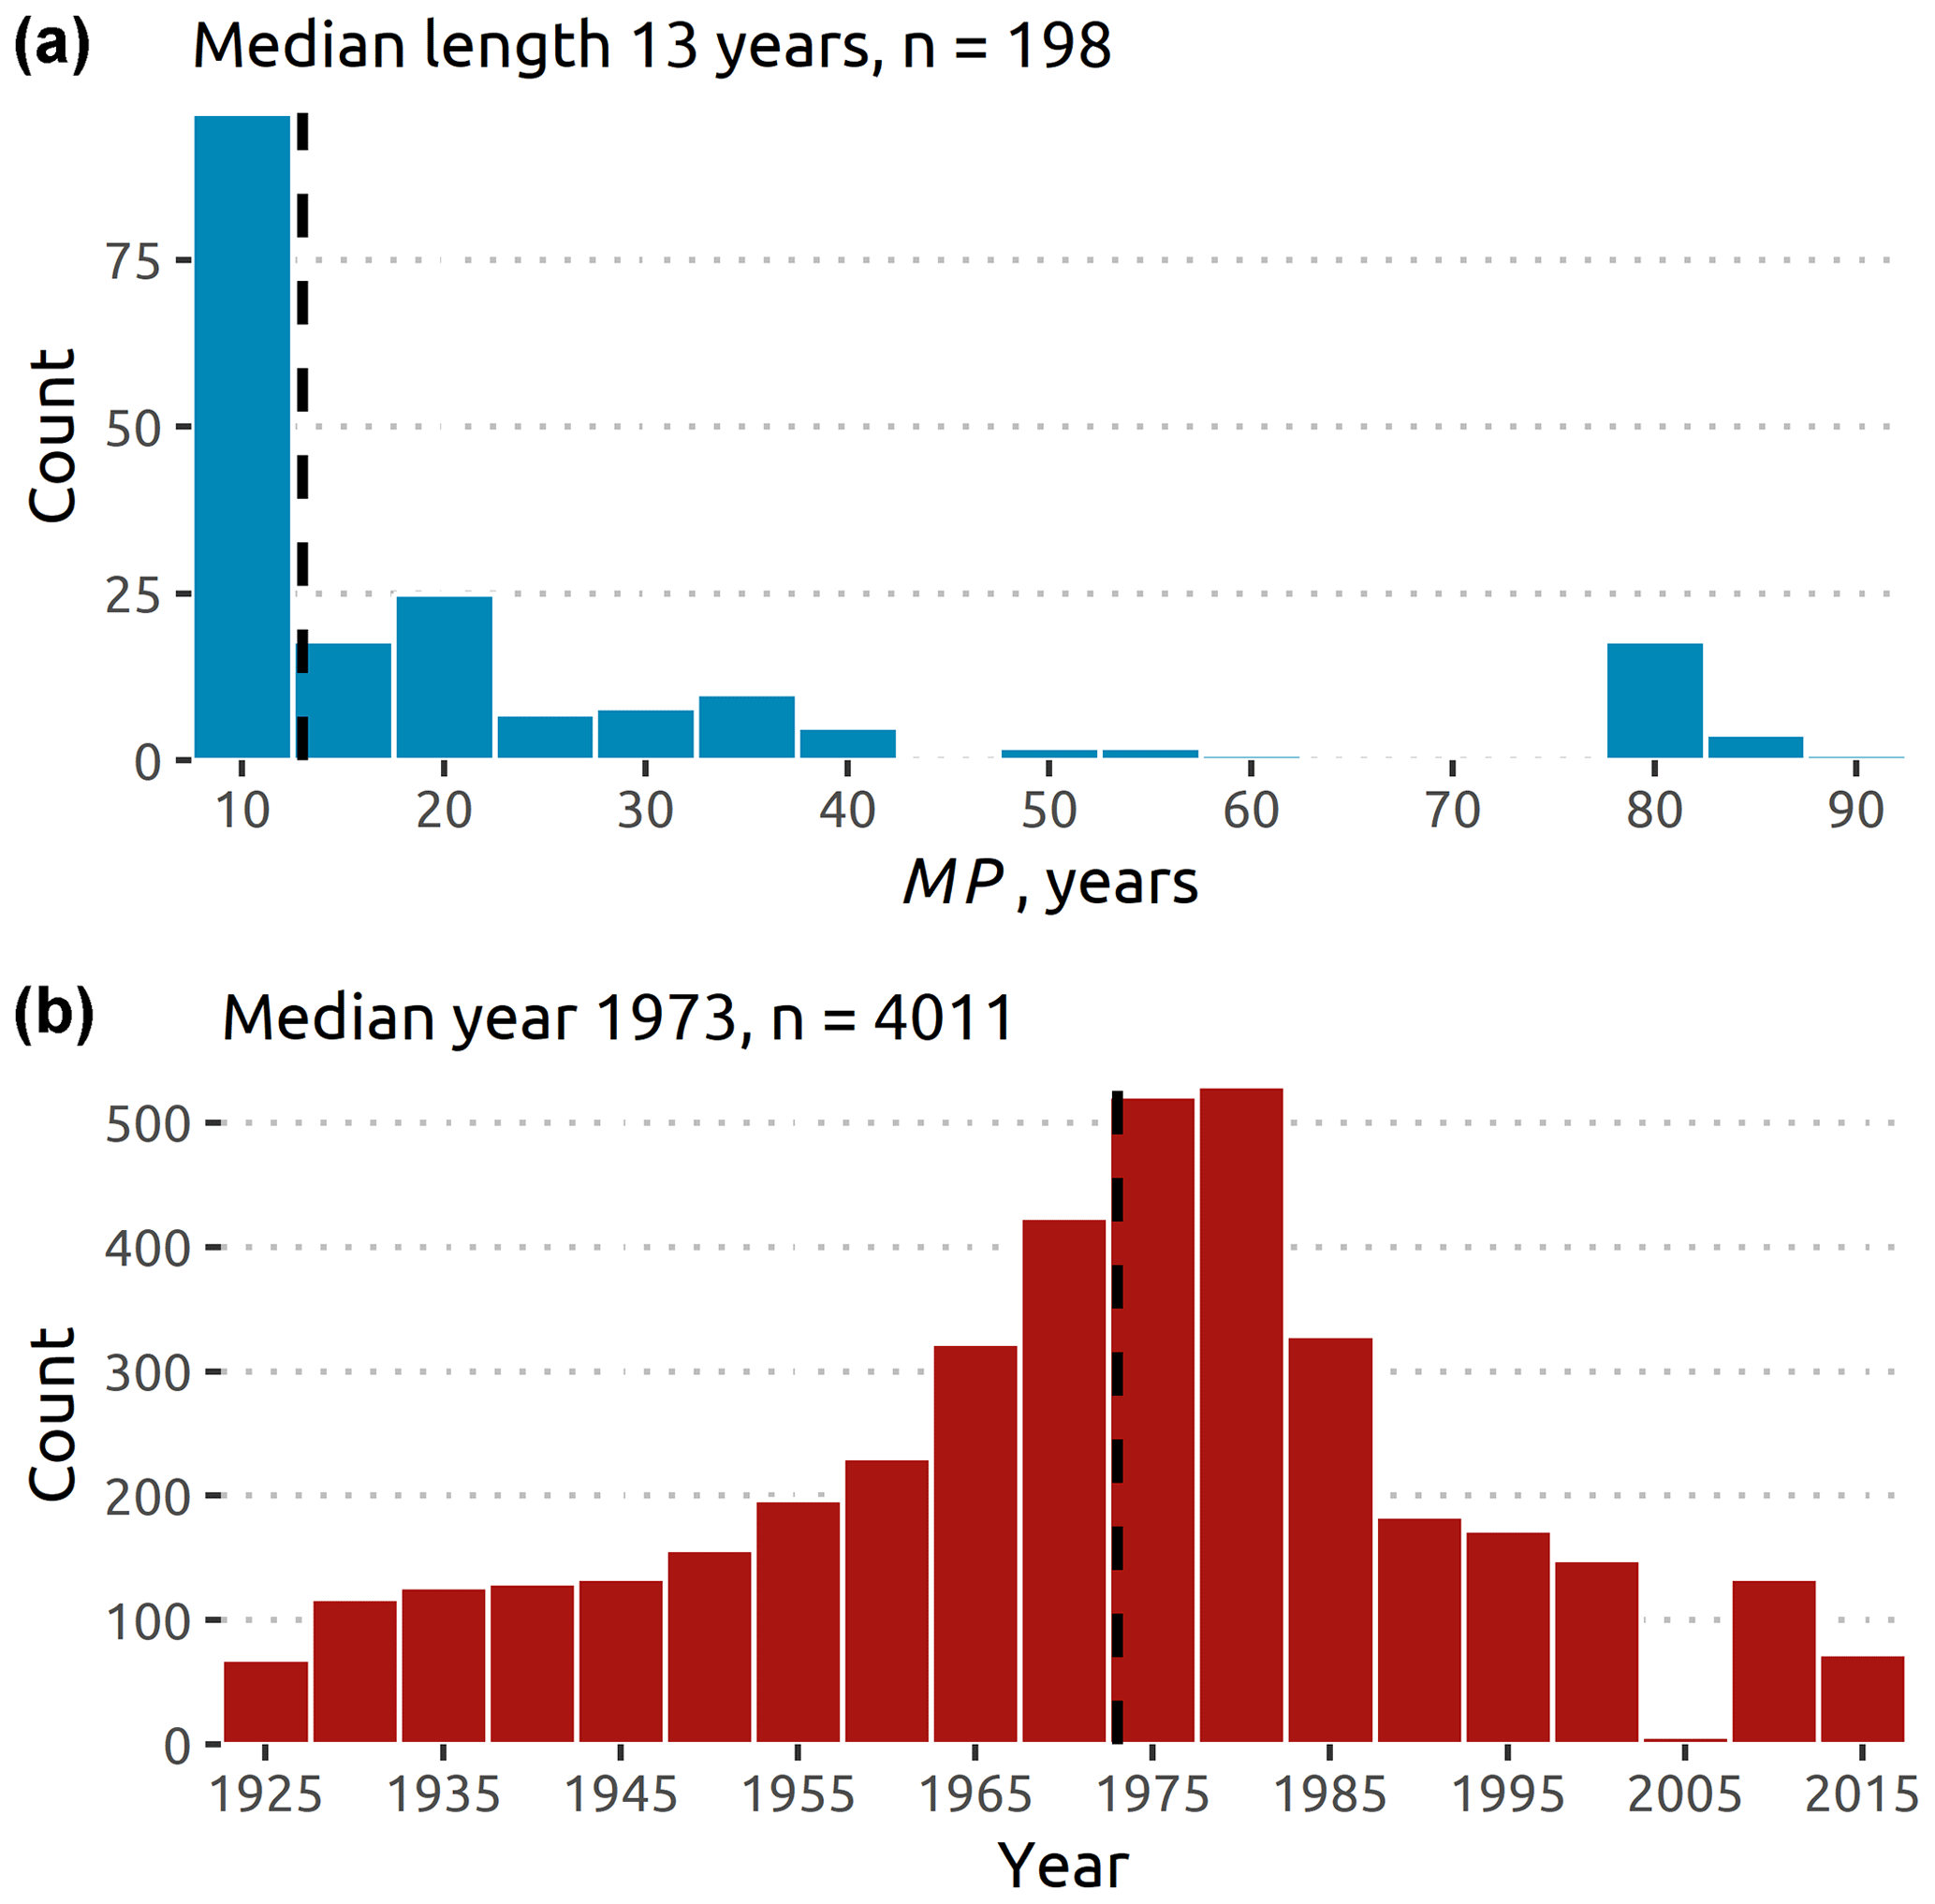
Figure 1Temporal coverage of the Caucasus SSY database. A: distribution of the measuring periods for which gauging station SSY observations are available. B: amount of catchment-year SSY data available per 5-year period.
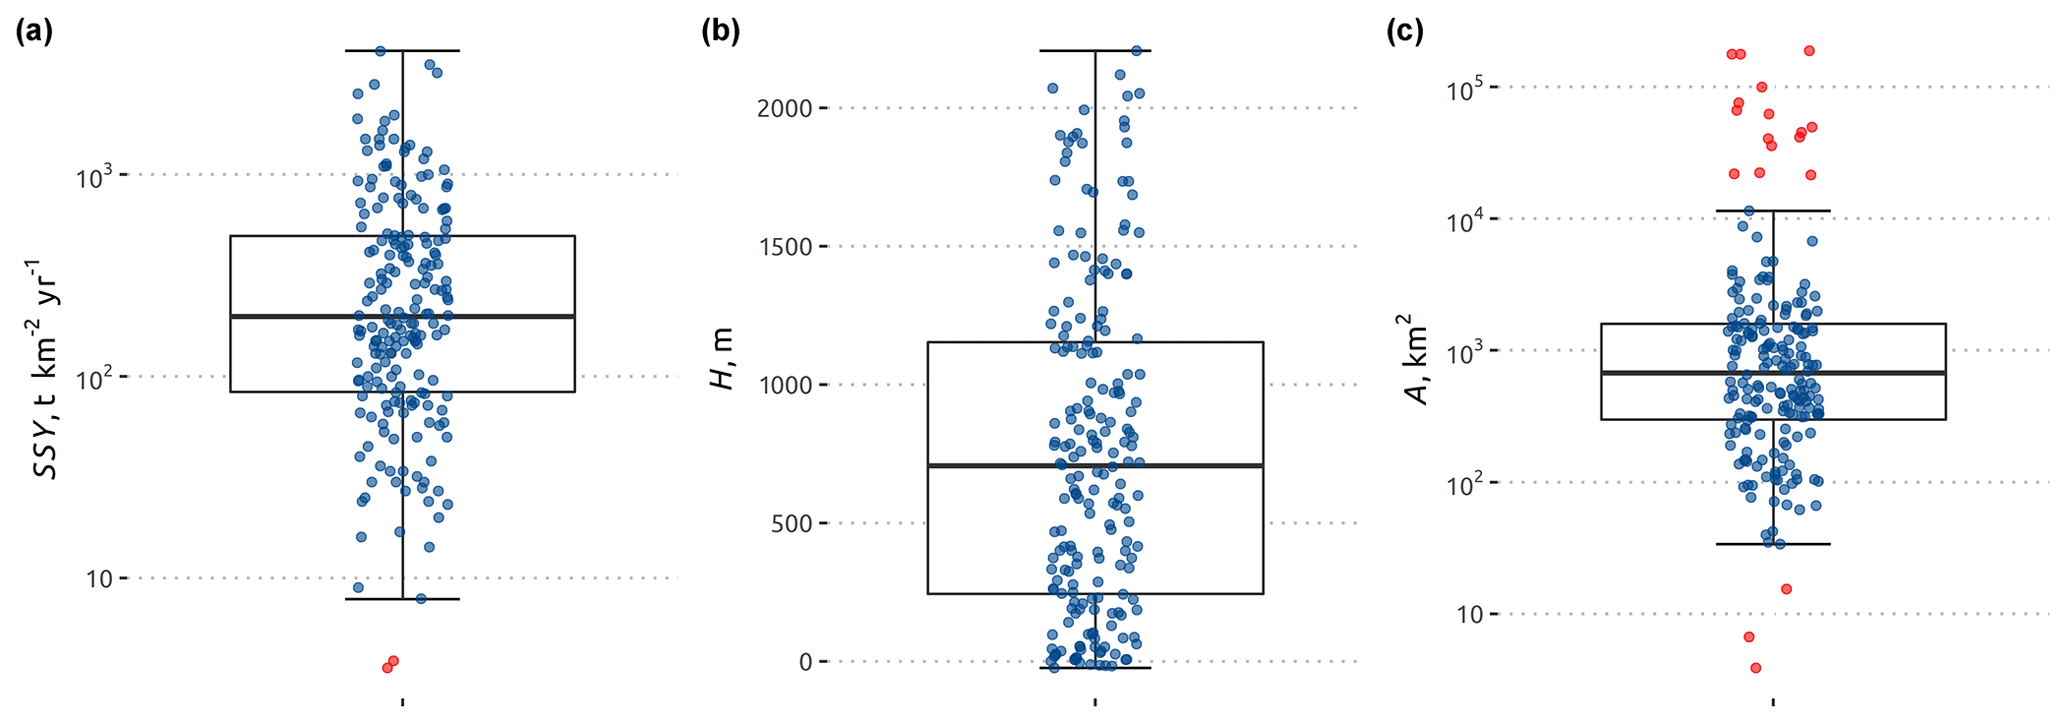
Figure 2Distribution of SSY observations in our database (a) and boxplots of elevations of the gauging stations (b) and their catchment areas (c).
Overall, SSY values ranged between 3.6 and 4100 t km−2 yr−1, with an average value of 442 t km−2 yr−1 and a median of 197 t km−2 yr−1. Two catchments in our database had an exceptionally low SSY value (respectively 3.6 and 3.9 t km−2 yr−1). These two catchments were located in the submontane zone of Azerbaijan and Armenia. Given that these SSY are clearly lower than what can be expected for this kind of environments (e.g. Vanmaercke et al., 2011) and the reliability of these observations could be questioned, these two observations were not considered for further analyses. According to a Shapiro-Wilks test, the SSY observations are log-normally distributed. All further analyses were therefore conducted on the log10 of the SSY.
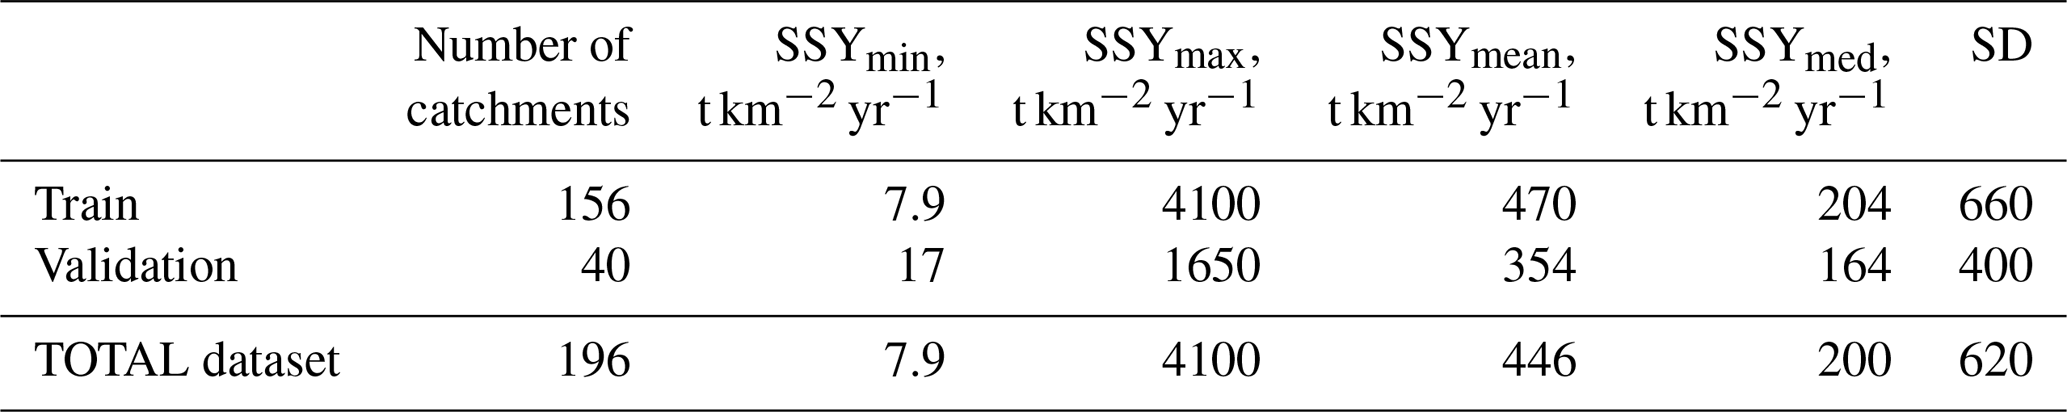
In order to visualize and better understand the patterns of SSY in the Caucasus, we used several methods to spatially interpolate log10 (SSY). These included Ordinary Kriging (OK), Co-Kriging with an elevation as a co-variable (CK-h) and Co-Kriging with a Mean Local Relief as a co-variable (CK-mlr), k-nearest neighbors (KNN) and k-nearest neighbors with a co-variable (KKN-h, KKN-mlr). OK, CK, CK-h and CK-mlr were performed with the R package automap (Hiemstra et al., 2009), KNN, KKN-h, and KKN-mlr with the R package kknn (Schliep and Hechenbichler, 2016). Elevation (H, [m]) and Mean Local Relief (MLR, [m]) were chosen as an auxiliary variables due to their expected correlation with SSY (Ahnert, 1970; Milliman and Syvitski, 1992; Montgomery and Brandon, 2002). Elevation data was accessed with the elevatr package (Hollister and Tarak Shah, 2017) in R. MLR was calculated as a difference between maximum and minimum H within a 10 km buffer as it was suggested by Montgomery and Brandon (2002). We randomly split our database into two datasets: one for training and one for validation (Table 2).
Table 2Ranges and characteristics of the observed suspended sediment yields and the generated training and validation datasets (without outliers).
The performance of these interpolations was assessed based on the root mean square error (RMSE), the mean error (ME), the Nash–Sutcliffe efficiency (NSE; (Nash and Sutcliffe, 1970), the coefficient of determination (R2) and Spearman's coefficient of correlation (r).
To assess the total sediment load of the Caucasus, the sediment export of a catchment (SSL, t km−2 yr−1) was calculated as:
with: A – the catchment area [km2]. If there were several GS at one river we considered the most downstream station (with the largest catchment area) for calculating SSL. For the ungauged basins we made estimate based on our interpolation. We calculate an average SSY for every ungauged basin draining to the exit of our study area and multiply this with the size of the basin in order to have an estimate of the SSL. To define basin borders for the ungauged watersheds we used HydroBasins level 5 (Lehner and Grill, 2013).
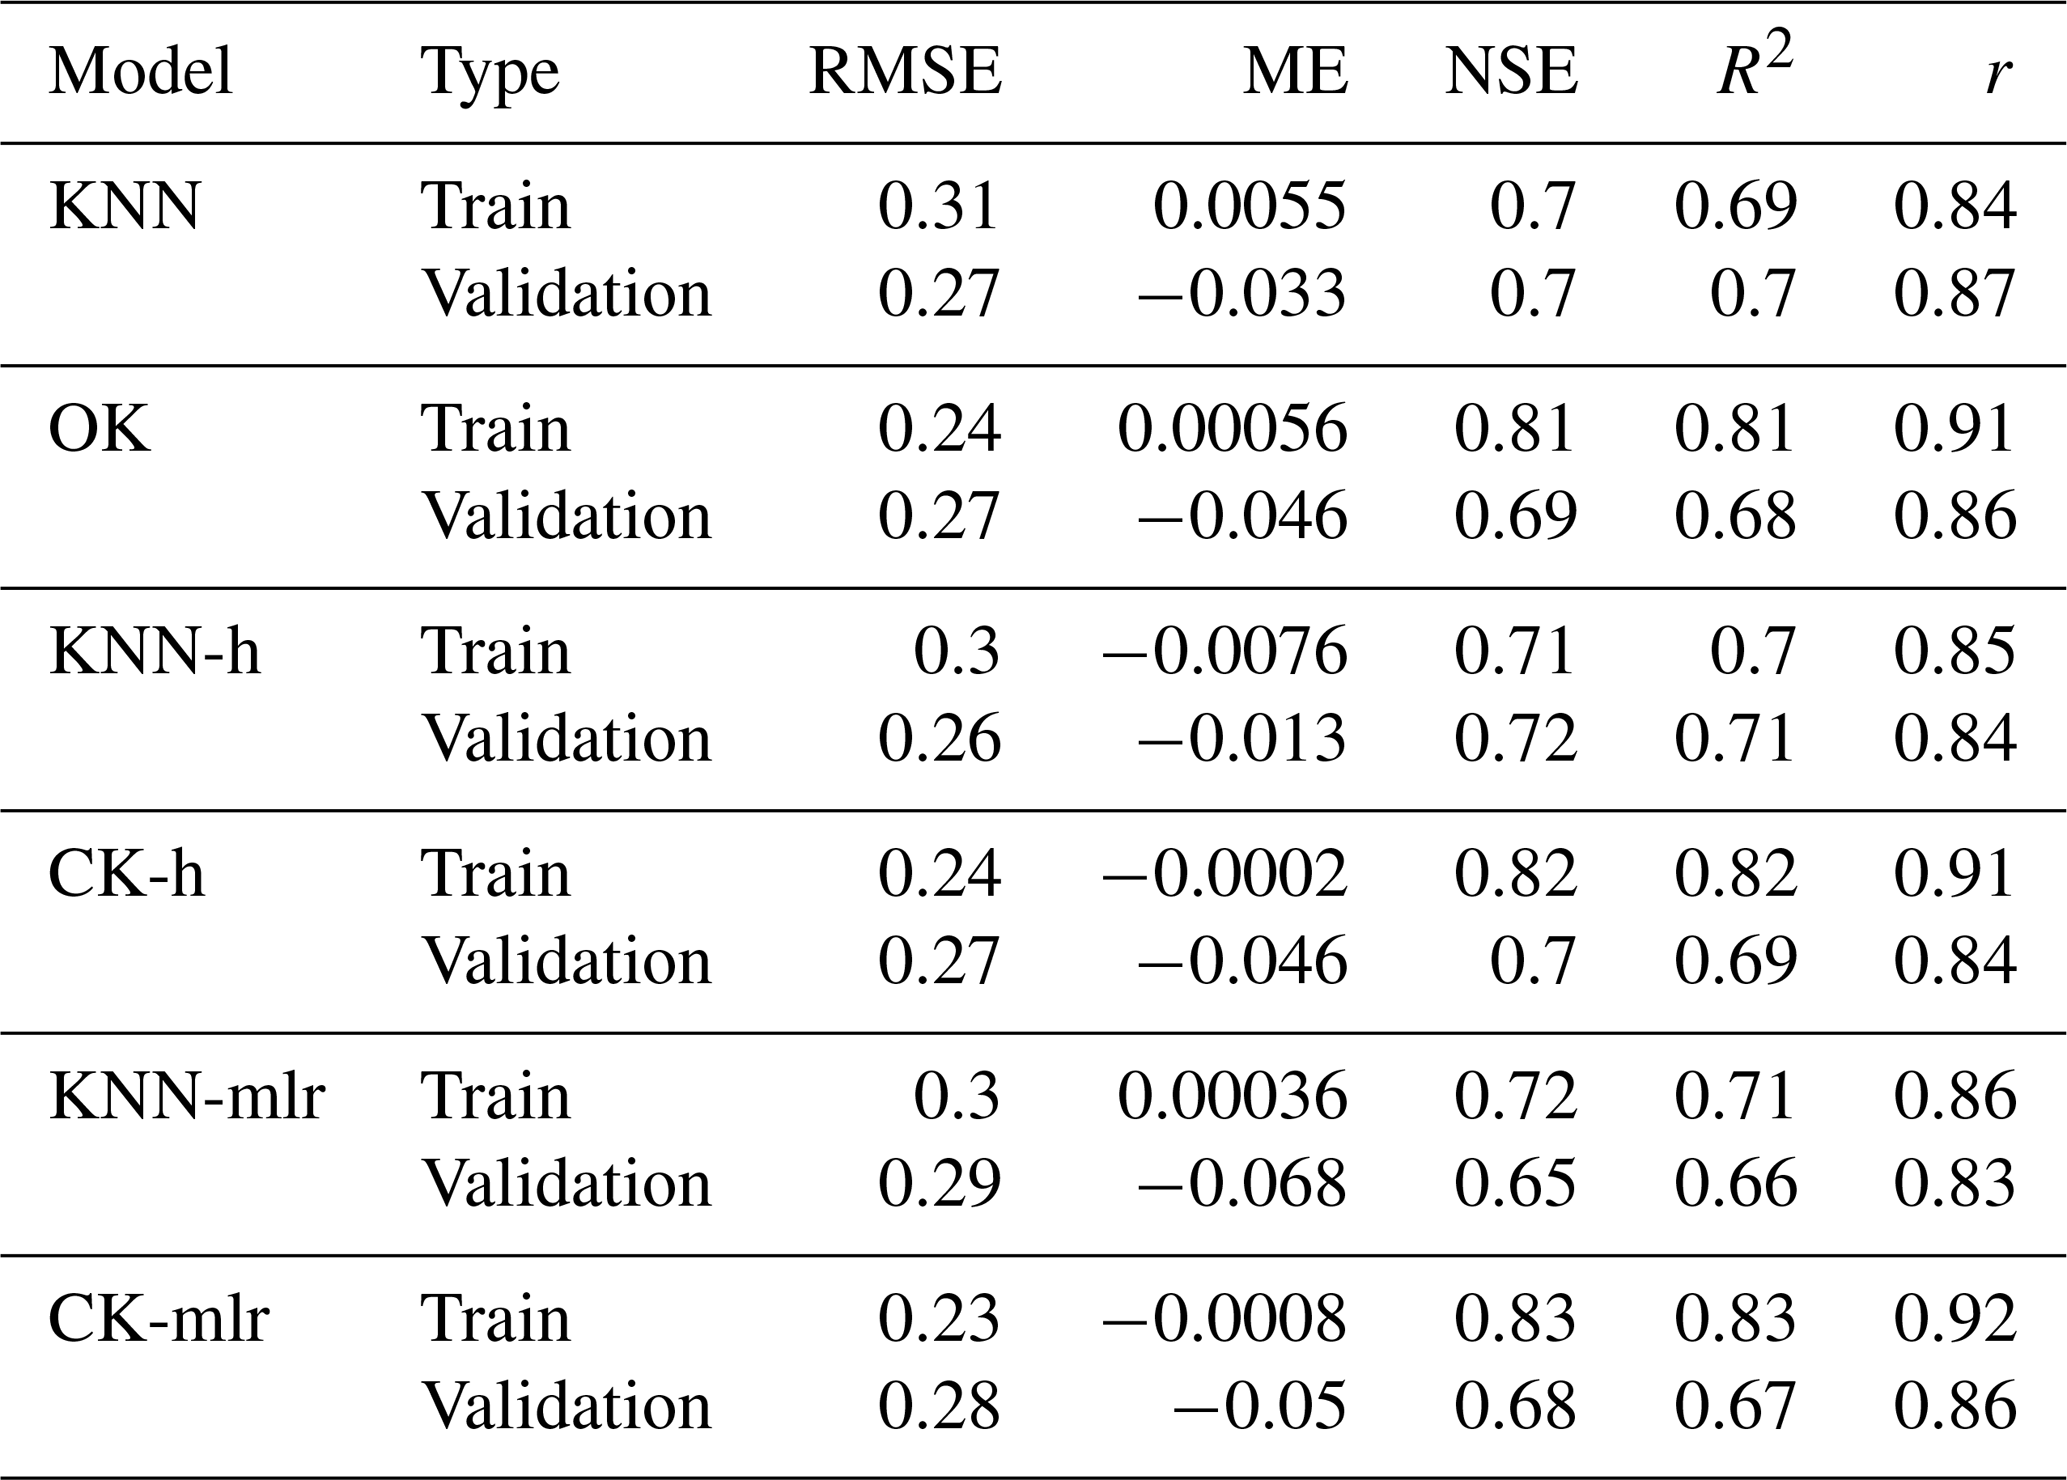
The results of the six interpolation methods (OK, CK-h, CK-mlr, KNN, KNN-h, KNN-mlr) are shown in Table 3. Overall, these results show that observed SSY values are strongly spatially correlated. As such, about 70 % of the observed spatial variation in SSY can be estimated based on a spatial extrapolation of observations from other GS. This is shown by both the KNN and OK approach. Adding the considered co-variable (elevation or Mean Local Relief) slightly improves the prediction quality, but also significantly changes the simulated spatial pattern of SSY. The CK approach shows the best training results in terms of NSE, R2 and r values but clearly performs worse in terms of validation. The KNN-h approach shows the smallest difference between training and validation metrics: both NSE and R2 are above average. Moreover, KNN-h has the best results for validation. We, therefore, considered KNN-h as the optimal approach to assess the spatial variation of SSY in the Caucasus region. Figure 3 illustrates the simulated spatial distribution of SSY and elevation.
Table 3Performance measures of the different tested interpolation methods (see text for further details).
Overall, mean SSY values are higher in the northern part of the Caucasus (504 t km−2 yr−1) are higher than for the southern part (396 t km−2 yr−1). The difference is significant and not related to differences in altitude (Fig. 3). Furthermore, SSY values are very low (< 50 t km−2 yr−1) in most of Armenia and Azerbaijan, especially in the highland steppic zone. On the other hand, the highest values of SSY (> 1000 t km−2 yr−1) are observed in the Dagestan steppes (eastern part of the Caucasus). Furthermore, SSY values are significantly higher in the high mountain belt of the central part of Caucasus. This is likely due to the presence of glaciers and the sparse vegetated cover in these headwater catchments.
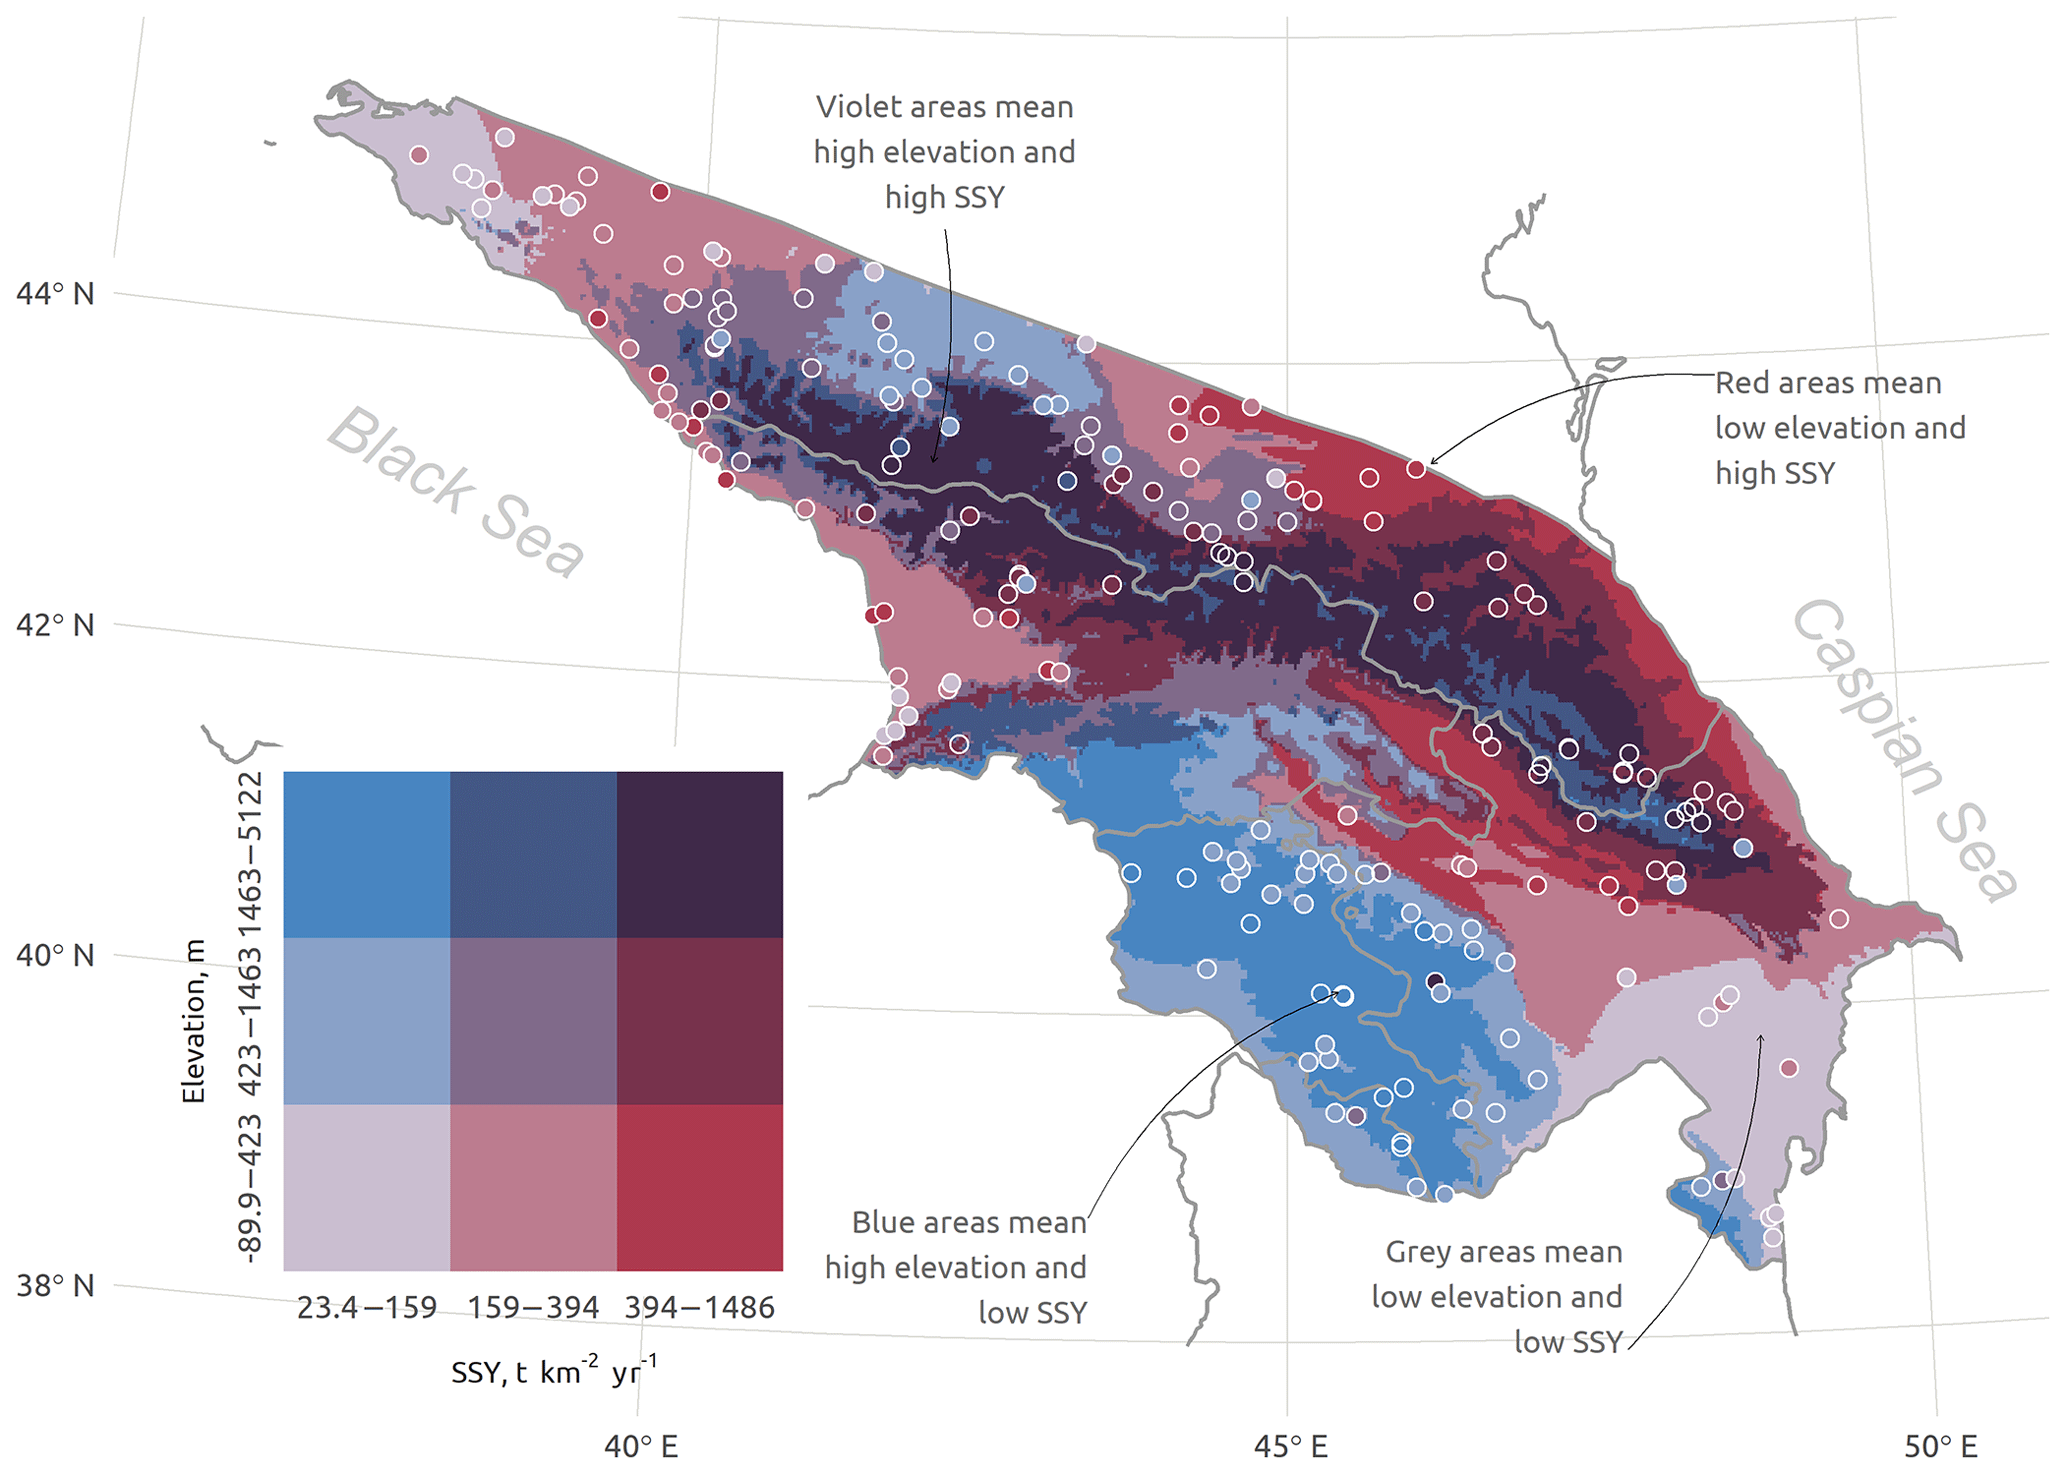
Figure 3Elevation (H, m a.s.l.) and average annual Suspended Sediment Yields (SSY, t km−2 yr−1) as estimated based on our SSY database.
We estimated that the total measured suspended sediment load (SSL) from rivers draining the Caucasus Mountains is about 98 Mt yr−1. This value is based on direct measurements from 196 GS, which covers 61 % of the total area of the study area. SSL of the ungauged part of the Caucasus is 50 Mt yr−1 (based on the KNN-h interpolation).
The SSY database presented in this article is the hitherto largest in its kind. Overall, SSY estimates for Caucasus rivers remain relatively scarcely reported in scientific literature. Overall, the average SSY of our database (446 t km−2 yr−1) corresponds very well to the average SSY reported for catchments in Alpine zones in Europe (451 t km−2 yr−1; Vanmaercke et al., 2011).
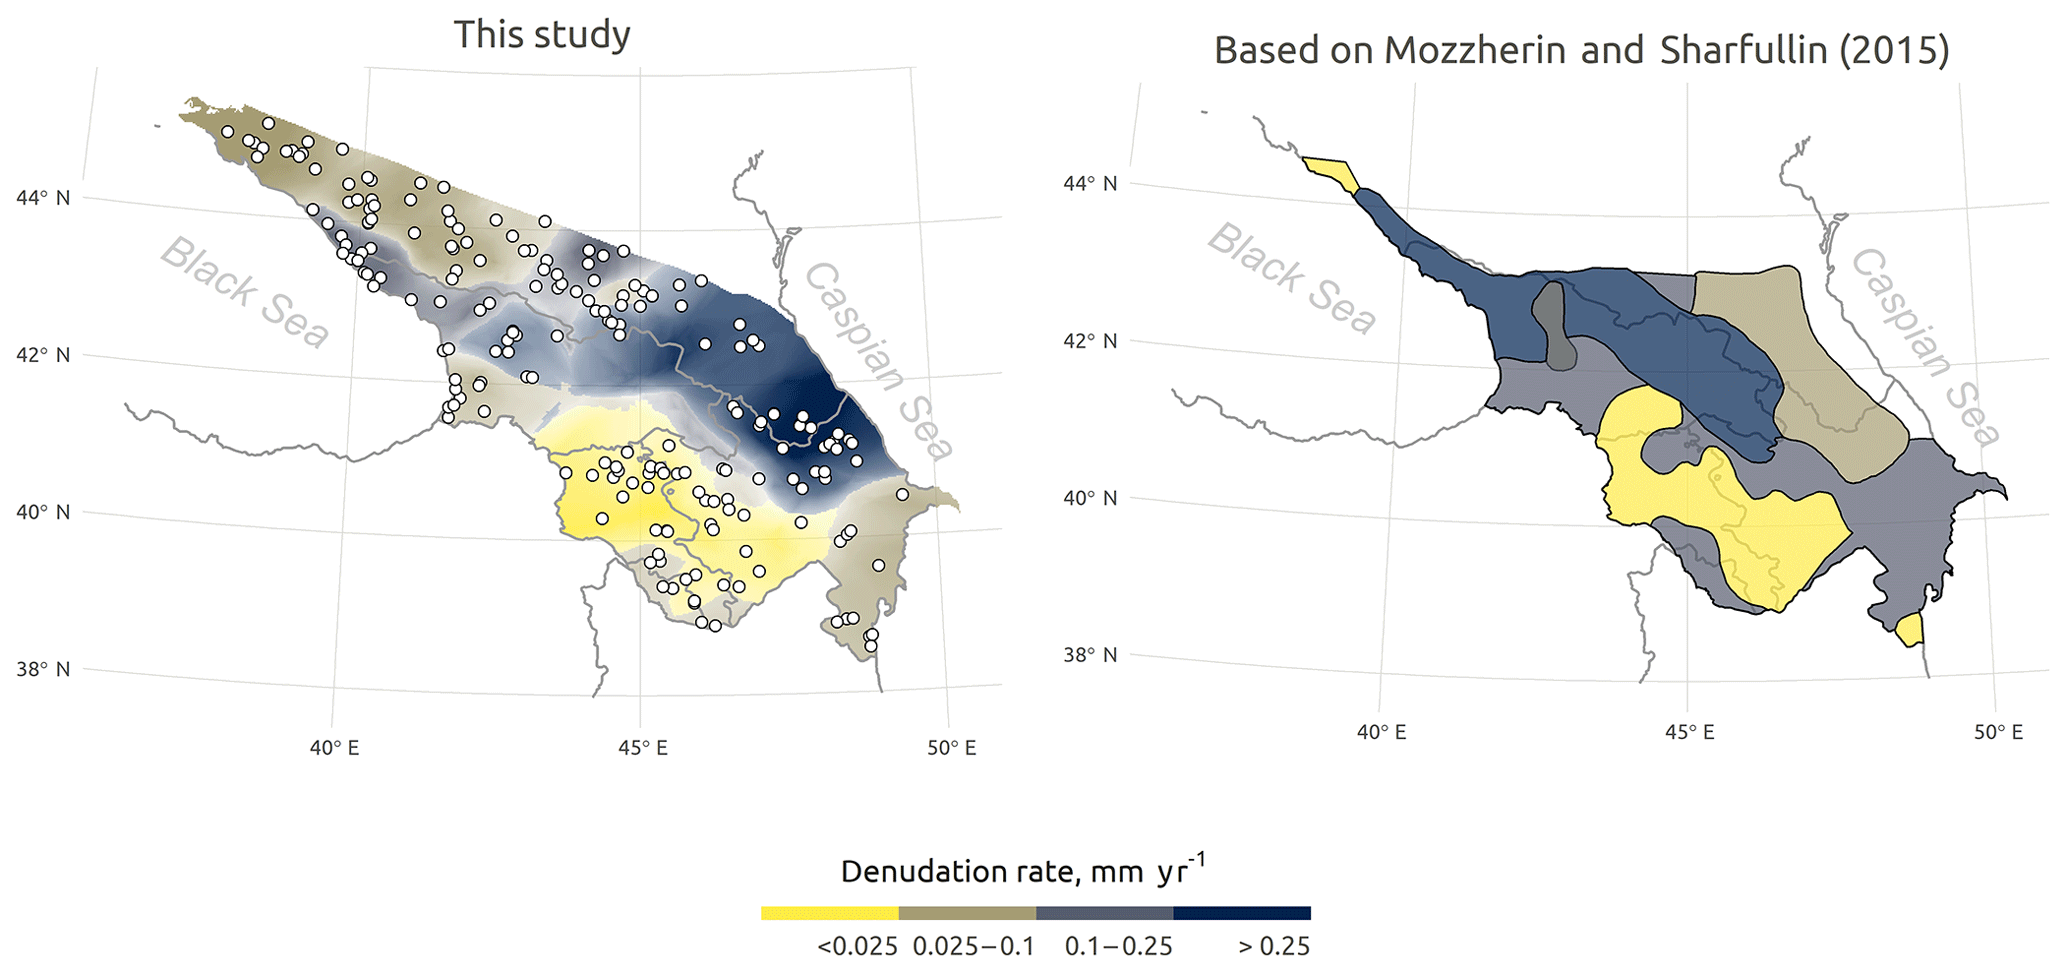
Figure 4Spatial patterns of estimated average denudation rates for the Caucasus (mm yr−1) and comparison with the estimates of Mozzherin and Sharifullin (2015).
We also compared our findings with earlier estimates of denudation rates in the Caucasus. One of the first assessment was made by Gabrielyan (1971), who reported a mean annual denudation rate of Caucasus of 0.2 mm yr−1. Mozzherin and Sharifullin (2015) estimated that mean annual denudation rates in the Caucasus range between 0.005 and 2.32 mm yr−1. They calculated denudation rates (hc, [mm yr−1]) using the following formula:
To compare the results of our database with these previous findings, we converted our SSY values to hc using the same equation. As such, the mean denudation rate for the Caucasus region based on our database is 0.17 mm yr−1 with a maximum hc of 1.55 mm yr−1. As indicated by Fig. 4, the spatial patterns of our database correspond relatively well with those estimated by Mozzherin and Sharifullin (2015). The main difference between their and our estimates occurs in the center of the Caucasus (Georgia). The density of GS is scarce in this region and, as such uncertainties are especially important in this part of the study area. Areas having a relatively low denudation rate (e.g. hc < 0.1 mm yr−1) agree well for both approaches. However, areas with a high hc (> 0.25 mm yr−1) occupy 31 % of the study region according to our assessment and only 18 % according to (Mozzherin and Sharifullin, 2015). These differences are likely attributable to different measuring periods, differences in interpolation methods, as well as the larger amount of observations used in our study. As such, we believe that our assessment provides a refinement of the earlier estimated spatial patterns of SSY for the Caucasus region. Nonetheless, further improvement remains possible. As a next step, we aim to include additional relevant variables (e.g. relating to land cover, climatic conditions, lithology and soil characteristics, topography, tectonics and seismicity) in our assessment of SSY. This may not only improve our understanding of spatial and temporal patterns of SSY but will also help in disentangling the relative importance of endogenic and exogenic drivers of catchment-wide denudation.
In this paper, we presented the hitherto largest SSY database for the Caucasus region as well as some first explorative analyses of the spatial patterns of SSY. We found that Caucasus SSY values are similar in range and average to those of catchments in European alpine climatic zones. Observed SSY values are strongly correlated in space, allowing a reasonable assessment of spatial patterns of SSY based on a geographical interpolation of GS observations. Adding information on elevation further improved the accuracy of our simulations. This methodological approach in combination with the hitherto largest SSY dataset allowed to make an updated assessment of spatial patterns of SSY in the Caucasus (Fig. 3).
Reproducible R code is available at the GitHub repository (https://github.com/atsyplenkov/caucasus-sediment-yield) (Tsyplenkov et al., 2019). Contact Anatoly Tsyplenkov (atsyplenkov@gmail.com) for more information.
VG, AT conceived and designed the research; AT performed the experiments and analyzed the data; AT, VG and MV wrote and edited the manuscript.
The authors declare that they have no conflict of interest.
This article is part of the special issue “Land use and climate change impacts on erosion and sediment transport”. It is a result of the ICCE Symposium 2018 – Climate Change Impacts on Sediment Dynamics: Measurement, Modelling and Management, Moscow, Russia, 27–31 August 2018.
This study contributes to the State Task no. 0148-2019-0005, Institute of Geography RAS. The authors wish to thank Oleg P. Yermolaev for sharing an electronic version of the Dedkov and Moszherin, 1984 database.
The work (analysis and results) was supported by the Russian Science Foundation (project number 19-17-00181).
Abduev, M. A.: Amending the runoff suspended sediment and turbidity of the mountain rivers of Azerbaijan under the influence of economic activity, Geogr. Bull., 32, 29–37, 2015.
Ahnert, F.: Functional relationships between denudation, relief, and uplift in large, mid-latitude drainage basins, Am. J. Sci., 268, 243–263, https://doi.org/10.2475/ajs.268.3.243, 1970.
Dedkov, A. P. and Moszherin, V. I.: Erosion and Sediment Runoff on the Earth, Kazan: Izd-vo Kazansk. un-ta., 264 pp., 1984.
Dedkov, A. P. and Moszherin, V. I.: Erosion and sediment yield in mountain regions of the world, Eros. Debris Flows Environ. Mt. Reg., 209, 29–36, available at: http://iahs.info/redbooks/a209/iahs_209_0029.pdf (last access: 19 June 2019), 1992.
Eyubova, F. A.: The investigation of long-term changes of hydrological regime and of runoff of suspended loads of the rivers of north-eastern slope of greater caucasus (within of Azerbaijan republic), Geogr. Bull., 2, 32–38, 2015.
Gabrielyan, G. K.: The intensity of denudation in the caucasus, Geomorphol. RAS, 1, 22–27, 1971.
Hiemstra, P. H., Pebesma, E. J., Twenhöfel, C. J. W., and Heuvelink, G. B. M.: Real-time automatic interpolation of ambient gamma dose rates from the Dutch radioactivity monitoring network, Comput. Geosci., 35, 1711–1721, https://doi.org/10.1016/j.cageo.2008.10.011, 2009.
Hollister, J. and Tarak Shah: elevatr: Access Elevation Data from Various APIs, available at: http://github.com/usepa/elevatr (last access: 19 June 2019), 2017.
Jaoshvili, S.: The rivers of the Black Sea, EEA Tech. Rep., 71, 58 pp., 2002.
Khmeleva, N. V., Vinogradova, N. N., Samoilova, A. A., and Shevchenko, B. F.: Mountain river basin and exogenous processes within it, edited by: Chalov, R. S., LMSU Faculty of Geography, Moscow, 186 pp., 2000.
Lehner, B. and Grill, G.: Global river hydrography and network routing: baseline data and new approaches to study the world's large river systems, Hydrol. Process., 27, 2171–2186, https://doi.org/10.1002/hyp.9740, 2013.
Magritskii, D. V.: Variations in sediment runoff in the lower reaches and the delta of the Kuban River in the XX–XXI centuries, Water Resour., 38, 709–719, https://doi.org/10.1134/S0097807811060108, 2011.
Malamud, B. D., Turcotte, D. L., Guzzetti, F., and Reichenbach, P.: Landslides, earthquakes, and erosion, Earth Planet. Sc. Lett., 229, 45–59, https://doi.org/10.1016/j.epsl.2004.10.018, 2004.
Milliman, J. D. and Syvitski, J. P. M.: Geomorphic/Tectonic Control of Sediment Discharge to the Ocean: The Importance of Small Mountainous Rivers, J. Geol., 100, 525–544, https://doi.org/10.1086/629606, 1992.
Moatar, F., Person, G., Meybeck, M., Coynel, A., Etcheber, H., and Crouzet, P.: The influence of contrasting suspended particulate matter transport regimes on the bias and precision of flux estimates, Sci. Total Environ., 370, 515–531, https://doi.org/10.1016/j.scitotenv.2006.07.029, 2006.
Montgomery, D. R. and Brandon, M. T.: Topographic controls on erosion rates in tectonically active mountain ranges, Earth Planet. Sc. Lett., 201, 481–489, https://doi.org/10.1016/S0012-821X(02)00725-2, 2002.
Mozzherin, V. V. and Sharifullin, A. G.: Estimation of current denudation rate of the mountains based on the suspended sediment runoff of the rivers (the Tien Shan, the Pamir-Alai, the Caucasus, and the Alps as an example), Geomorphol. RAS, 1, 15–23, https://doi.org/10.15356/0435-4281-2014-1-15-23, 2015.
Nash, J. E. and Sutcliffe, J. V.: River flow forecasting through conceptual models part I – A discussion of principles, J. Hydrol., 10, 282–290, https://doi.org/10.1016/0022-1694(70)90255-6, 1970.
Schliep, K. and Hechenbichler, K.: kknn: Weighted k-Nearest Neighbors, available at: https://cran.r-project.org/package=kknn (last access: 19 June 2019), 2016.
Syvitski, J. P. M. and Milliman, J. D.: Geology, geography, and humans battle for dominance over the delivery of fluvial sediment to the coastal ocean, J. Geol., 115, 1–19, 2007.
Tsyplenkov, A., Vanmaercke, M., and Golosov, V.: Caucasus-sediment-yield, available at: https://github.com/atsyplenkov/caucasus-sediment-yield (last access: 19 June 2019), 2019.
Vanmaercke, M., Poesen, J., Verstraeten, G., de Vente, J., and Ocakoglu, F.: Sediment yield in Europe: Spatial patterns and scale dependency, Geomorphology, 130, 142–161, https://doi.org/10.1016/j.geomorph.2011.03.010, 2011.
Vanmaercke, M., Poesen, J., Radoane, M., Govers, G., Ocakoglu, F., and Arabkhedri, M.: How long should we measure? An exploration of factors controlling the inter-annual variation of catchment sediment yield, J. Soils Sediment., 12, 603–619, https://doi.org/10.1007/s11368-012-0475-3, 2012.
Vanmaercke, M., Poesen, J., Govers, G., and Verstraeten, G.: Quantifying human impacts on catchment sediment yield: A continental approach, Glob. Planet. Change, 130, 22–36, https://doi.org/10.1016/j.gloplacha.2015.04.001, 2015.