the Creative Commons Attribution 4.0 License.
the Creative Commons Attribution 4.0 License.
 | 05 Jun 2018
Response of streamflow to climate change in a sub-basin of the source region of the Yellow River based on a tank model
Sihai Liang
Though extensive researches were conducted in the source region of the Yellow River (SRYR) to analyse climate change influence on streamflow, however, few researches concentrate on streamflow of the sub-basin above the Huangheyan station in the SRYR (HSRYR) where a water retaining dam was built in the outlet in 1999. To improve the reservoir regulation strategies, this study analysed streamflow change of the HSRYR in a mesoscale. A tank model (TM) was proposed and calibrated with monthly observation streamflow from 1991 to 1998. In the validation period, though there is a simulation deviation during the water storage and power generation period, simulated streamflow agrees favourably with observation data from 2008 to 2013. The model was further validated by two inside lakes area obtained from Landsat 5, 7, 8 datasets from 2000 to 2014, and significant correlations were found between the simulated lake outlet runoff and respective lake area. Then 21 Global Climate Models (GCM) ensembled data of three emission scenarios (SRA2, SRA1B and SRB1) were downscaled and used as input to the TM to simulate the runoff change of three benchmark periods 2011–2030 (2020s), 2046–2065 (2050s), 2080–2099 (2090s), respectively. Though temperature increase dramatically, these projected results similarly indicated that streamflow shows an increase trend in the long term. Runoff increase is mainly caused by increasing precipitation and decreasing evaporation. Water resources distribution is projected to change from summer-autumn dominant to autumn winter dominant. Annual lowest runoff will occur in May caused by earlier snow melting and increasing evaporation in March. According to the obtained results, winter runoff should be artificially stored by reservoir regulation in the future to prevent zero-flow occurrent in May. This research is helpful for water resources management and provides a better understand of streamflow change caused by climate change in the future.
- Article
(2980 KB) - Full-text XML
- BibTeX
- EndNote


Recently, climate change (IPCC, 2007) and uncertainties of global water resources change caused draw extensive attention all over the world (Taylor et al., 2013; Bae et al., 2008; Lan et al., 2009). As the water tower of Asia (Immerzeel et al., 2010), the Tibetan Plateau is sensitive to climate change (Su et al., 2016; Li et al., 2014; Yang et al. 2012; Li et al., 2013). The Yellow River, originates from the Tibetan Plateau, is the second longest river of China and the fifth longest river of the world. Water resources and runoff response to climate change of the Yellow River basin have been extensively researched (Yang et al., 2004; Fu et al., 2004; Chang et al., 2007), especially in the head water of the Yellow River (Wang and Cheng, 2000; Tang et al., 2008; Zheng et al., 2009, 2010; Liang et al., 2010; Lan et al., 2010, 2013). Above Huangheyan station, two lakes which play a role as nature reservoirs for the basin located in the topside source region of the Yellow River (HSRYR) with area about 21 000 km2 (Liang et al., 2010; Brierley et al., 2016). Because of water shortage and zero-flow phenomenon in 1990s, a 20 m-high Huangheyan Dam was built at the Ngoring Lake downstream, during 1999 and early 21st century (Liang et al., 2010; Brierley et al., 2016), to conserve enough water for the ecological environment maintenance. Though projections of runoff change were proposed by inputting the GCMs data to a calibrated model (Immerzeel et al., 2010; Xu et al., 2009), these researches conducted at a largescale more than 100 000 km2 area is not suitable for water resources management of a mesoscale basin like the HSRYR. Reasonable regulation of the Huangheyan dam in the climate changing future is important. Tank model were first proposed by Sugawara and Maruyama (1956), a typical runoff model with a brief model structure requires less data and gets a good performance in simulation and forecast (Franchini and Pacciani, 1991).
This study aims to establish a semi-distributed model by connecting several typical tank models. GCMs data are input into the built and calibrated model to assess the runoff in 21st century. This study will offer a reference for dam regulation strategy and water resources management in the sub-basin above Huangheyan station.
2.1 Study area background
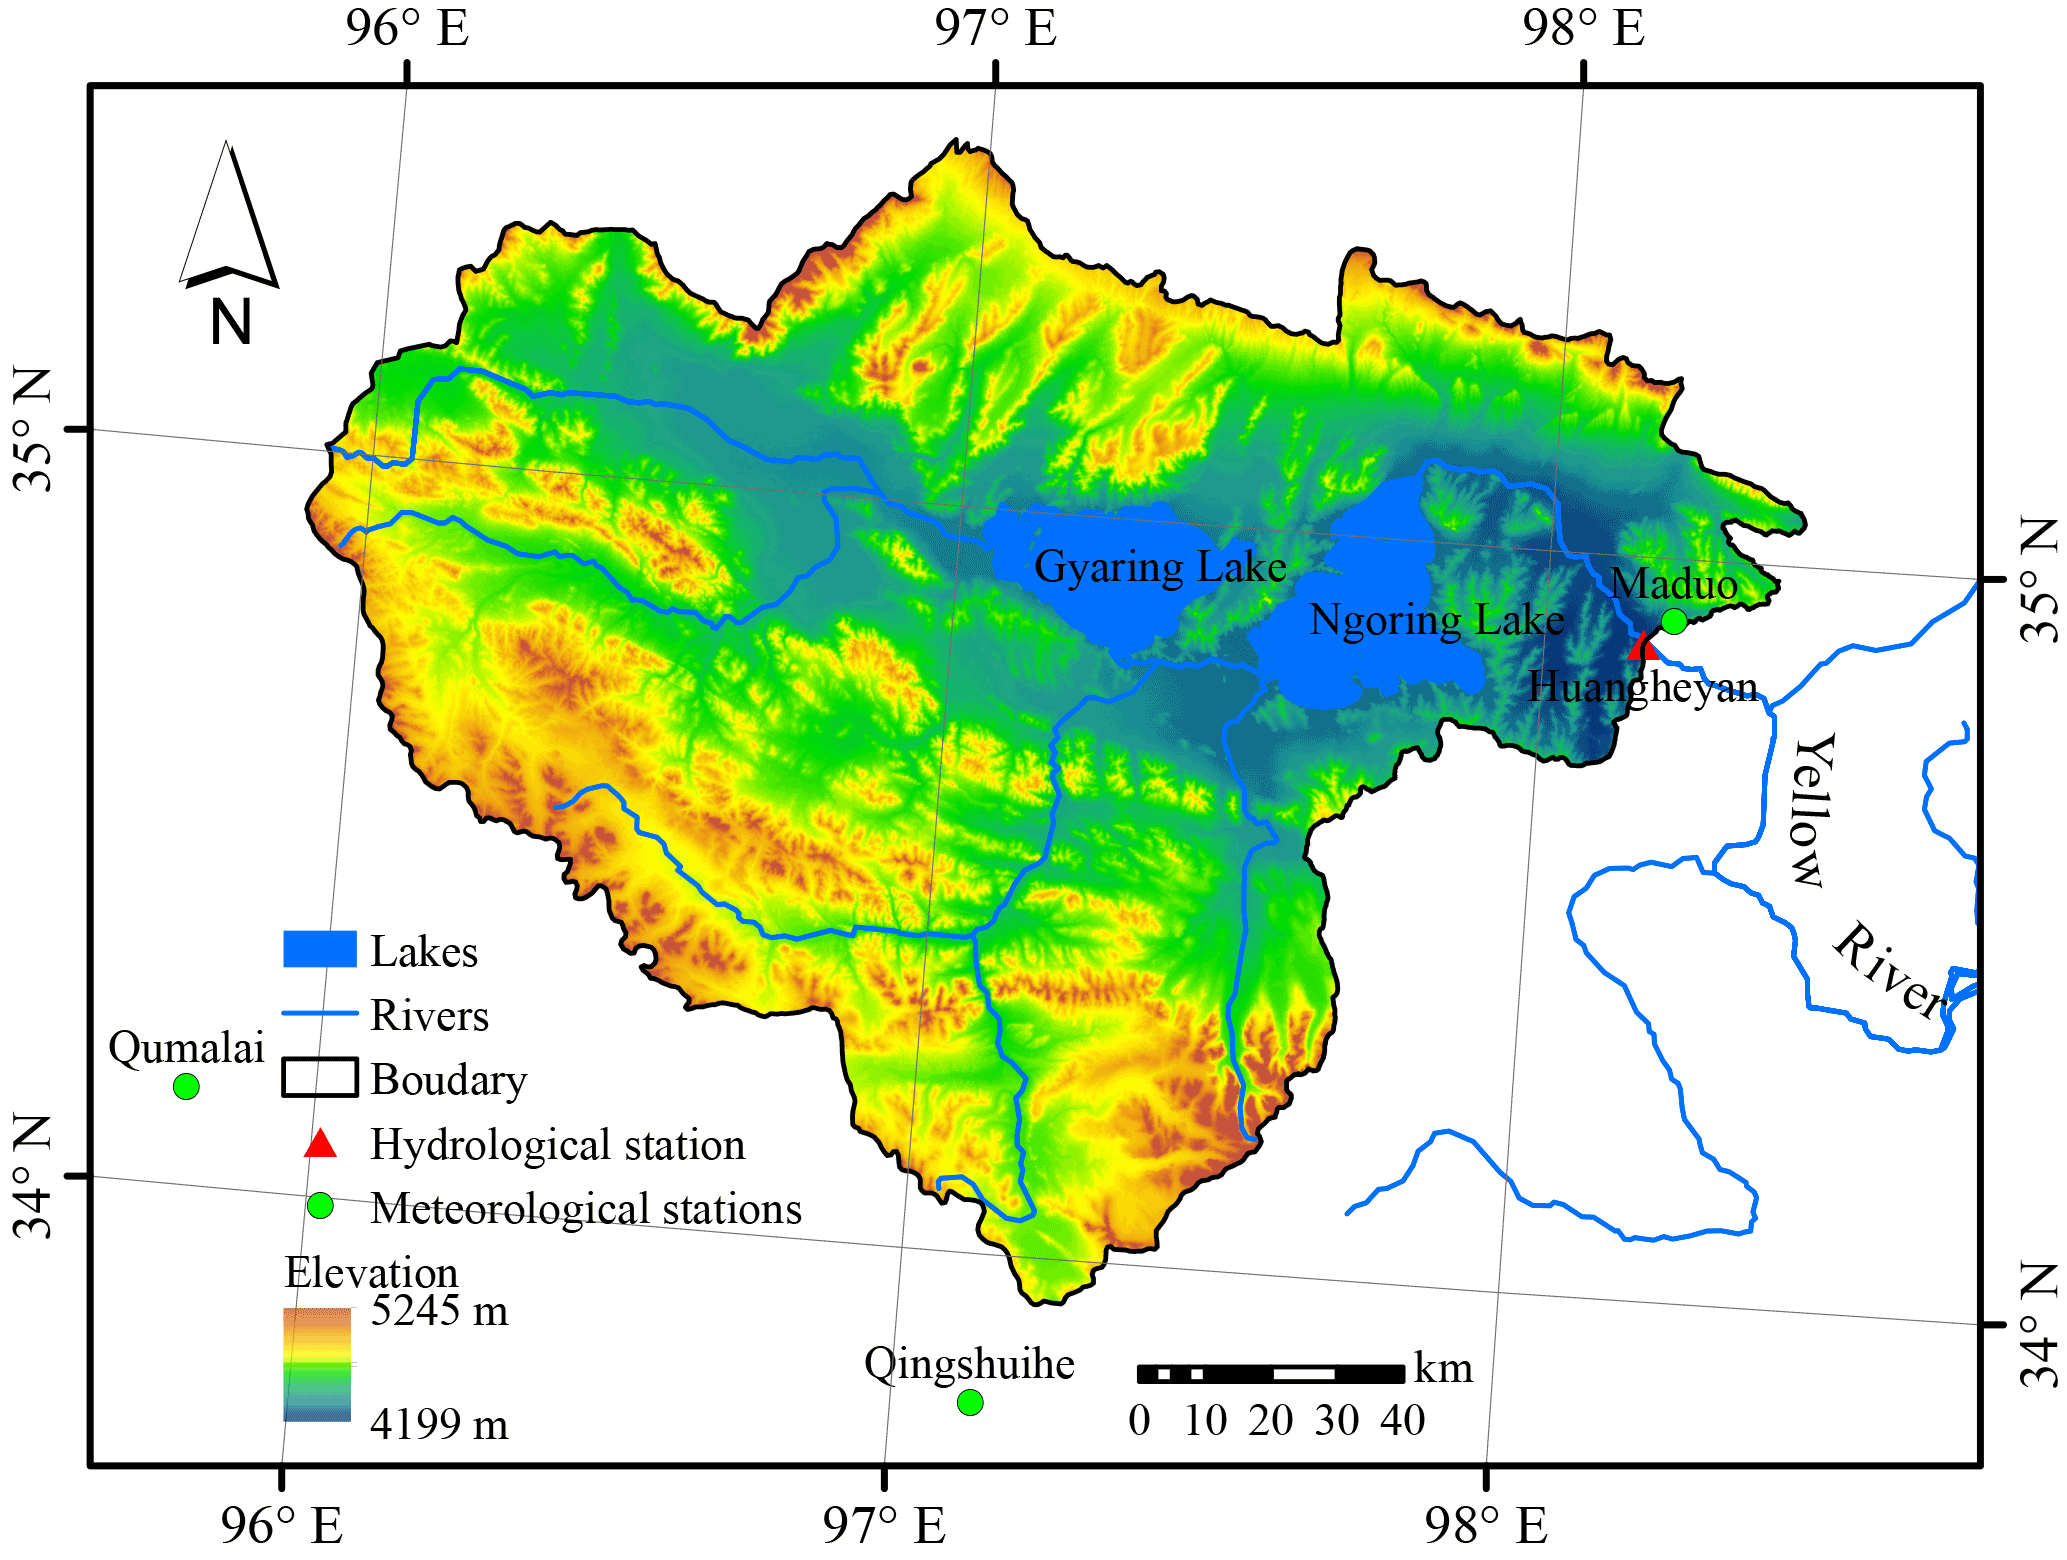
The HSRYR with drainage area about 21 000 km2 is a topside sub-basin of the source region of the Yellow River above Huangheyan hydrological station (HSRYR) which is embraced by high mountains from the north, south, to west sides (Fig. 1). Three meteorological stations are around or inside this area, from southwest to northeast is Qumalai, Qingshuihe and Maduo, respectively. This is a cold and arid area with an annual mean air temperature of −4 ∘C and annual mean precipitation of 310 mm. The potential evapotranspiration is about 1300–1400 mm year−1 (Liang et al., 2010).
The two major lakes, Gyaring and Ngoring, show an expansion trend in the past decade (Duan et al., 2015). Huangheyan dam is about 20 m-height which located at 1km away from Ngoring lake outlet (Brierley et al., 2016). Previously, the dam had been used for hydroelectric generation and water regulation, but recently it has only been used to store water due to low power generation efficiency. However, if the cut off phenomenon will show again in this area is still unknown. Notably, there is a runoff disturbed period caused by dam construction activity and power generation during 1999 to early 21st century.
2.2 Data processing
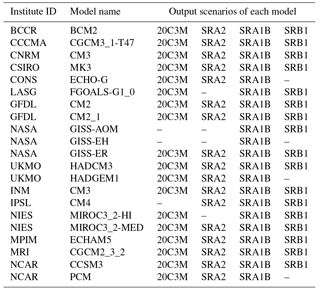
Monthly runoff data from 1990–2013 are obtained from the Yellow River Conservancy Commission (YRCC). Daily precipitation, air temperature and wind speed at 10 m height, relative humidity and sunshine duration data between 1961 and 2013 at the three meteorological stations are collected from the China Meteorological Administration (CMA). These data are applied to derive monthly mean air temperature (T), monthly positive accumulated temperature ( monthly precipitation (P) and snowfall (Ps). The potential evapotranspiration is calculated with the FAO Penman-Monteith equation (Allen et al., 1998). 21 Global Climate Models (GCMs) are selected as shown in Table 1. Due to uncertainty of each model projection, mean value of 21 GCMs output data under three emission scenarios (SRA2, SRA1B and SRB1), including shortwave flux at surface (W m−2) (ΔRs), precipitation rate change (mm day−1) and air temperature change(ΔT) are used as ensembled data in this study. Mean value of respective 20C3M output precipitation rate (mm day−1) during 1961 to 1990 is used as reference value. Landsat 5, 7, 8 datasets of July or August from 2000 to 2014 are used to extract lake area for further validation of model distribution ability.
3.1 Model construction and mechanism
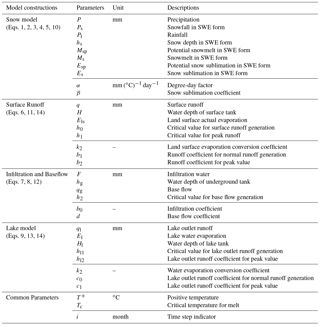
As shown in Fig. 2, snow, surface runoff and baseflow are considered in each land surface hydrologic response unit (HRU). Parameters described in Fig. 2 and used in the following equations are shown in Table 2.
Table 1Details of selected model and respective output scenarios.
Snowfall and rainfall are distinguished based on critical temperature Tc, expressed as:
Snow accumulation is indicated by following equations:
hs is accumulated snow relative depth (mm) in snow water equivalent (SWE) form.

Figure 2Typical tank model constructions, panels (a) and (b) indicate land surface HRU and lake HRU, respectively.
Snowmelt is calculated by Eq. (3)
Msp(i) is potential snowmelt water as indicated in Eq. (4). And the potential snow sublimation is given by Eq. (5):
Surface runoff is calculated by Eq. (6) based on different water depth.
Surface water infiltration is indicated as follow:
Baseflow is given by Eqs. (8) and (9):
As Fig. 2 indicated lake HRU plays a role as a regulate reservoir which outlet runoff is calculated by following equations:
Snow accumulated depth, water depth of each step can be calculated by solving following equation by implicit finite difference method.
Time-varying values of snow depth, land surface water depth, baseflow and lake water depth are given by Eqs. (10), (11), (12) and (13) respectively:
Land surface actual evaporation and lake water evaporation are calculated from:
Then total outlet runoff is transformed into m3 s−1 unit.
3.2 Model performance evaluation
Volume difference (Dv), and Nash–Sutcliffe efficiency (R2) are used to evaluate the model performance defined as following:
R2 is Nash–Sutcliffe efficiency Qi is observed monthly runoff, simulated monthly runoff, is observed annual mean runoff, n is the total number of simulated months. Dv is volume difference between observed runoff and simulated runoff. VR indicates total observed runoff volume. indicates total simulated runoff volume.
There are five HRUs included in this study, land surface HRUs: HRU 1, HRU 2 and HRU 3. Two Lakes HRUs: HRU G and HRU N. Each HRU is represented by one typical tank model, the model connection is based on flow direction as shown in Fig. 3.
3.3 GCMs data downscaling
There are several normally used downscaling methods for GCMs data: statistical downscaling method, dynamic downscaling method and delta method (Xu et al., 2009). But different method has different shortage and advantage (Fowler et al. 2007). Delta method is a simple method commonly applied in hydrological studies of climate change (Merritt et al., 2006). In this study delta method is selected instead of complex spatial downscaling mothed.
Precipitation is projected by:
P0 (mm) is observed monthly precipitation of pre-change period (1961–1990), reference precipitation rate (mm day−1) of period 1961–1990 obtained from mean value of GCMs under scenario 20C3M, ΔP (mm day−1) is the mean value of 21 GCMs projected change of precipitation rate under respective scenarios.
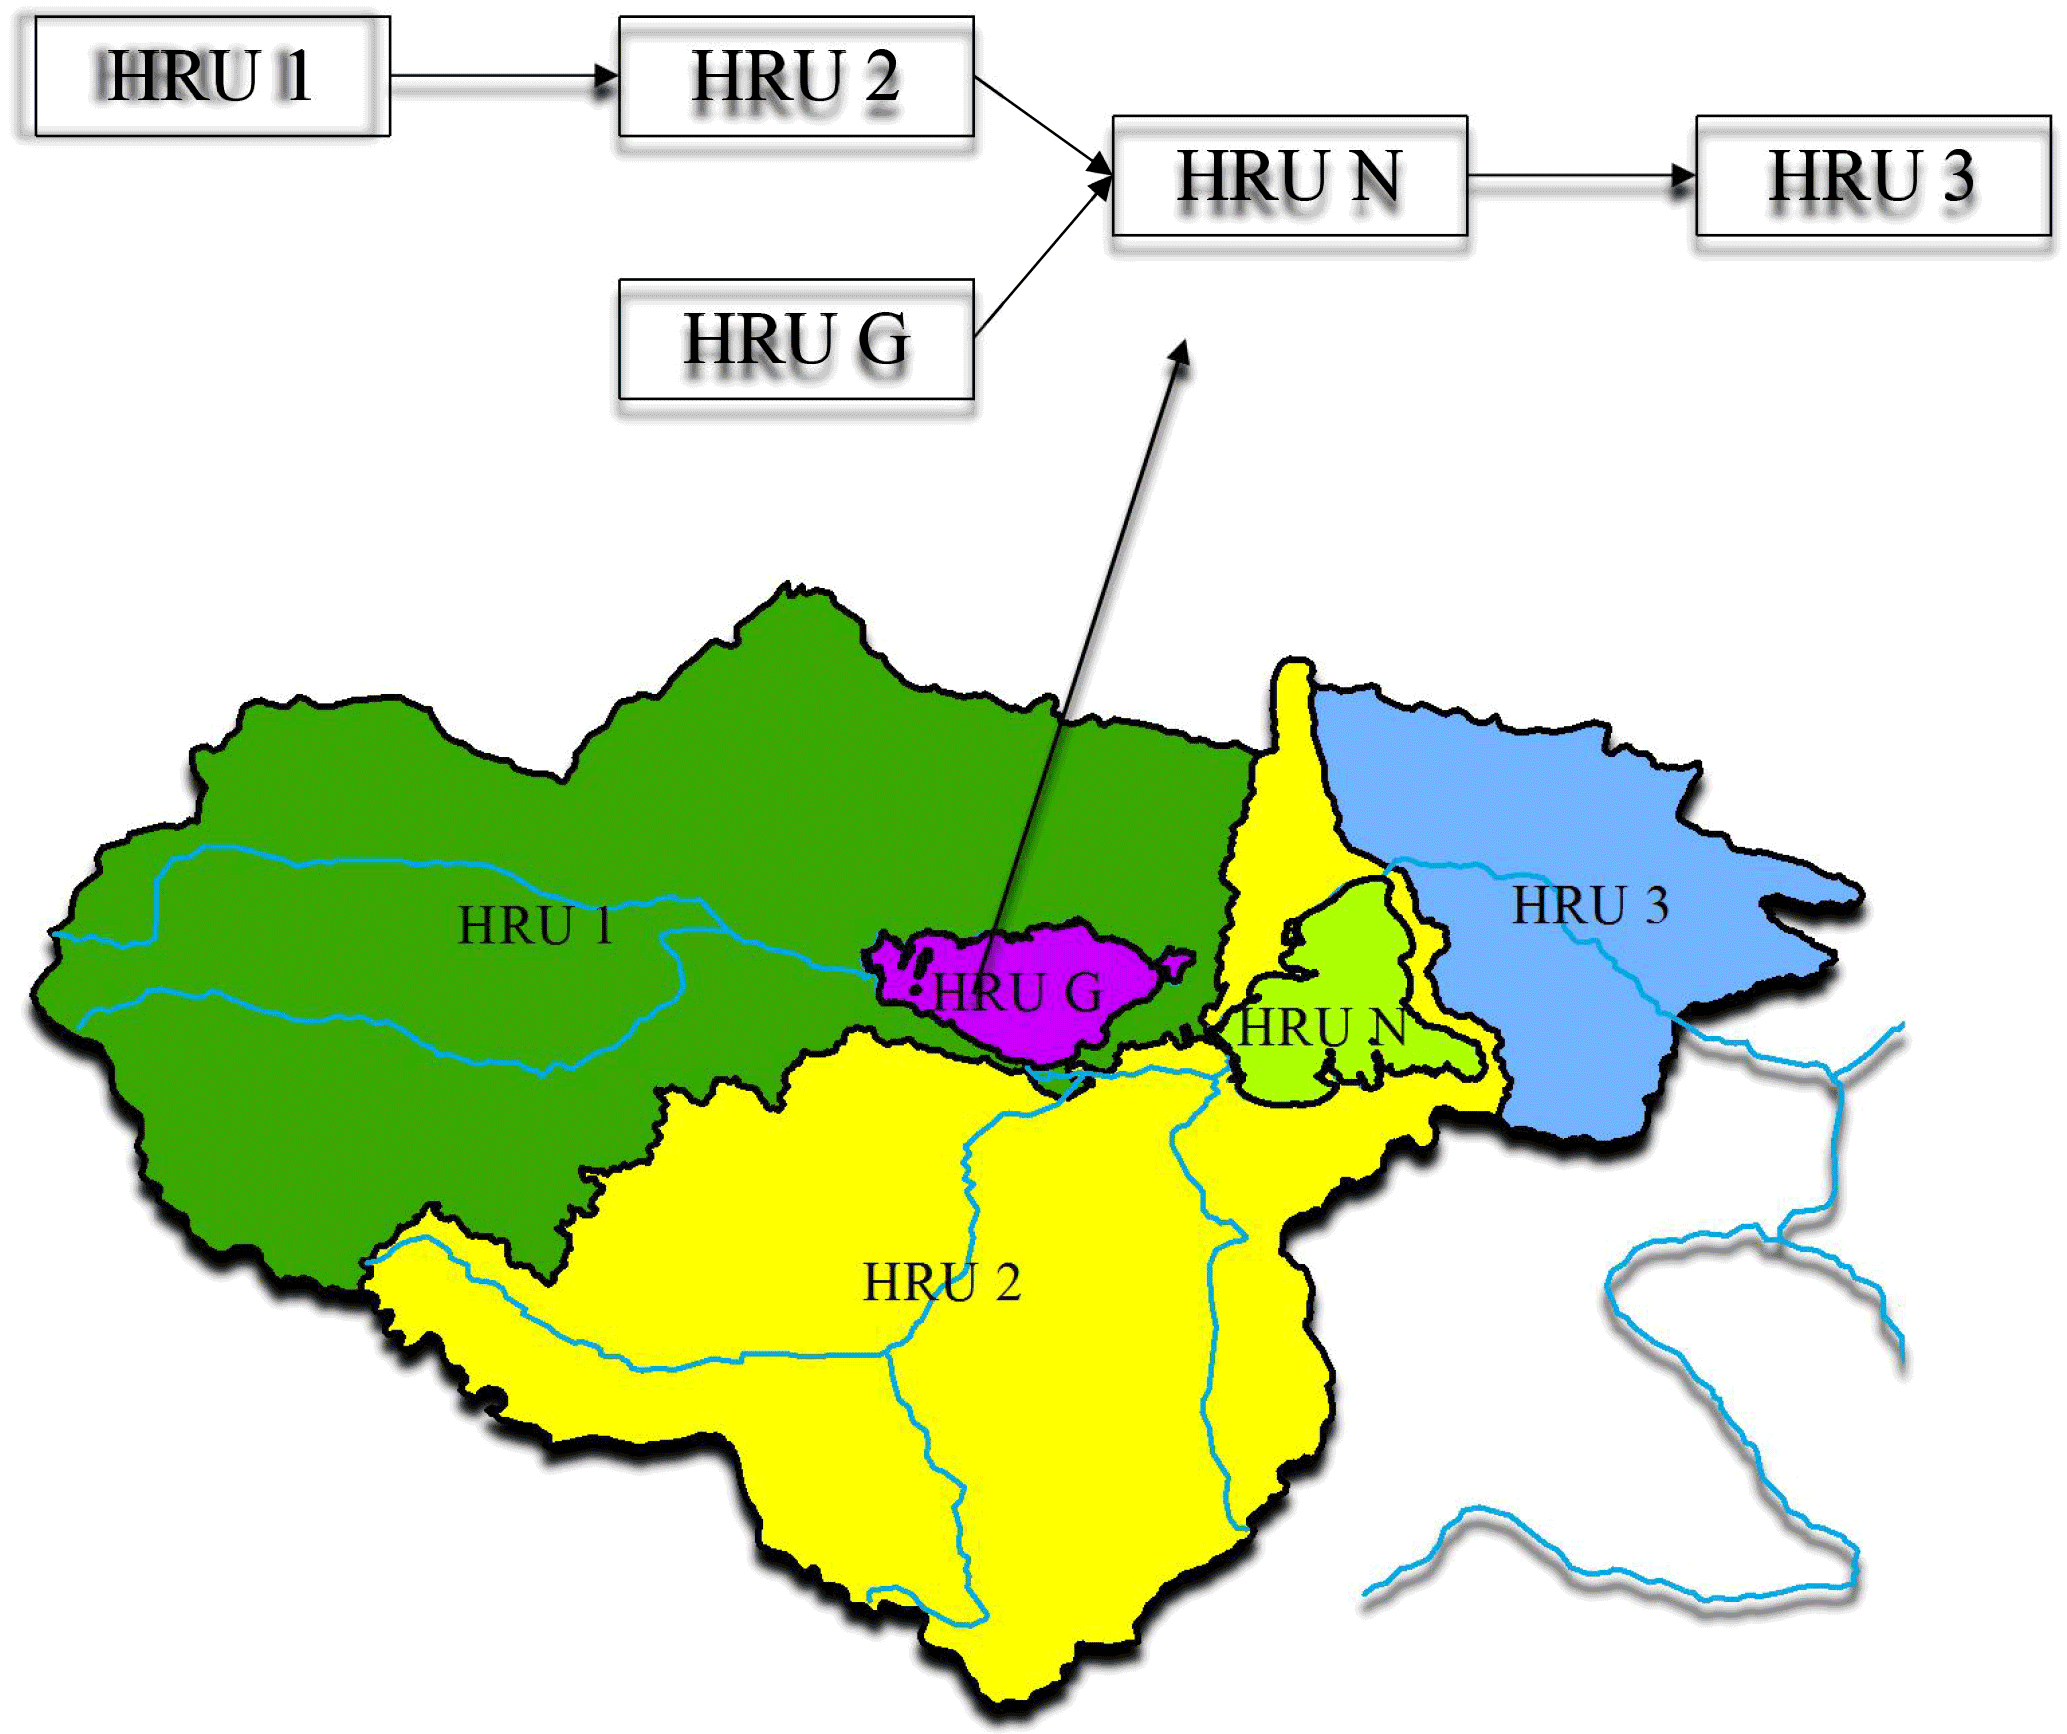
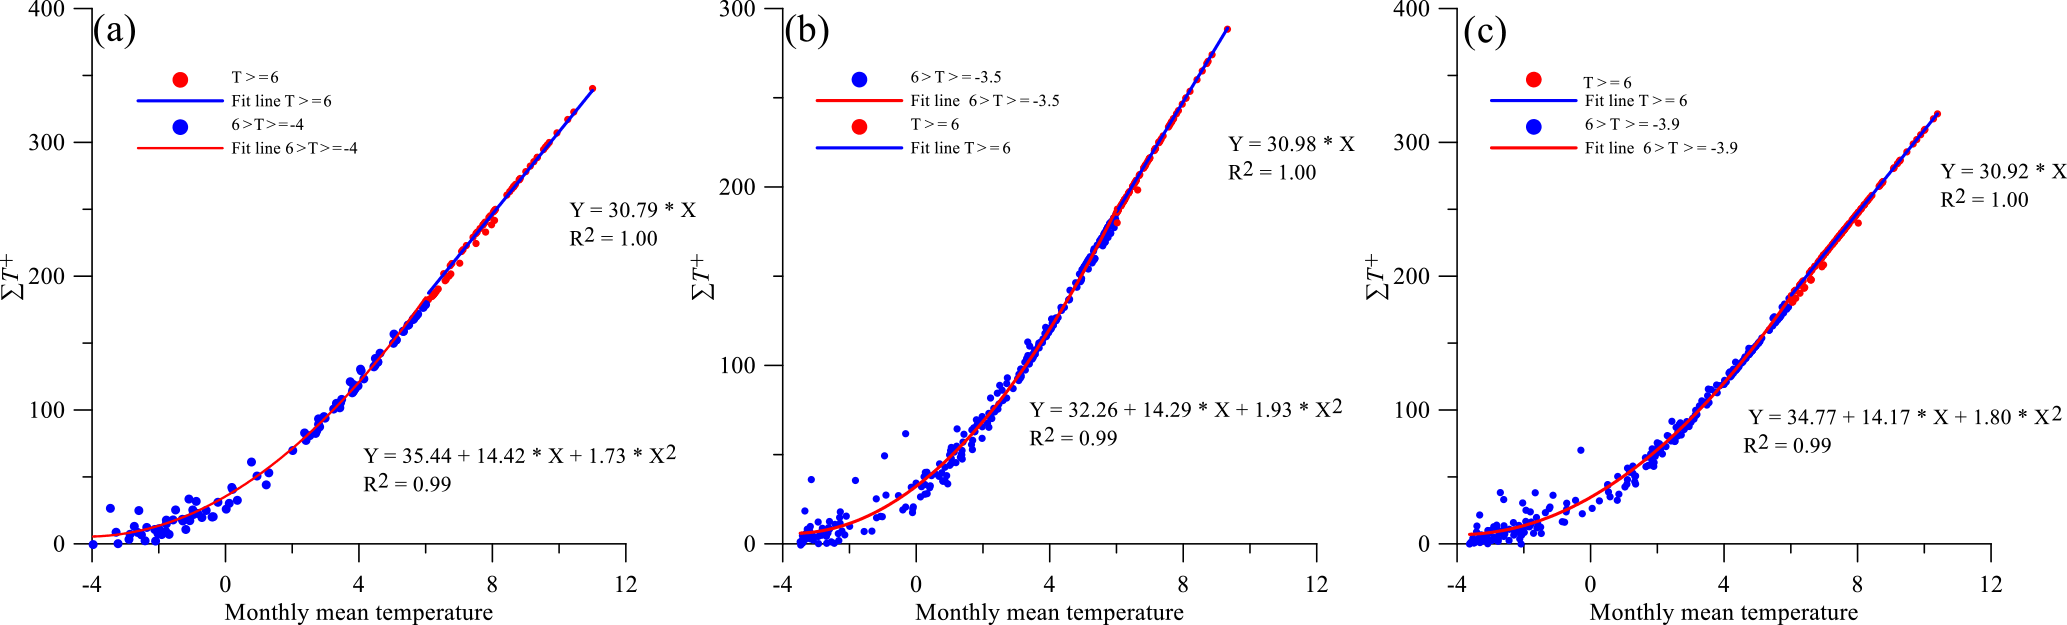
Figure 4Relationship between monthly mean temperature and monthly positive accumulated temperature (1961–2013). Panels (a, b, c) indicate Qumalai, Qingshuihe and Maduo station, respectively.
For temperature projection:
T0 (∘C) is monthly pre-change value of temperature (mean value of 1961–1990), ΔT(K) is the projection change of temperature.
Rs0 (MJ (m2 × day)−1) is monthly mean value of pre-change period (1961–1990) obtained from FAO Penman-Monteith equation (Allen et al., 1998). ΔRs (W m−2) is mean value of 21 GCMs projected shortwave flux change at surface under respective scenarios.

3.4 Projection of and E0
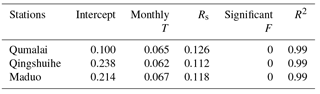
Monthly accumulated positive temperature is significantly correlated with monthly mean temperature as shown in Fig. 4. By using the piecewise equation shown in Fig. 4, can be obtained from monthly mean temperature (T). Potential evaporation(E0) is calculated by linear correlation with projected monthly mean temperature, and solar radiation (Table 4).

4.1 Results of simulation
Monthly comparisons between the simulated runoff and observed runoff in the calibration period (1990–1998) and validation period (2000–2013) are shown in Fig. 5. As the red line in Fig. 5a and red points in Fig. 5c indicated, the runoff is obviously disturbed during dam construction and hydropower generation period. After disturbed period, simulated runoff variation agrees favourably with the observation runoff except slight overestimation (Fig. 5a and b). The model performance in calibration period: R2: 0.84, Dv: −0.5 %, in period 2008–2013: R2: 0.67, Dv: −24.88 %. Generally model performance is very good if R2 > 0.75, satisfactory if 0.36 < R2 < 0.75, and unsatisfactory if R2 < 0.36 (Nash and Sutcliffe, 1970; Krause et al., 2005; Moriasi et al., 2007). The Dv is about −25 % which indicates overestimation. But it is reasonable, because there will be more water conserved in the reservoir after the a 20 m-height dam built.

4.2 Lakes expansion and relationship with respective outlet runoff
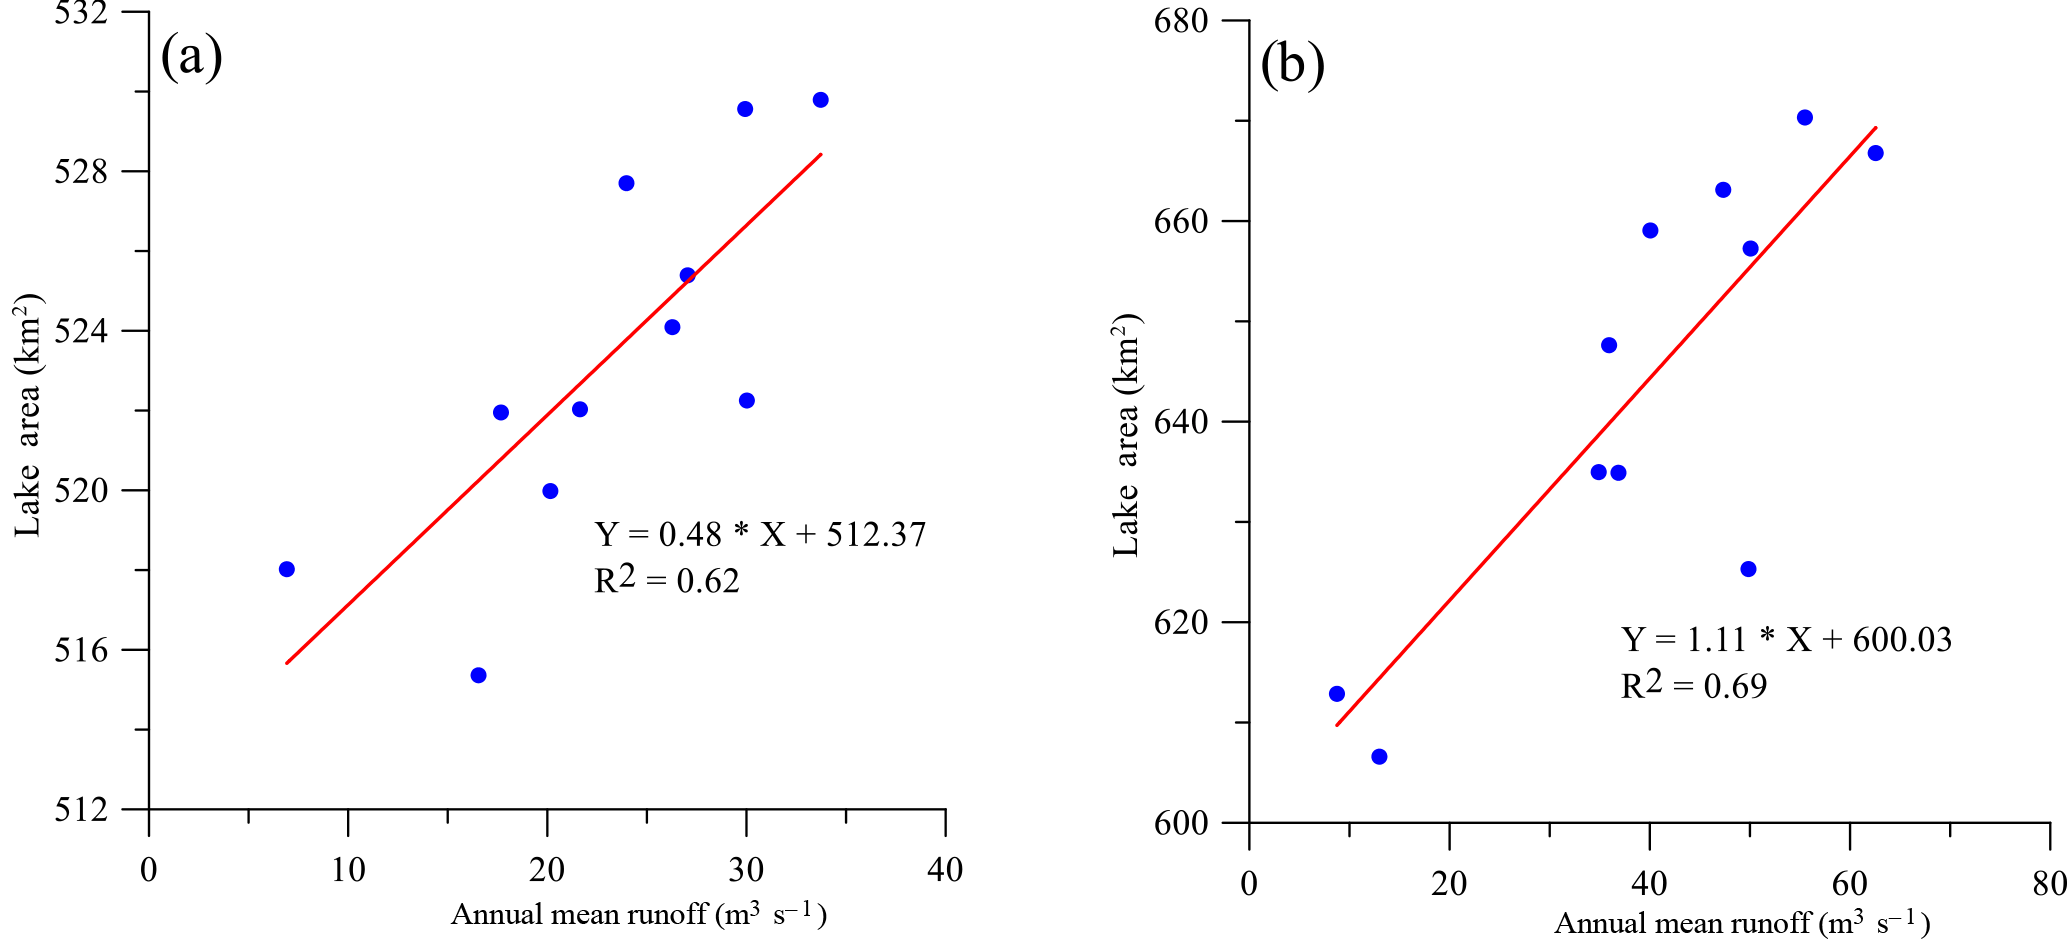
Figure 6 indicates variation of the lake area (Fig. 6b), in the past decade expansion of Ngoring lake is more obvious than Gyaring lake (Fig. 6a). The two lakes show a similar change pattern, lake area shrank at first (2000–2004) and then expand (2004–2012). It is caused by water resources change in this area, the last zero-flow phenomenon happened in 2004 (Chang et al., 2007), and runoff rise again from 2004 to 2012. Though this model is only calibrated by runoff of Huangheyan station, simulated outlet runoff of the two lakes is significantly correlated with the lake area change (Fig. 7) that indicate a distribution characteristic of this model.
4.3 Results of projection
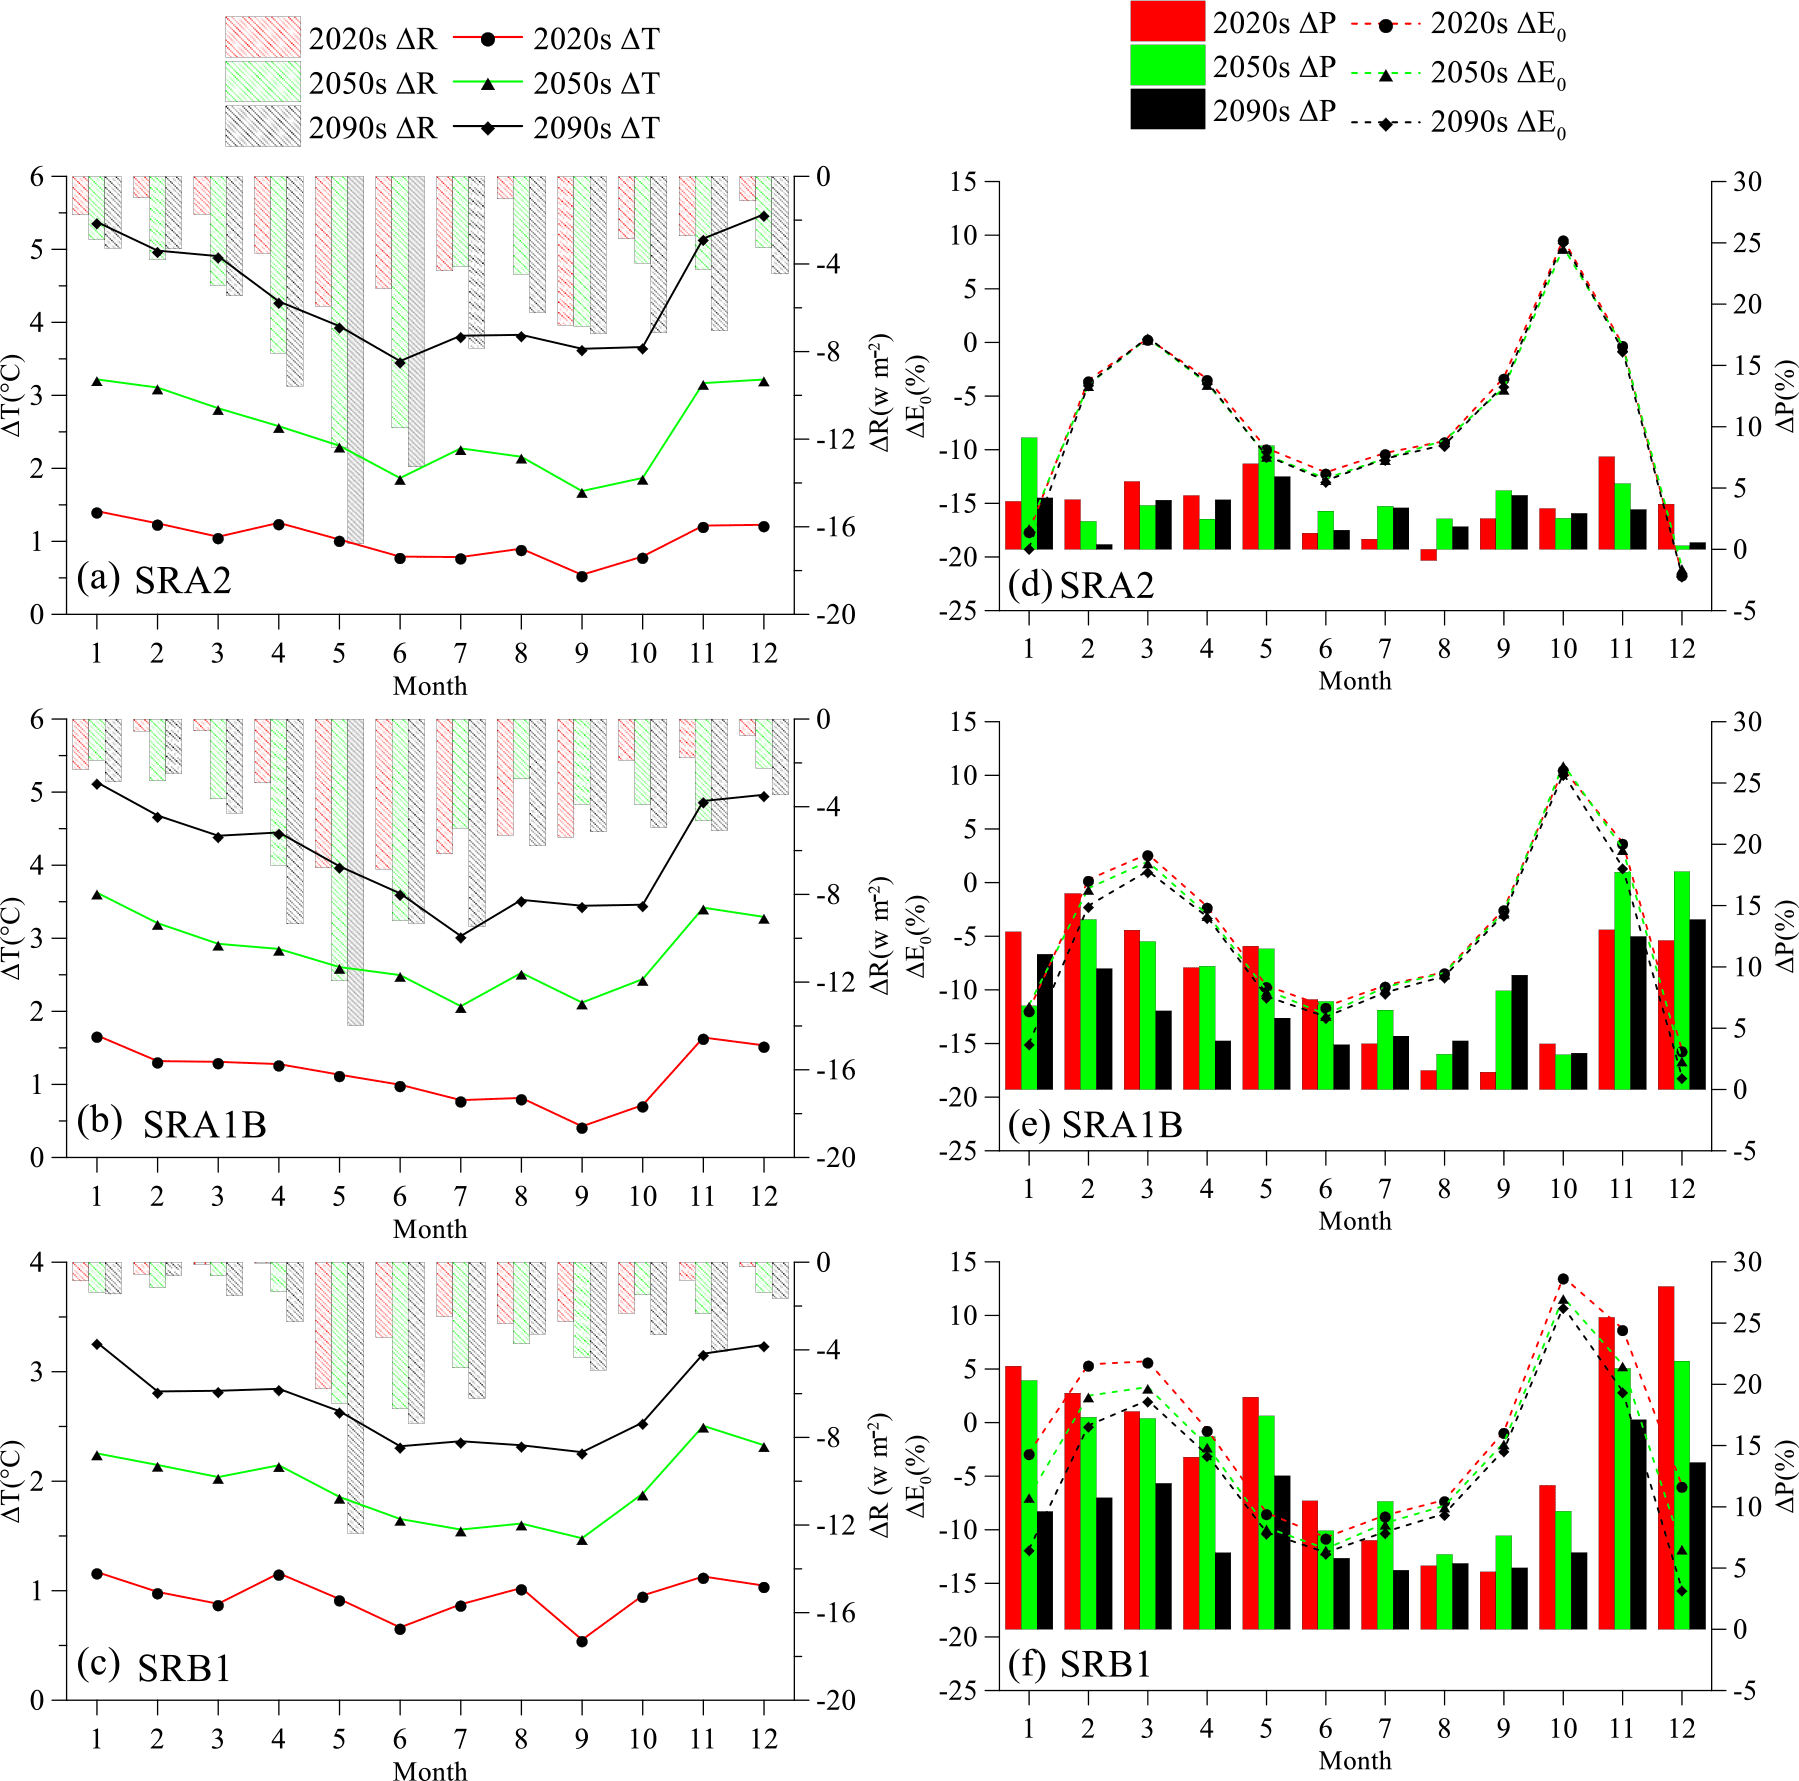
Change of projected ΔP (%), ΔE0 (%), ΔRs (W m−2) and ΔT (∘) in the three respective periods under scenarios SRA2, SRA1B and SRB1 are displayed in Fig. 8. Three scenarios similarly indicate that temperature and precipitation will increase, but radiation will decrease in the future. Temperature and precipitation is projected to increase for all seasons but with largest increase appearing in winter and spring. Radiation is projected to decease all the time but with largest decrease appearing in spring. Impacted by change of temperature and radiation, potential evapotranspiration is projected to decrease in summer and winter but increase in spring and autumn. Though projected variations under different scenarios show a similar seasonality, the projected increment and decrement are different resulted from different emission scenarios. Radiation and temperature projected by SRA2 show the largest change among the three scenarios, but precipitation and potential evapotranspiration projected by SRB1 show a largest change compare to the other two scenarios. Variables projected by SRA1B show a moderate change. These are resulted from different scenarios setting different future greenhouse gas emissions accompanied by storylines of social, economic and technological development (Parry and Cox, 2007).
Projected runoff in 2011–2030 (2020s), 2046–2065 (2050s), 2080–2099 (2090s) under the three scenarios SRA2, SRA1B and SRB1 are shown in Fig. 9a, b and c, respectively. There are two dash line, blue and purple, indicate pre-change period (1961–1990) and low-flow (1990s) period, respectively. Results in Fig. 9 similarly indicated that runoff shows an increase trend in the long term. Increasing runoff is mainly caused by dramatically increase precipitation. Projected runoff of SRA1B and SRB1 are lower than SRA2 but showed a similar trend as SRA2 in the three periods (Fig. 9c). Runoff is projected to increase eventually in the future but won't return to a pre-change level. As indicated by results of SRA2 (Fig. 9b), runoff of August to December will reach to a pre-change level in 2090s, but runoff of January to July in 2090s is lower than pre-change period. Annual runoff is projected to return in 2090s, but runoff in spring and summer is projected to be lower than pre-change period. Water resources distribution is projected to change from summer-autumn dominant to autumn winter dominant. Temperature increase in winter-spring and potential evapotranspiration increase in spring cause earlier snowmelt runoff and increase evapotranspiration in spring. Annual lowest runoff is projected to occur in May as different from the winter months, as seen in the 1990s (Fig. 9).
Table 3Calibrated parameters.
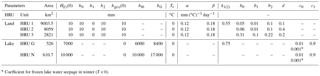
∗ Coefficient for frozen lake water seepage in winter (T < 0).
4.4 Will zero-flow show again?
The last zero-flow phenomenon occurred in 2004 January to March (Chang et al., 2007). In the future, precipitation is projected to increase in winter and earlier snow melting will occur which result in higher winter runoff than before (Fig. 8), the zero flow won't occur in winter again. And there is no zero-flow phenomenon in projected results of different periods under the three scenarios. Due to increase temperature in winter, frozen water resources will release earlier than before which will cause less melt water recharge in May runoff and a relative lower runoff appearing in May. If the dam impacts are taken into consideration, zero-flow phenomenon is possible show again in May in the warming future. To prevent appearing of zero-flow phenomenon, artificially regulate the dam to store water in winter is imperative.
4.5 Limitation remarks
Due to low people density (0.34 person km−2) (Liang et al., 2010) and difficulty of estimating dam construction and hydropower generation impacts, observed runoff used in this study was not naturalized first. However, this model is well calibrated by undisturbed runoff from 1990–1998 and then validated by 2008–2013 runoff and lake area obtained from Landsat datasets.
Only two variables are involved in E0 projection in this study, but as shown in Table 3, a strong relationship existed between Rs and T. For projection, when daily air temperature is positive for in the whole month, monthly positive accumulated temperature should be calculated from:
But the deviation is negligible, the results will be same as which obtained the linear equation of piecewise equations in Fig. 4.
Frozen ground is widely distributed in this area (Jin et al., 2010) which degradation in the warming future will impact runoff generation (Hayashi et al., 2003; Shanley and Chalmers, 1999; Wang et al., 2009). But few conception models consider impacts of frozen ground and its degradation on runoff generation. It needs a further and deeply study to conceptualize the physical process into conception model.
In this study, the built model connected several typical tank models showed a good performance in runoff simulation and projection. And it can be used as a semi-distribution model proved by significantly correlation with the lake area change. Different projections obtained by different scenarios that improve uncertainties of water resources change in the future, but there are similarities:
- a.
Compared to low-flow period (1990s), the projected runoff shows a recovery trend in the long term.
- b.
Runoff distribution will change from summer-autumn dominant to autumn-winter dominant. In the future, annual lowest runoff will occur in May rather than in the winter.
- c.
Though there is no zero-flow showed among these projections, but zero-flow is possible to occur in May by considering dam impacts. Reservoir regulation strategies should be made for storing winter runoff to prevent zero-flow phenomenon in May.
This study is helpful for water resources management and provides a better understand of streamflow change caused by climate change in the future
GCMs data are obtained from IPCC Data Distribution Centre: http://www.ipcc-data.org/sim/gcm_clim/SRES_AR4/index.html.
The availability of other data are mentioned in Sect. 2.2.
The authors declare that they have no conflict of interest.
This article is part of the special issue “Innovative water resources management – understanding and balancing interactions between humankind and nature”. It is a result of the 8th International Water Resources Management Conference of ICWRS, Beijing, China, 13–15 June 2018.
This research was supported by the China Geological Survey from 2000, the
National Natural Science Foundation of China (41330634, 41072191, 91125011)
and the Fundamental Research Funds for Central Universities. The authors are
grateful to the two reviewers for their insightful and constructive comments
which have greatly improved the quality of the paper.
Edited by: Wenchao Sun
Reviewed by: Shaowei Ning and one anonymous referee
Allen, R., Pereira, L. S., Raes, D., and Smith, M.: Crop evapotranspiration – Guidelines for computing crop water requirements, FAO Irrigation and Drainage Paper no. 56, Rome, Italy, 1998.
Bae, D. H., Jung, I. W., and Chang, H.: Long-term trend of precipitation and runoff in korean river basins, Hydrol. Process., 22, 2644–2656, 2008.
Brierley, G. J., Li, X., Cullum, C., and Gao, J.: Landscape and ecosystem diversity, dynamics and management in the Yellow River source zone, Springer Geography, available at: https://link.springer.com/book/10.1007/978-3-319-30475-5 (last access: 28 February 2018), 2016.
Chang, G., Li, L., Zhu, X., Wang, Z., Xiao, J., and Li, F.: Influencing factors of water resources in the source region of the Yellow River, J. Geogr. Sci., 17, 131–140, 2007.
Duan, S., Fan, S., Cao, G., Liu, X., and Sun, Y.: The changing features and cause analysis of the lakes in the source regions of the yellow river from 1976 to 2014, J. Glaciol. Geocryol., 37, 745–756, 2015.
Fowler, H. J., Blenkinsop, S., and Tebaldi, C.: Linking climate change modelling to impacts studies: recent advances in downscaling techniques for hydrological modelling, Int. J. Climatol., 27, 1547–1578, 2007.
Franchini, M. and Pacciani, M.: Comparative analysis of several conceptual rainfall-runoff models, J. Hydrol., 122, 161–219, 1991.
Fu, G., Chen, S., Liu, C., and Shepard, D.: Hydro-climatic trends of the yellow river basin for the last 50 years, Climatic Change, 65, 149–178, 2004.
Hayashi, M., Kamp, G. V. D., and Schmidt, R.: Focused infiltration of snowmelt water in partially frozen soil under small depressions, J. Hydrol., 270, 214–229, 2003.
Immerzeel, W. W., van Beek, L. P., and Bierkens, M. F.: Climate change will affect the asian water towers, Science, 328, 1382–1385, 2010.
IPCC: Climate change 2007: The Physical Science Basis, in: Contribution of Working Group I to the Fourth Assessment Report of the Intergovernmental Panel on Climate Change, Cambridge University Press, Cambridge, UK, 996 pp., 2007.
Jin, H. J., Wang, S. L., Lan-Zhi, L., Rui-Xia, H. E., Chang, X. L., and Luo, D. L.: Features and degradation of frozen ground in the sources area of the yellow river, China, J. Glaciol. Geocryol., 49, 5522–5529, 2010.
Krause, P., Boyle, D. P., and Bäse, F.: Comparison of different efficiency criteria for hydrological model assessment, Adv. Geosci., 5, 89–97, https://doi.org/10.5194/adgeo-5-89-2005, 2005.
Lan, C., Lettenmaier, D. P., Alberti, M., and Richey, J. E.: Effects of a century of land cover and climate change on the hydrology of the puget sound basin, Hydrol. Process., 23, 907–933, 2009.
Lan, C., Zhang, Y., Gao, Y., Hao, Z., and Cairang, L.: The impacts of climate change and land cover/use transition on the hydrology in the upper yellow river basin, China, J. Hydrol., 502, 37–52, 2013.
Lan, Y., Zhao, G., Zhang, Y., Wen, J., Liu, J. Q., and Hu, X.: Response of runoff in the source region of the yellow river to climate warming, Quatern. Int., 226, 60–65, 2010.
Li, B., Yu, Z., Liang, Z., and Acharya, K.: Hydrologic response of a high altitude glacierized basin in the central tibetan plateau, Global Planet. Change, 118, 69–84, 2014.
Li, F., Zhang, Y., Xu, Z., Teng, J., Liu, C., Liu, W., and Mpelasoka, F. The impact of climate change on runoff in the southeastern Tibetan Plateau, J. Hydrol., 505, 188–201, 2013.
Liang, S., Ge, S., Wan, L., and Zhang, J.: Can climate change cause the yellow river to dry up?, Water Resour. Res., 46, 228–236, 2010.
Merritt, W. S., Alila, Y., Barton, M., Taylor, B., Cohen, S., and Neilsen, D.: Hydrologic response to scenarios of climate change in subwatersheds of the Okanagan basin, British Columbia, J. Hydrol. 326, 79–108, 2006.
Moriasi, D. N., Arnold, J. G., Van Liew, M. W., Bingner, R. L., Harmel, R. D., and Veith, T. L.: Model evaluation guidelines for systematic quantification of accuracy in watershed simulations, Am. Soc. Agric. Biol. Eng., 50, 885–890, 2007.
Nash, J. E. and Sutcliffe, J. V.: River flow forecasting through conceptual models: Part I. A discussion of principles, J. Hydrol., 10, 282–290, 1970.
Parry, M. L. and Cox, B. S.: Technical Summary, in: Climate Change 2007: Impacts, Adaptation and Vulnerability. Contribution of Working Group II to the Fourth Assessment Report of the Intergovernmental Panel on Climate Change, Cambridge University Press, Cambridge, UK, 23–789, 2007.
Shanley, J. B. and Chalmers, A.: The effect of frozen soil on snowmelt runoff at Sleepers River, Vermont, Hydrol. Process., 13, 1843–1857, 1999.
Su, F., Zhang, L., Ou, T., Chen, D., Yao, T., Tong, K., and Qi, Y.: Hydrological response to future climate changes for the major upstream river basins in the Tibetan Plateau, Global Planet. Change, 136, 82–95, 2016.
Sugawara, M. and Maruyama, F.: A method of revision of the river discharge by means of a rainfall model. Collection of research papers about forecasting hydrologic variables, The Geosphere Research Institute of Saitama University, Saitama, Japan, 14–18, 1956.
Tang, Q., Oki, T., Kanae, S., and Hu, H.: Hydrological cycles change in the yellow river basin during the last half of the twentieth century, J. Climate, 21, 1790–1806, 2008.
Taylor, R. G., Scanlon, B., Döll, P., Rodell, M., Van Beek, R., Wada, Y., Longuevergne, L., Leblanc, M., Famiglietti, J. S., Edmunds, M., and Konikow, L.: Ground water and climate change, Nature Clim. Change, 3, 322–332, 2013.
Wang, G. and Cheng, G.: Eco-environmental changes and causative analysis in the source regions of the yangtze and yellow rivers, China, Environmentalist, 20, 221–232, 2000.
Wang, G. X., Hu, H. C., and Li, T. B.: The influence of freeze-thaw cycles of active soil layer on surface runoff in a permafrost watershed, J. Hydrol., 375, 438–449, 2009.
Xu, Z. X., Zhao, F. F., and Li, J. Y.: Response of streamflow to climate change in the headwater catchment of the yellow river basin, Quatern. Int., 208, 62–75, 2009.
Yang, D., Li, C., Hu, H., Lei, Z., Yang, S., Kusuda, T., Koike, T., and Musiake, K.: Analysis of water resources variability in the Yellow River of China during the last half century using historical data, Water Resour. Res., 40, 308–322, 2004.
Yang, T., Hao, X., Shao, Q., Xu, C. Y., Zhao, C., Chen, X., and Wang, W.: Multi-model ensemble projections in temperature and precipitation extremes of the tibetan plateau in the 21st century, Global Planet. Change, 80–81, 1–13, 2012.
Zheng, H., Lu, Z., Zhu, R., Liu, C., Sato, Y., and Fukushima, Y.: Responses of streamflow to climate and land surface change in the headwaters of the yellow river basin, Water Resour. Res., 45, 641–648, 2009.
Zheng, H., Zhang, L., Liu, C., Shao, Q., and Fukushima, Y.: Changes in stream flow regime in headwater catchments of the yellow river basin since the 1950s, Hydrol. Process., 21, 886–893, 2010.