the Creative Commons Attribution 4.0 License.
the Creative Commons Attribution 4.0 License.
Effect of reservoir zones and hedging factor dynamism on reservoir adaptive capacity for climate change impacts
Bankaru-Swamy Soundharajan
When based on the zones of available water in storage, hedging has traditionally used a single hedged zone and a constant rationing ratio for constraining supply during droughts. Given the usual seasonality of reservoir inflows, it is also possible that hedging could feature multiple hedged zones and temporally varying rationing ratios but very few studies addressing this have been reported especially in relation to adaptation to projected climate change. This study developed and tested Genetic Algorithms (GA) optimised zone-based operating policies of various configurations using data for the Pong reservoir, Himachal Pradesh, India. The results show that hedging does lessen vulnerability, which dropped from ≥ 60 % without hedging to below 25 % with the single stage hedging. More complex hedging policies, e.g. two stage and/or temporally varying rationing ratios only produced marginal improvements in performance. All this shows that water hedging policies do not have to be overly complex to effectively offset reservoir vulnerability caused by water shortage resulting from e.g. projected climate change.
- Article
(8047 KB) - Full-text XML
- BibTeX
- EndNote
The realization that projected climate change will affect reservoir future inflow series and hence performance has led to the intensification of research efforts to assess these impacts as a precursor to the development of effective mitigation and adaptation strategies (see e.g. Nawaz and Adeloye, 2006; Fowler et al., 2003; Li et al., 2009). Most of these studies have reported deteriorating performance notably with regard to vulnerability unless improved operational practices are developed.
The use of rule curves for guiding reservoir operation (Yin et al., 2015) is schematically illustrated in Fig. 1a. Full satisfaction of demand is attempted whenever the water available (WA) is in the interval [LRCm, URCm], where LRCm and URCm are, respectively, the ordinates of the lower and upper rule curves for month m. The supply exceeds the demand when WA is above URCm but no water is supplied if the WA is below LRCm.
Although they are easy to use, rule curves often produce large water shortages or vulnerability (see e.g. Chiamsathit et al., 2014). Hedging, which is the deliberate cutting back of supplied water even when there is sufficient water, has been shown to moderate the vulnerability associated with rule curve operation (Eum et al., 2011).
Figure 1b illustrates a critical rule curve (CRC) delineated hedging zone integrated with the rule curve of Fig. 1a. Below the CRC, a maximum fraction “α” of the demand will be attempted, i.e. , where is the supply, Dt is the demand and α () is the constant rationing ratio. Possibilities for enhancing the hedging policy exist, such as by incorporating multiple hedging zones (see Fig. 1c) and/or temporally varying (e.g. monthly, seasonally) rationing ratios. What is certain is that such enhancements will complicate the policy; however, the degree of performance improvement of such enhancements remains largely unknown.
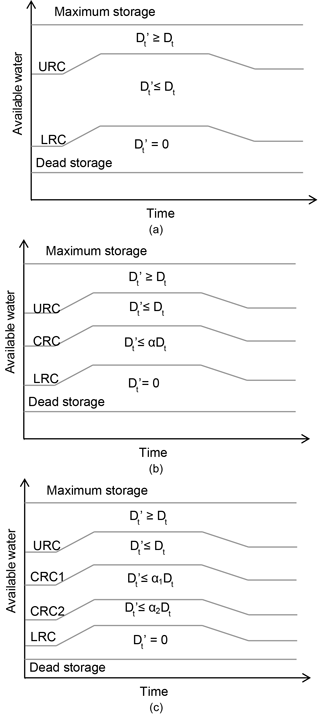
Figure 1Schematic illustration of zone-based operating rules for (a) no-hedging; (b) single-stage hedging; and (c) two-stage hedging.
The aim of this work is to evaluate the effectiveness of GA-optimised hedging policies in moderating reservoir vulnerability during projected climate change perturbations. The work used the Pong reservoir located on the Beas River in Himachal Pradesh, India and serves irrigation and hydropower purposes. In the following section, further details of the adopted methodology are given. This is then followed by the description of the case study, following which the results are presented and discussed. The final section contains the main conclusions and recommendations of the study.
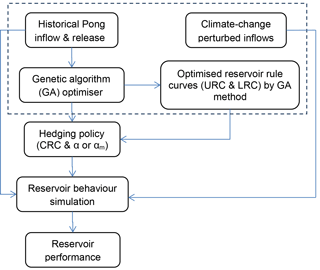
The methodological approach is illustrated in Fig. 2; brief details of the different aspects are provided in the sub-sections below. Additional information is available elsewhere (see Adeloye et al., 2016).
2.1 Genetic algorithm optimisation for hedging policy
Genetic Algorithms (GA) (see Michalewicz, 1992; Wardlaw and Sharif, 1999) were used for optimising the hedging policies because of its various advantages, including their potential to search the solution from population of points (not a single point), its use of objective function information itself (not any derivatives), and its use of probabilistic transition rules. For these reasons, GA have been widely used for solving complex optimisation problems in various branches of science including water resources. The objective function for the optimisation was:
subject to the reservoir mass balance equation constraint:
Other constraints determine the release decision and are operating-policy-specific. For example for single stage hedging:
Let total available water, WA
where St and St+1 are reservoir storage at the beginning and the end of time period t; Qt is the inflow during time period t; Et is the net evaporation during time period t; ERt is excess release during time period t; N is the total number of periods; URCm and LRCm are the ordinates of the upper and lower rule curves for the month m; CRCm is the ordinate of the critical rule curve for the month m; and all other symbols are as defined previously.
For the single stage hedging, the decision variables for the optimisation are the CRC ordinates for each month m of the year, and αm; are the corresponding monthly rationing ratios. Where hedging is static, the rationing ratio is a constant value α; for seasonal rationing, each of the four seasons will be represented by a constant rationing ratio . Thus, the number of decision variables is 13 in the case of constant hedging, 24 in the case of monthly dynamic hedging and 16 for seasonal hedging. For two stage hedging, there will be two critical rule curves, making the associated number of decision variables to be 26 (constant hedging), 48 (monthly hedging) or 32 (seasonal hedging). The GA optimisation involved the usual selection, crossover and mutation operations. A real-value coding was used with the following parameters: crossover fraction = 0.8; mutation rate = 0.01; number of elite children = 2. The genetic operations were repeated for 500 generations.
2.2 Climate change Impacts on reservoir inflows
The assessment of the effects of projected climate change on reservoir inflows employed the delta perturbation approach (see Anandhi et al., 2011; Vicuna et al., 2012) in order to avoid the notorious uncertainties associated with GCM projections and their downscaling. The delta perturbations in temperature ΔT (∘C) ranged from 0–5 ∘C, step of 1 ∘C, i.e. [0, 5; 1] while the corresponding perturbations in precipitation ΔP (%) were [−10, 10; 5]. These were applied to the Beas Basin historic temperature and precipitation data records respectively. The resulting series were then used to force a calibrated HYSIM catchment model (Manley and WRA, 2006) to derive the corresponding reservoir inflow series.
2.3 Reservoir behaviour simulation and performance indices
Reservoir simulation used the reservoir mass balance equation and associated constraints shown in Eqs. (1a–e). At the end of the simulation, reservoir key performance indicators were evaluated as follows (McMahon and Adeloye, 2005; Sandoval-Solis et al., 2011):
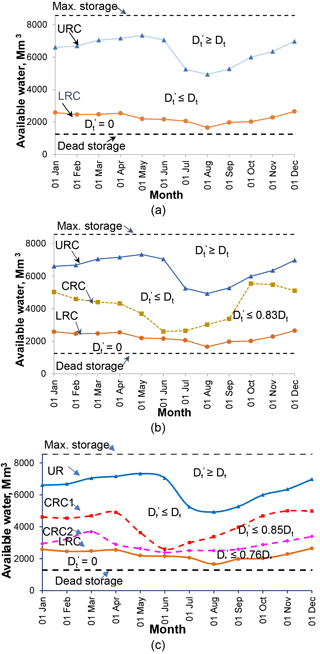
Figure 5GA optimised rule curves (a) No hedging; (b) Single-stage constant hedging; (c) two-stage constant hedging.
a. Reliability
b. Resilience, ϕ
c. Vulnerability, η
d. Sustainability, λ
where Ns is the number of periods in which , fs is the number of continuous failure sequences and fd is the number of failure durations.
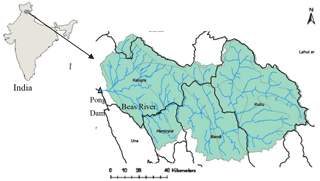
The Pong dam (and its reservoir, see Fig. 3) is located at longitude 76∘05 E and latitude 32∘05 01 N, drains a catchment area of 12 561 km2, out of which the permanent snow catchment is 780 km2 (Jain et al., 2007). The active storage capacity of the reservoir is 7051 Mm3, which is primarily used for irrigating 1.6×10⁶ ha total area dedicated for the cultivation of rice, wheat and cotton, although the released water first passes through turbines for hydropower generation. Consequently, the focus of the current study is the irrigation demand.
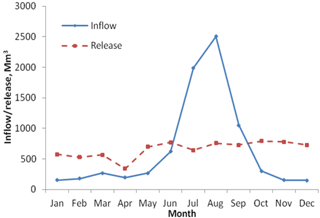
Monthly reservoir inflow and irrigation demands from January 2000 to December 2008 (9 years) were available for the study. The historic mean annual runoff (MAR) at dam site is 8485 Mm3 (annual coefficient of variation is 0.225) and the seasonal distribution of the annual runoff is shown in Fig. 4.
The genetic algorithm (GA) optimised basic (i.e. without water hedging) rule curves were developed by Adeloye et al. (2016) for the reservoir as part of the wider study and are shown in Fig. 5a. These rule curves formed the bases for the development of the hedging-integrated rule curves as outlined in Sect. 2.1.
4.1 Climate change impacts on reservoir inflows
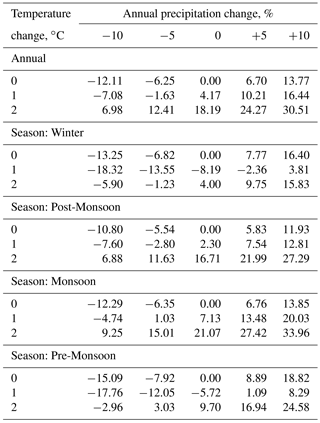
Table 1 summarises the effects of the projected climate change perturbations on the reservoir inflow. As expected, more inflows are recorded as the catchment precipitation increases. Table 1 also shows that the runoff increased for all the temperature increases even when the precipitation had remained unchanged. As noted earlier, there are significant glaciers and seasonal snow in the upper part of the Beas catchment. The simulated increase in the runoff at high temperatures is due to the additional runoff generated from the melting of the snow/glaciers at elevated temperatures, which appeared to have more than compensated for any evapotranspiration increases.
4.2 Optimised Rule Curves
The optimised hedging integrated rule curves are shown in Fig. 5b and c; as noted previously, Fig. 5a is the basic, no-hedging set of rule curves. While Fig. 5b is single stage, Fig. 5c has two stages; both policies, however, used constant hedging (or rationing ratios).
The CRC that triggers the water rationing in Fig. 5b lies everywhere between the URC and LRC as expected and allows attempting to supply the full demand over a very wide range of water availability in the system during the high flow monsoon (May–September) season. The range of water availability in which the full supply can be attempted is much narrower for the drier, post-monsoon periods. Water rationing will occur whenever the available water falls below the CRC. However, as shown in Fig. 5b when water rationing takes place, only 17 % of the full demand is cut back, leaving 83 % of the full demand being attempted. This deliberate cut-back is moderate and is thus not expected to cause undue hardship for water users.
In Fig. 5c with two hedging stages, the upper critical curve is everywhere lower than the single critical curve of Fig. 5a, implying that more water will be available for release in the upper hedging zone of the two stage hedging policy than from the single hedging zone of Fig. 5a. This has been confirmed by the value of the optimised rationing ratio for the upper hedging zone of Fig. 5c, which at 85 % is higher than the 83 % optimised for the single stage hedging policy of Fig. 5a. As expected, the lower critical curve (and hedging zone) has intensified the rationing in response to the dwindling water stock by allowing only 76 % of the full demand to be attempted whenever the available water falls into the lower hedging zone. As noted previously, hedging is expected to temper reservoir vulnerability and any evidence of this will be reported in the next section when the reservoir performance is discussed. However, a re-assuring aspect of the hedging policies is that the amounts of water cut back represented by the optimised rationing ratios as obtained herein are modest and lesser than the 25 % tolerable shortage suggested by Fiering (1982).
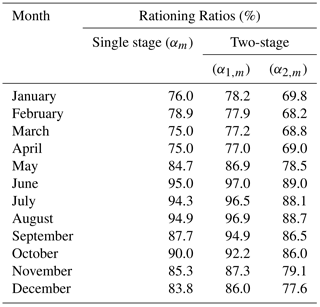
The hedging policies in Fig. 5 relate to static, i.e. constant rationing ratios situation; however, a further aim of the work had been to investigate dynamically varying rationing ratios. Although both the monthly and seasonally varying options were investigated, only the results of the monthly are presented to save space. The CRC for the dynamically varying hedging policies are shown in Fig. 6a (single stage) and 6b (two-stage), respectively; their associated optimised supply limits (or rationing ratios) are shown in Table 2. Unlike the static situation for which the rationing ratio was constant, dynamic rationing has varied monthly, reflecting the relative water abundance in the various months.
Thus, as seen in Fig. 6a for example, the proportion of the demand supplied in the monsoon months was highest, almost approaching 100 %. As the available water reduces, e.g. during the winter and pre-monsoon seasons, the proportion of the demand supplied attained its least value of < 80 %. Another feature of the dynamic scheme is that the optimised critical storage curves that trigger hedging have also responded to the reservoir inflow situation in that during the low inflow winter season, the curves are below those for the static case ensuring that the water available for meeting the full demand is more and hence occasions when reductions will be needed will be few. On the other hand during the high inflow, monsoon seasons, the critical curves for the dynamic policies are higher than those of constant hedging, meaning that rationing will occur more frequently albeit the cut back amounts would be very small since the associated rationing ratios are close to unity. For the 2-stage policy in Fig. 6b, the monthly rationing ratios presented in Table 2 behave as expected, with those for the lower zone being less than those for the upper zone.
The implication of this is that the dynamic policies will offer improvement in performance over the static policy but the question remains by how much? The attractiveness of the dynamic policies therefore would stem from their effect on the system performance: a very significant improvement in performance over the static policy case would be required to justify the preference for the former.
4.3 Reservoir performance
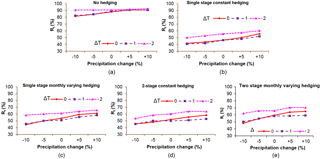
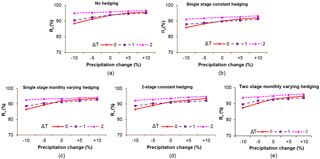
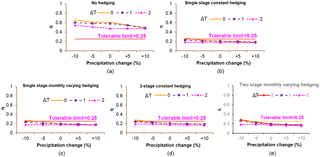
To save space, discussion on the performance evaluation will be limited to the reliability (time- and volume-based) and the vulnerability. Figures 7–9 show the results of the performance evaluation using: time-based reliability (Fig. 7); volume-based reliability (Fig. 8) and the vulnerability (Fig. 9).
With no hedging, the time-based reliability is high under existing conditions but decreases when less water is projected by climate change, and increases when more inflow is projected. The effect of temperature rise on the inflow contributions from melting ice and snow has manifested in the time reliability, with the projected 2 ∘C rise in temperature in particular resulting in the highest reliability. The effect of hedging is to cause the time-reliability to deteriorate significantly. This is to be expected given that hedging deliberately introduces additional failures (i.e. occasions of non-supply of full demand). The greatest reduction in the time reliability occurred with the static, constant hedging policy where the time reliability reduced by almost 50 % relative to the no-hedging situation. When hedging is dynamically altered, the deterioration in the time reliability is reduced but only marginally. The 2-stage policy also provided marginal improvements in the Rt when compared to the single stage policy.
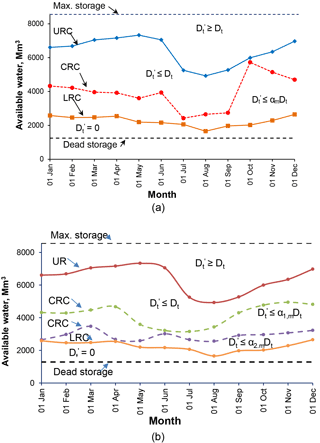
Figure 6GA optimised rule curves (a) Single-stage monthly varying hedging; (b) two-stage monthly varying hedging.
The volume reliability shown in Fig. 8 has confirmed that Rv≥Rt and that Rv is not as drastically affected by hedging as Rt. The Rv situation improved with both the dynamic and 2-stage policies but this improvement was rather marginal.
The vulnerability (or maximum single-period water shortage) is shown in Fig. 9. Also shown on the plots is the horizontal line for a vulnerability of 25 % which, as remarked previously, represents the suggested tolerable shortage limit for most water users. With no hedging, the vulnerability is high (approximately 60 %) under existing conditions and intensifies to about 65 % when the catchment becomes drier due to projected reduction in precipitation by climate change. The vulnerability is tempered for wetter conditions but even for the most benign of these, i.e. projected 10 % rise in precipitation, the recorded vulnerability was still above 47 %, much higher than the 25 % tolerable vulnerability threshold suggested by Fiering (1982).
The dramatic effect of hedging on the vulnerability can be seen in the evaluations for both the static and the dynamic policies. For example for the static policy, hedging reduced the vulnerability to below the 25 % from the high of 65 %. It should be noted that only 17 % of the demand was hedged back when necessary by the single-stage, constant rationing ratio policy; yet what these results show is that such modest reductions that can be easily tolerated by most water users have almost eliminated the calamitous 65 % water shortage that could occur without hedging on some occasions. As was the case with the other performance indices, the vulnerability was slightly less relative to the single stage, constant rationing policy when the dynamic (monthly) and 2-stage policies were deployed. This reduction in vulnerability does not justify the extra efforts in developing and deploying the more complicated policies.
This study has developed optimised static and dynamic zone-based hedging policies for the Pong reservoir in India and compared its performance with that of a basic, zone-based policy that incorporates no hedging as a way of testing the usefulness of hedging in moderating the vulnerability of climate-change induced water shortages. GA was used to optimise the decision variables for the policies, including the rationing ratios and the target storage values that trigger hedging in each month of the year. The optimisation carried out considered 1-stage and 2-stage hedging policies and rationing ratios that were either static (constant all year round) or dynamic (i.e. varying monthly or seasonally). A delta perturbation approach was used to develop alternative reservoir inflow responses to plausible changes in temperature and precipitation. Subsequent reservoir simulations to test the effectiveness of the various operating policies showed that without hedging, performance of the reservoir (reliability- time- and volume-based and vulnerability) deteriorated significantly when the reservoir inflow is projected to reduce due to climate change; the opposite occurred when the future is wetter.
The vulnerability was particularly high, reaching over 60 %. However, as hedging was introduced, the vulnerability reduced significantly because the modest, deliberate cut-backs during hedging prevented the occurrence of large, single-period water shortages. Indeed, for both the static and dynamic hedging policies, the vulnerability was reduced to below 25 % even for the worst (direst) climate change projections. However, because hedging deliberately fails to meet full demand on occasions, the occurrences of failures increased, which led to significant deterioration in the evaluated time-based reliability. However, since the amount of water shortages for most of these additional shortage periods was low-to-moderate, the overall volumetric reliability of the reservoir was practically unaffected. This is re-assuring since what should matter most in reservoir operation is not the number of failure occasions but the deficit sustained during such failures. All this confirms that water resources systems have inherent buffering capacity that if well-harnessed through improved operating practices such as the hedging policies developed in this work will offer effective and low-cost mitigation for climate change induced water shortages.
In terms of the overall system's performance, the dynamic hedging policies outperformed the constant hedging policy but only marginally. The same marginal improvement was recorded for the 2-stage policy when its performance was juxtaposed with that of the 1-stage policy. Given the complexity associated with the development and deployment of the dynamic and multi-stage policies, the marginal improvement recorded here is not sufficient reason for preferring the dynamic policy for reservoir operation.
The data used in developing the results presented in this paper are openly available at https://doi.org/10.17861/5d02c025-f457-4511-a724-487407932495 (Adeloye, 2017).
The authors declare that they have no conflict of interest.
This article is part of the special issue “Innovative water resources management – understanding and balancing interactions between humankind and nature”. It is a result of the 8th International Water Resour. Manage. Conference of ICWRS, Beijing, China, 13–15 June 2018.
The work reported here was funded by the UK-NERC (Project NE/N016394/1) –
“Sustaining Himalaya Water Resources in a Changing Climate (SusHi-Wat)” –
as part of the UK-India Newton-Bhabha Sustainable Water Resources (SWR)
thematic Programme.
Edited by: Wenchao Sun
Reviewed by: two anonymous referees
Adeloye, A. J., Soundharajan, B.-S., Ojha, C. S. P., and Remesan, R.: Effect of hedging-integrated rule curves on the performance of the Pong reservoir (India) during scenario-neutral climate change perturbations, Water Resour. Manage., 30, 445–470, https://doi.org/10.1007/s11269-015-1171-z, 2016.
Adeloye, A. J.: Simulated historic and climate-change-perturbed runoff inflow series data for Pong reservoir, available at: https://doi.org/10.17861/5d02c025-f457-4511-a724-487407932495 (last access: February 2018), 2017.
Anandhi, A., Frei, A., Pierson, D. C., Schneiderman, E. M., Zion, M. S., Lounsbury, D., and Matonse, A. H.: Examination of change factor methodologies for climate change impact assessment, Water Resour. Res., 47, W03501, https://doi.org/10.1029/2010WR009104, 2011.
Chiamsathit, C., Adeloye, A. J., and Soundharajan, B.: Assessing competing policies at Ubonratana reservoir, Thailand, Proceedings of the ICE-Water Management, 167, 551–560, 2014.
Eum, H., Kim, Y., and Palmer, R.: Optimal Drought Management Using Sampling Stochastic Dynamic Programming with a Hedging Rule, J. Water Resour. Plann. Manage., 137, 113–122, 2011.
Fiering, M. B.: Estimates of resilience indices by simulation, Water Resour. Res., 18, 41–50, 1982.
Fowler, H. J., Kilsby, C. G., and O'Connell, P. E.: Modeling the impacts of climatic change and variability on the reliability, resilience and vulnerability of a water resource system, Water Resour. Res., 39, 1222, https://doi.org/10.1029/2002WR001778, 2003.
Jain, S. K., Agarwal, P. K., and Singh, V. P.: Hydrology and water resources of India, Springer, the Netherlands, 2007.
Li, L., Xu, H., and Chen, X.: Streamflow forecast and reservoir operation performance assessment under climate change, Water Resour. Manage., 24, 83–104, 2009.
Manley, R. E. and Water Resources Associates (WRA): A guide to using HYSIM, R. E. Manley and water resources associates Ltd., 2006.
McMahon, T. A. and Adeloye, A. J.: Water Resources Yield, Water Resources Publications, Littleton, CO, USA, 2005.
Michalewicz, Z.: Genetic algorithms + data structures = evolution programs, Springer, New York, 1992.
Nawaz, N. R. and Adeloye, A. J.: Monte Carlo assessment of sampling uncertainty of climate change impacts on water resources yield in Yorkshire, England, Climatic Change, 78, 257–292, 2006.
Sandoval-Solis, S., Mckinney, D. C., and Loucks, D. P.: Sustainability index for water resources planning and management, J. Water Resour. Plann. Manage., 137, 381–389, 2011.
Vicuna, S., McPhee, J., and Garreaud, R. D.: Agriculture vulnerability to climate change in a snowmelt-driven basin in semiarid Chile, J. Water Resour. Plann. Manage. ASCE, 138, 431–441, 2012.
Wardlaw, R. and Sharif, M.: Evaluation of genetic algorithms for optimal reservoir operation, J. Water Resour. Plann. Manage. ASCE, 125, 25–33, 1999.
Yin, X.-A., Mao, X.-F., Pan, B.-Z., and Zhao, Y.-W.: Suitable range of reservoir storage capacities for environmental flow provision, Ecol. Eng., 76, 122–129, https://doi.org/10.1016/j.ecoleng.2014.04.002, 2015.


