the Creative Commons Attribution 4.0 License.
the Creative Commons Attribution 4.0 License.
 | 05 Jun 2018
Climate change impact on streamflow in large-scale river basins: projections and their uncertainties sourced from GCMs and RCP scenarios
Yeugeniy M. Gusev
Evgeny E. Kovalev
Georgy V. Ayzel
Climate change impact on river runoff was investigated within the framework of the second phase of the Inter-Sectoral Impact Model Intercomparison Project (ISI-MIP2) using a physically-based land surface model Soil Water – Atmosphere – Plants (SWAP) (developed in the Institute of Water Problems of the Russian Academy of Sciences) and meteorological projections (for 2006–2099) simulated by five General Circulation Models (GCMs) (including GFDL-ESM2M, HadGEM2-ES, IPSL-CM5A-LR, MIROC-ESM-CHEM, and NorESM1-M) for each of four Representative Concentration Pathway (RCP) scenarios (RCP2.6, RCP4.5, RCP6.0, and RCP8.5). Eleven large-scale river basins were used in this study. First of all, SWAP was calibrated and validated against monthly values of measured river runoff with making use of forcing data from the WATCH data set and all GCMs' projections were bias-corrected to the WATCH. Then, for each basin, 20 projections of possible changes in river runoff during the 21st century were simulated by SWAP. Analysis of the obtained hydrological projections allowed us to estimate their uncertainties resulted from application of different GCMs and RCP scenarios. On the average, the contribution of different GCMs to the uncertainty of the projected river runoff is nearly twice larger than the contribution of RCP scenarios. At the same time the contribution of GCMs slightly decreases with time.
- Article
(1107 KB) - Full-text XML
- BibTeX
- EndNote


The most common approach for assessing the impact of climate change on river runoff is to run regional hydrological models (RHMs) or global hydrological models (GHMs) driven by meteorological projections from General Circulation Models (GCMs). In so doing, the obtained hydrological projections inevitably contain uncertainties. Many modeling studies have been carried out to explore uncertainties in projected hydrological variables (e.g., Wilby and Harris, 2006; Gosling et al., 2011; Vetter et al., 2017; Nasonova et al., 2018), according to which the following sources of uncertainties can be distinguished with respect to climatic runoff: scenarios of greenhouse-gas emissions to the atmosphere; application of different GCMs for simulating meteorological projections; downscaling and post-processing bias-correction techniques applied for GCMs' outputs; hydrological models applied for hydrological projections. In the latter case, uncertainties can be associated with differences in model structure, complexity, representation of hydrological processes, spatial and temporal resolution, estimation and calibration of model parameters. Increased attention to assessment of different types of uncertainties can be explained by the need to search a predictive range of hydrological models.
As it was shown in Vetter et al. (2017) the results of many studies have indicated that GCMs structure represent the main source of uncertainty in projected river runoff, however, in some regions and seasons other sources of uncertainties can also play an important role. It was concluded that studying the contribution of different sources of uncertainties to the overall uncertainty of hydrological projections should be continued with involvement of large amount of river basins located in different parts of the Earth under a wide variety of climatic conditions. This was done within the framework of the second phase of the Inter-Sectoral Impact Model Intercomparison Project (ISI-MIP2) (Warszawski et al., 2013; Krysanova and Hattermann, 2017).
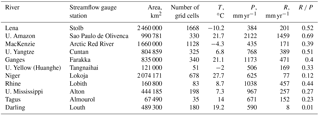
Table 1River basins with their area and the number of calculational grid cells; gauge stations; averaged over 1971–2000 air temperature T, precipitation P, river runoff R and runoff ratio R ∕ P. The values of T, P and R are taken from Krysanova and Hattermann (2017).
The present work was carried out when participating in the aforementioned project. The main tool used in the given study for streamflow simulations is the land surface model (LSM) SWAP (Soil Water – Atmosphere – Plants) in contrast to hydrological models participated in the ISI-MIP2 and listed in Krysanova and Hattermann (2017).
The aim of the present paper is to investigate the contribution of different emission scenarios and different GCMs to the uncertainty range of the projected changes in runoff from 11 river basins (covering different climatic conditions on five continents) due to possible climate change during the 21st century.
Eleven river basins provided within the ISI-MIP2 were used in this study. The basins are located in different regions of the globe under different natural conditions: the Rhine and Tagus in Europe; the Ganges, Lena, Upper Yellow and Upper Yangtze in Asia, the Niger in Africa; the Mackenzie and Upper Mississippi in North America, the Upper Amazon in South America and the Darling in Australia. The main characteristics of the selected river basins are given in Table 1.
For model simulations the basins were schematized as a set of regular grid cells with a spatial resolution 0.5∘ × 0.5∘ in latitude and longitude connected by a river network (see Gusev et al., 2017, for details). The number of calculational grid cells for each river basin is also presented in Table 1.
Input data for the SWAP model includes the land surface parameters and meteorological forcing data (incoming longwave and shortwave radiation, air temperature and humidity, precipitation, wind speed, and air pressure) for each calculational grid cell.
For model calibration and validation, daily values of forcing data were taken from the WATCH data set (Weedon et al., 2011) for the period of 1970–2001.
For hydrological projections, daily values of meteorological outputs simulated by five GCMs (GFDL-ESM2M, HadGEM2-ES, IPSL-CM5A-LR, MIROC-ESM-CHEM, and NorESM1-M) for four Representative Concentration Pathway scenarios (RCP: RCP2.6, RCP4.5, RCP6.0, and RCP8.5) for 2006–2099 were provided by ISI-MIP2 organisers (Krysanova and Hattermann, 2017). All these meteorological projections were subject to a post-processing bias correction to the WATCH data performed within the framework of the ISI-MIP project. A detailed description of the bias-correction technique can be found in Hempel et al. (2013).
A priori model parameters were derived on the basis of information from the global ECOCLIMAP data set.
More details on data used can be found in this issue (Gusev et al., 2018).
3.1 The SWAP model
River runoff was simulated by the land surface model SWAP. It is a spatially distributed physically-based model describing heat and water exchange at the land surface – atmosphere interface. Different versions of SWAP were developed for unfrozen soil, seasonally frozen soils, and permafrost. SWAP operates at different scales: from local to global. Model description and the results of its successful validation were detailed in a number of publications (e.g., Gusev and Nasonova, 2004, 2010; Gusev et al., 2008).
3.2 Calibration and validation
Here, SWAP was calibrated and validated against monthly values of measured river runoff from each basin with making use of forcing data from the WATCH data set for 1970–2001. Calibration was performed for eight years (different for different rivers in dependence of available measured runoff); the rest years were used for model validation. The details of the calibration (including a calibration technique, objective function and list of calibrated parameters) can be found in Gusev et al. (2017).
The agreement between simulated (with the WATCH data set) and observed streamflow for each river basin was estimated at monthly basis using several goodness-of-fit statistics: systematic error Bias (equalled to the difference between the simulated and observed mean values of river runoff):
and the Nash and Sutcliffe coefficient of efficiency NS:
where xcal and xobs are calculated and observed values of a variable x (here, monthly river runoff), Ω is a discrete sample set of the variable x.
The optimal values of model parameters obtained for each river basin were then used for simulating river runoff by the SWAP model driven by meteorological forcing data simulated by five GCMs for the historical period from 1971 to 2005. The simulated runoff was validated against measured one on an annual basis.
3.3 Projecting changes in river runoff and their uncertainties
For the future period (2006–2099), river runoff was simulated by the SWAP model forced by each of 20 meteorological projections (5 GCMs × 4 RCP scenarios). The prognostic period was divided into three parts: P1 (2006–2036), P2 (2037–2067) and P3 (2068–2099). The projected annual runoff was averaged over each period to obtain the climatic runoff. Changes in the climatic runoff obtained for each GCM, RCP scenario, and prognostic period Pi (i=1, 2, 3) were calculated as the difference between the projected runoff and historical runoff RGCM,H simulated by appropriate GCM and averaged over 1971–2005:
Relative changes were calculated as follows:
So, 20 values of % were obtained for each prognostic period. They were used for estimation mean value M and standard deviation SD. As it was shown in Gelfan et al. (2017), the interval (M ± 1.96 SD) can be treated as the index of hydrological projection uncertainty caused by both the climate model structural uncertainty and the climate scenario variability.
3.4 Contribution of GCM and RCP scenario uncertainties into hydrological projection uncertainty
The obtained relative changes in river runoff % allowed us to estimate their uncertainties resulted from application of various GCMs and RCP scenarios. For this purpose, for each prognostic period and each river, the range of variability of ΔR % as a difference between the largest and the smallest values was estimated:
If we use all 20 values of % for estimating the range (RangeGCM,RCP) we obtain uncertainty caused by both GCMs and climatic scenarios. Besides, we can calculate the variation ranges caused (1) only by a scatter among GCM's projections RangeGCM and (2) by a scatter due to different RCP scenarios RangeRCP. The former indicates the contribution of the climate model structural uncertainty into the hydrological uncertainty, while the latter is associated with the contribution of the climate scenario differences.
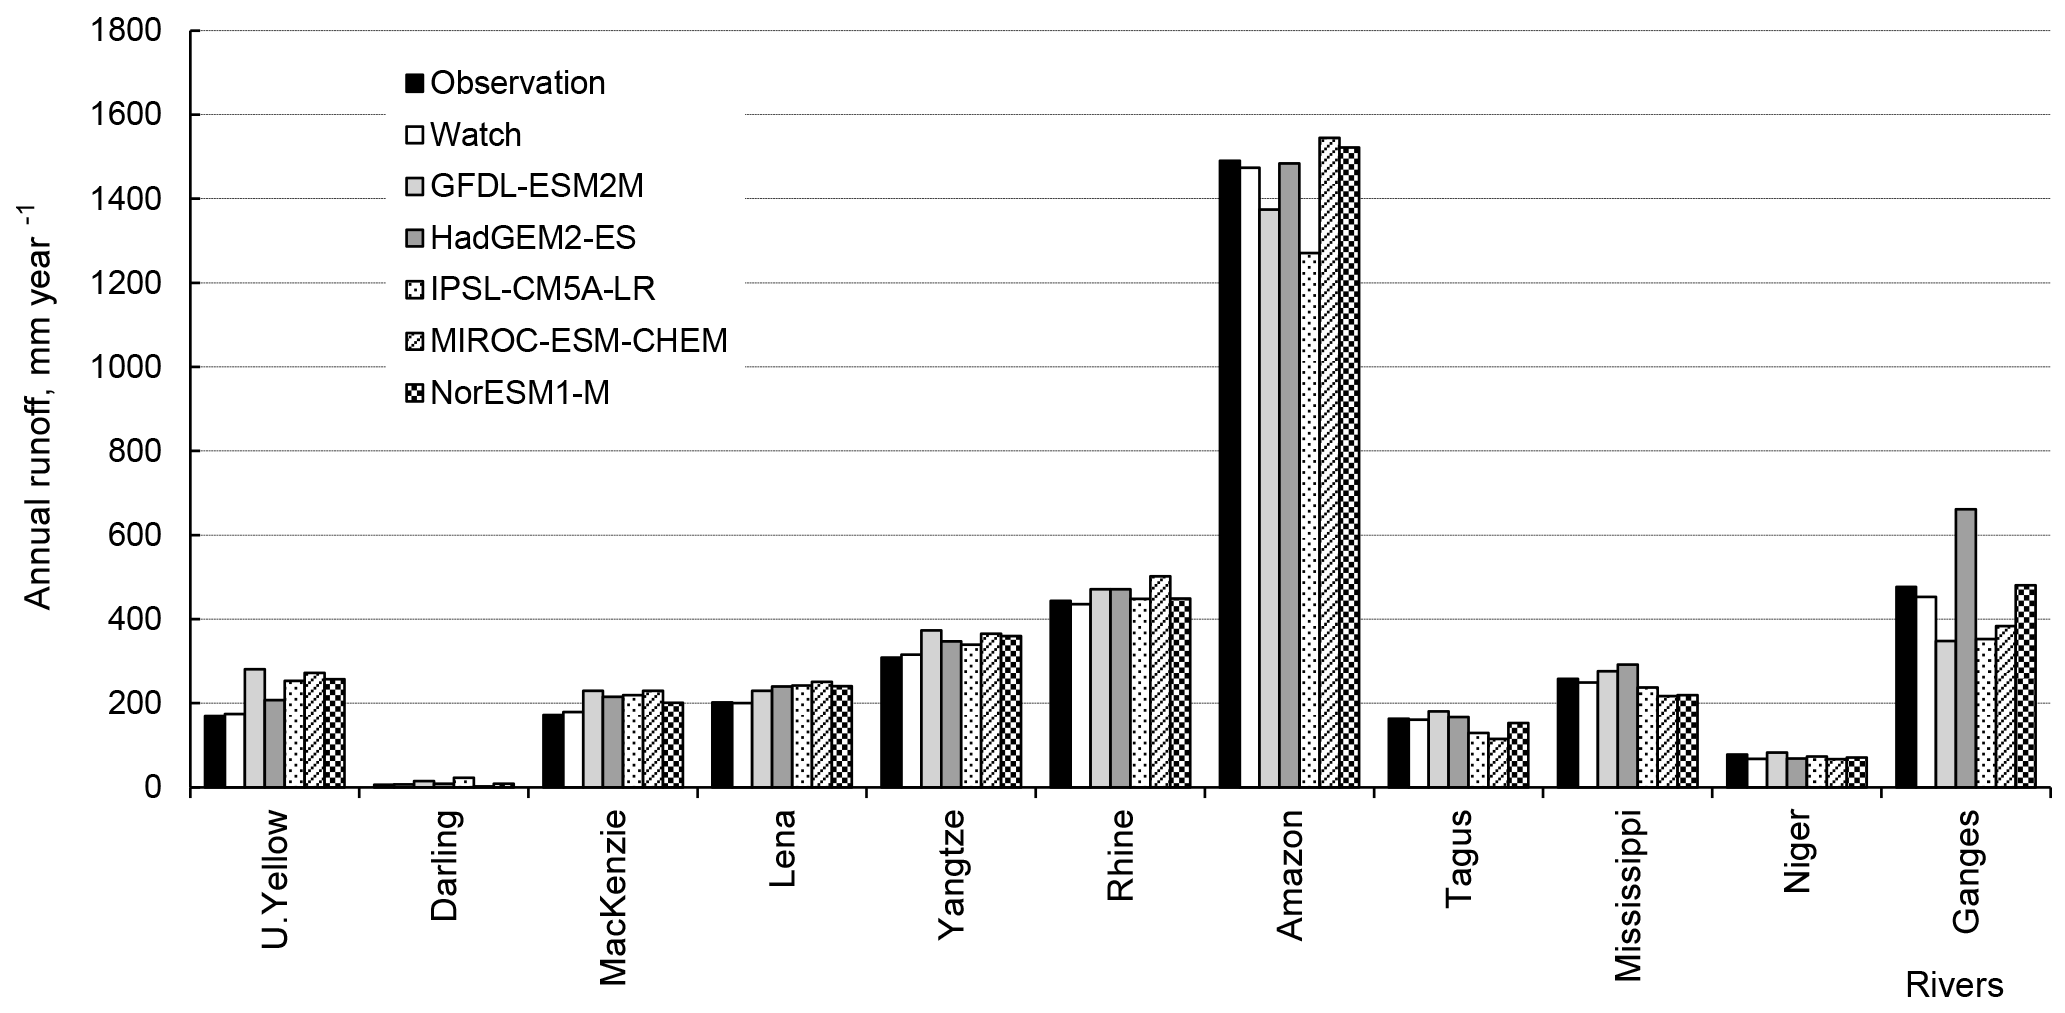
Figure 1Comparison of annual values of climatic river runoff measured and simulated by the SWAP model driven by forcing data from the WATCH data set and five GCMs.
4.1 Historical simulations of river runoff
Analysis of the results of simulation of river runoff from 11 basins by the SWAP model with a priori land surface parameters, derived from the ECOCLIMAP, and meteorological forcing data from the WATCH for the period of 1970–2001 has shown a poor agreement between measured and simulated monthly runoff: for most basins NS < 0, Bias ranged from 3 % (for the Upper Mississippi) to 340 % (for the Darling).
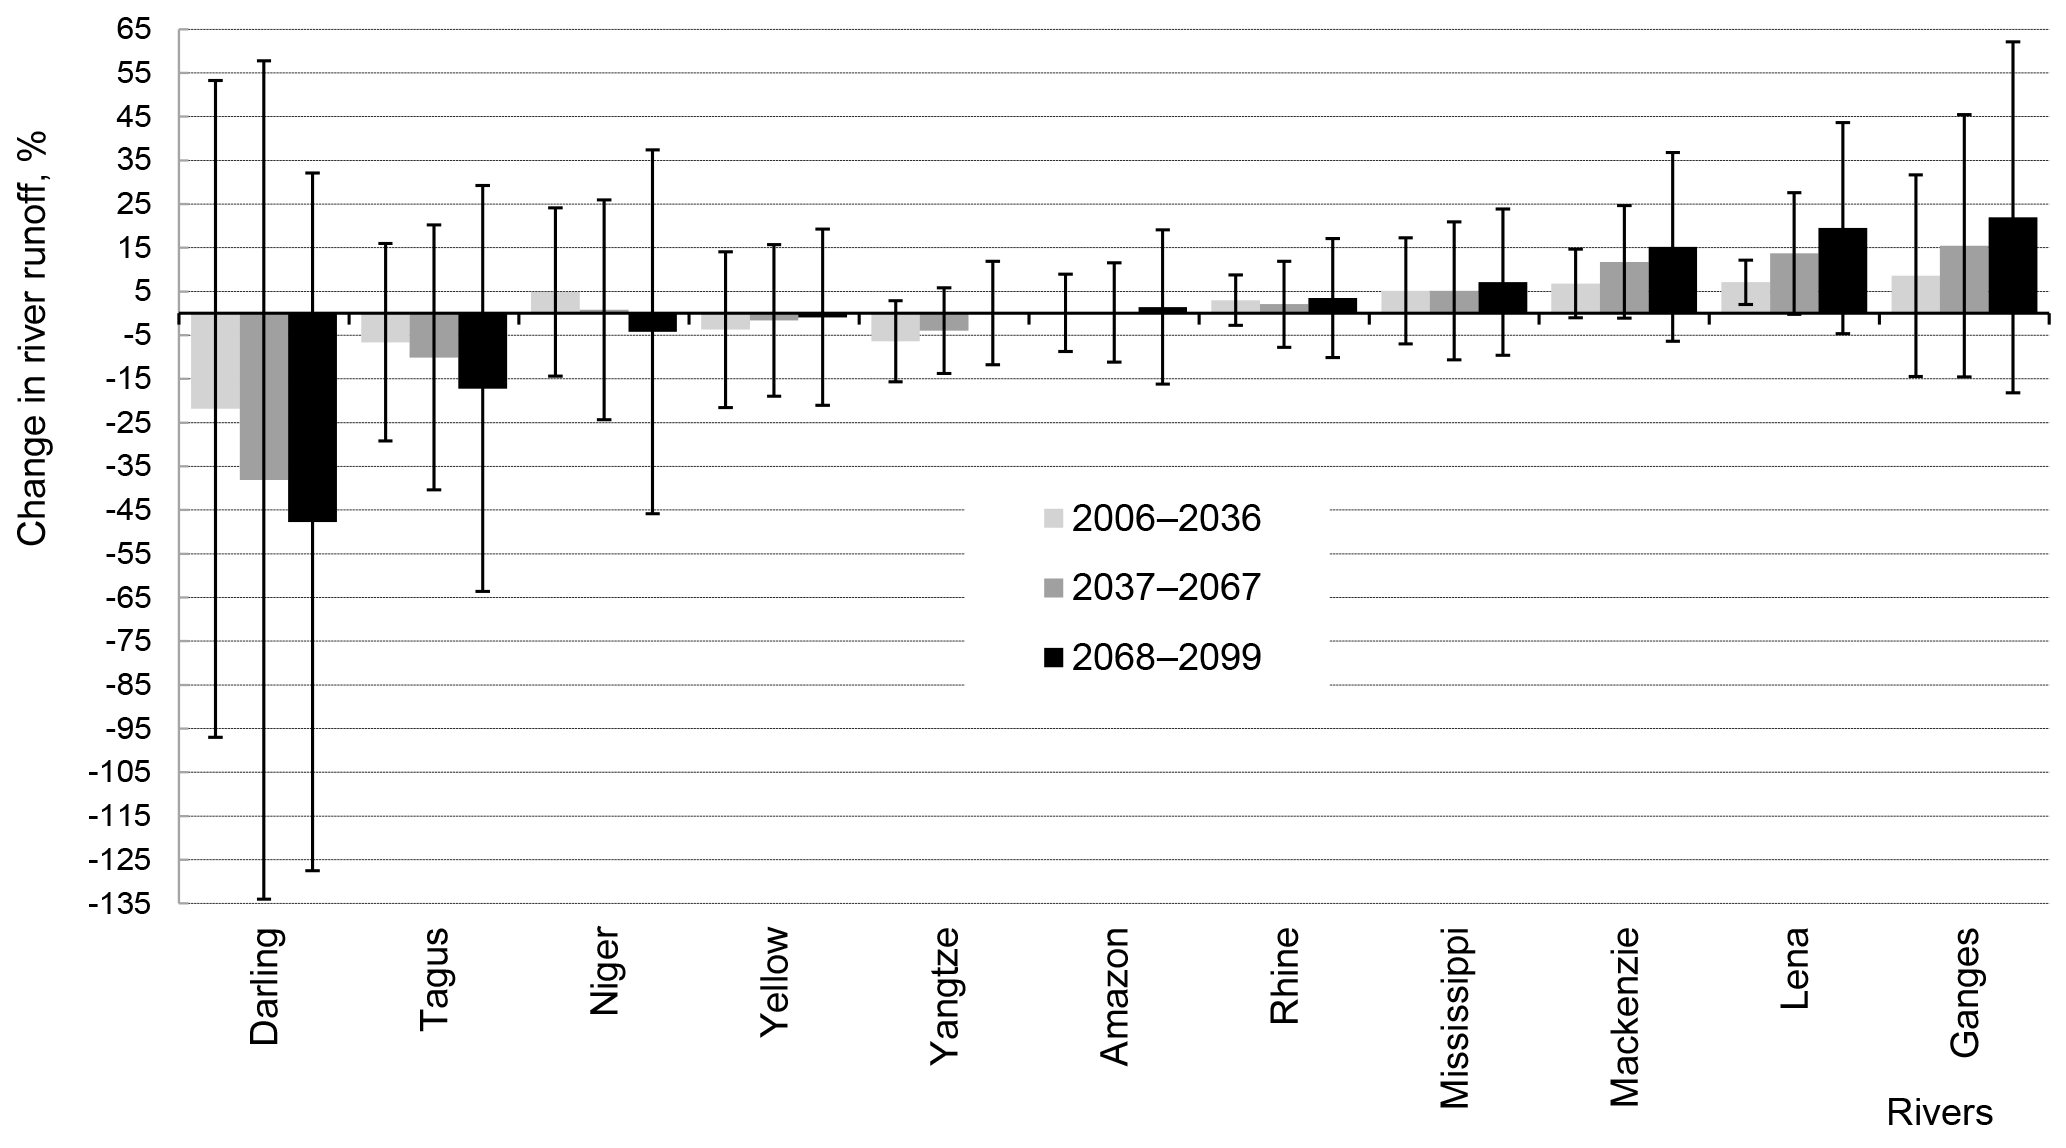
Figure 2The projected mean relative changes in annual values of climatic river runoff and their uncertainties caused by both the GCMs structural uncertainty and the RCP scenario differences. Bars are the intervals (M ± 1.96 SD) treated as hydrological uncertainty.
Calibration of the most influencing parameters against measured monthly river runoff resulted in significant improvement of SWAP performance with respect to goodness-of-fit statistics and the shape of hydrograph. For the calibration period, did not exceed 5 % for all rivers (mean value: 2.4 %), monthly NS varied from 0.68 to 0.95 (mean value: 0.85). For the validation period, did not exceed 13.8 % (mean value: 4.4 %), monthly NS varied from 0.58 to 0.90 (mean value: 0.78). Comparison of annual values of simulated and measured climatic runoff is given in Fig. 1 (compare “Observation” and “WATCH”).
The above results were considered as good and the obtained optimal values of model parameters were used for simulating river runoff by the SWAP model forced by meteorological data from five GCMs (bias-corrected to WATCH) for the period from 1971 to 2099. Historical simulations (for 1971–2005) were compared with measured annual river runoff and showed a satisfactory agreement (Fig. 1).
4.2 River runoff projections
Figure 2 depicts the projected relative changes in annual values of climatic river runoff % averaged over 5 GCMs and 4 RCP scenarios (corresponding to mean value M in Sect. 3.3). They are shown for three prognostic periods. As can be seen in Fig. 2, changes in river runoff are different (both in magnitude and sign) for different rivers. For most rivers, the changes in runoff increase by the end of the 21st century (with the exception of the Niger, Yellow, and Yangtze). For the Niger, the projected climatic precipitation increases during the first prognostic period and decreases during the last period. As a result, in the former case, climatic runoff has positive increment, while in the latter case the increment is negative (see Fig. 2). As to the Yellow and Yangtze rivers, the projected increase in climatic precipitation does not lead to runoff growth, because of increase in incoming radiation that results in that additional precipitation raises evapotranspiration rather than river runoff.
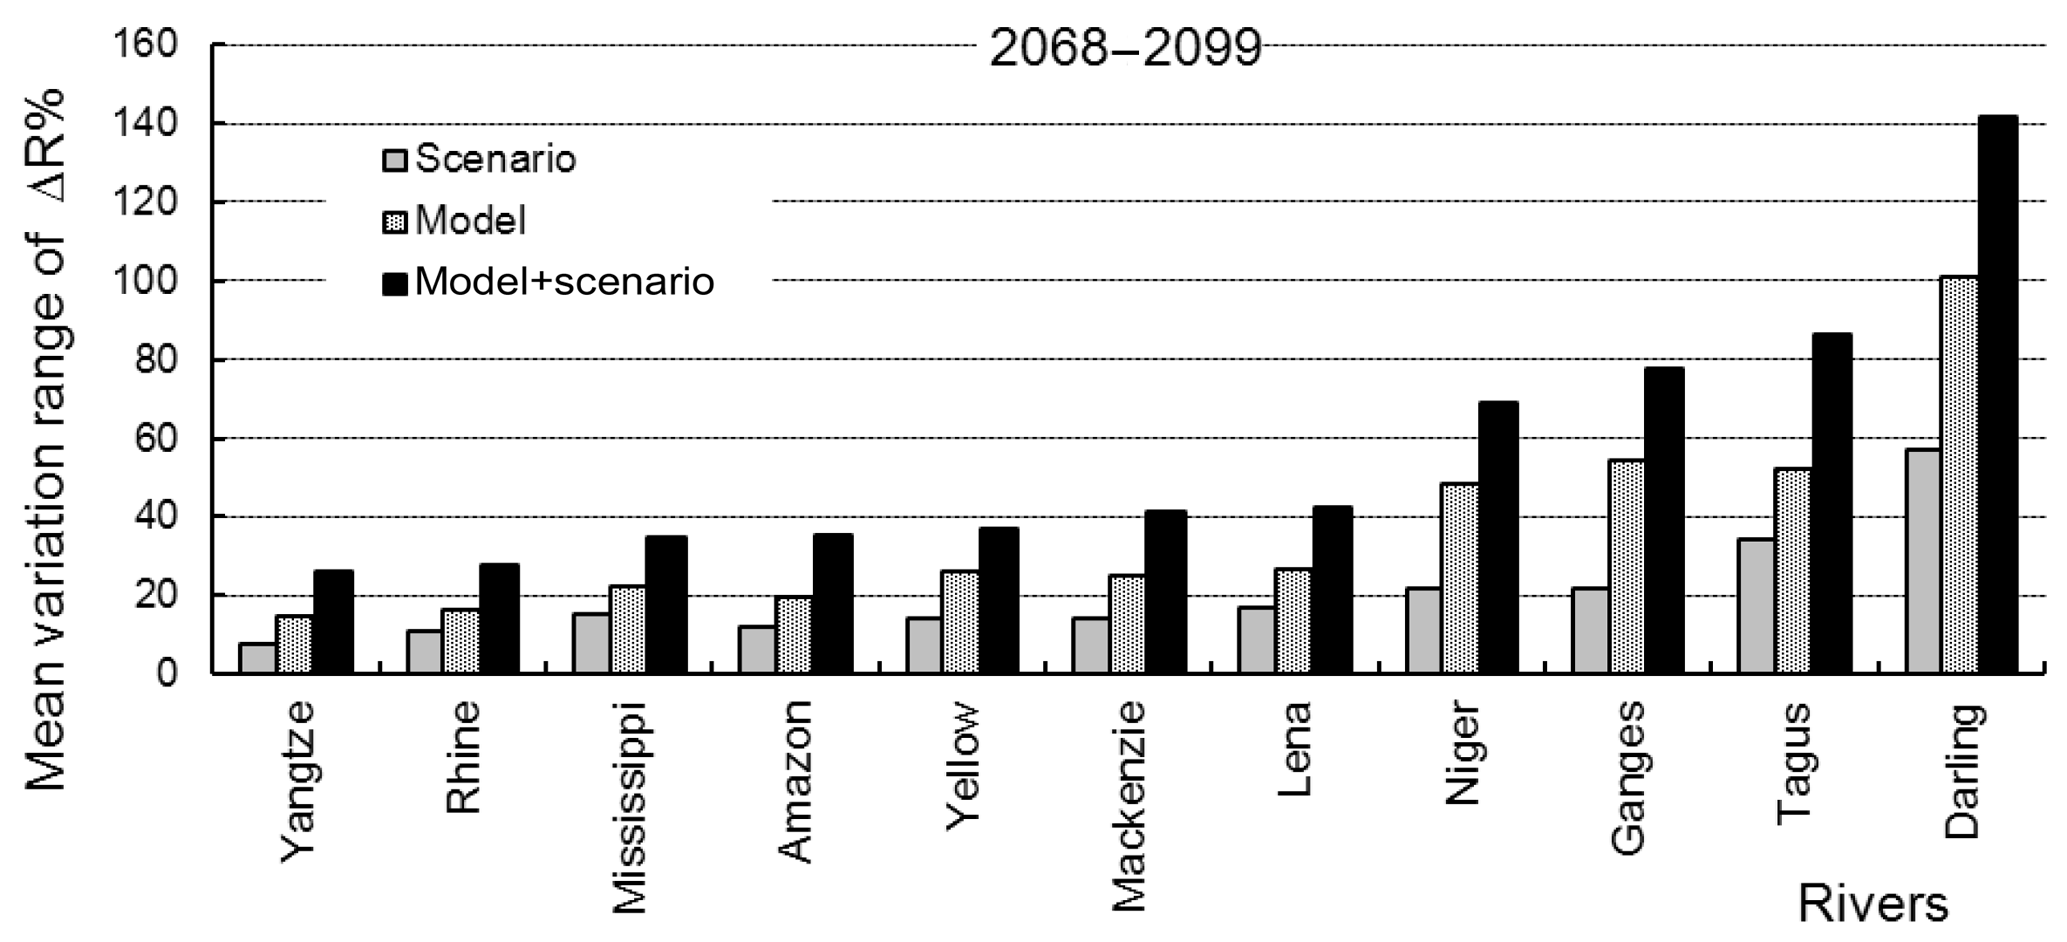
Figure 3Mean variation range of projected relative changes in climatic runoff from 11 river basins due to differences in RCP scenarios (“Scenario”), GCMs (“Model”), as well as both scenarios and models (“Model + Scenario”).
For some rivers (the Amazon, Rhine, Mississippi, Mackenzie, Lena, and Ganges), runoff will increase by 1.4–22 % by the end of the 21st century, while for the Niger, Tagus, and Darling runoff will decrease by 4–48 % (Fig. 2). This is in a good agreement with projected changes in climatic precipitation.
Bars in Fig. 2 show the intervals of uncertainty in the projected relative changes of river runoff caused by both the GCMs structural uncertainty and the climate scenario differences. The largest uncertainty was found for the Darling, then for the Tagus, Ganges and Niger. This can be explained by the largest variability of the projected changes in climatic precipitation for these rivers. As it was found, the coefficient of correlation between SD of relative changes in projected climatic precipitation (averaged over all GCMs and RCP scenarios) and corresponding changes in climatic river runoff is 0.84 for the last climatic period (2068–2099).
4.3 Contribution of GCMs and RCP scenarios into hydrological uncertainty
Figure 3 presents mean variation ranges of the projected relative changes in annual values of climatic runoff from 11 river basins due to differences in RCP scenarios (“Scenario”), GCMs (“Model”), as well as both scenarios and models (“Model + Scenario”) for the last prognostic period, which were calculated as RangeRCP, RangeGCM, and RangeGCM,RCP, respectively. The values of RangeRCP, RangeGCM, and RangeGCM,RCP represent uncertainties in the projected relative changes of annual values of climatic river runoff caused, respectively, by differences in RCP scenarios, by structural differences in GCMs and by joint influence of scenarios and GCMs.
As can be seen in Fig. 3, uncertainties sourced from joint influence of RCP and GCMs ranges from 26 to 142 % for different rivers. The contribution of RCP scenarios into the total uncertainty is smaller than that of the GCMs: RangeRCP varies from 8 to 57 %, while RangeGCM is within the interval from 15 to 101 %. The ratio of RangeGCM to RangeRCP varies ranges from 1.4 to 2.5 for different rivers.
Figure 4 shows the same variation ranges averaged over 11 rivers for the three prognostic periods. All ranges, i.e. all types of uncertainties, grow with time. As to the ratio of RangeGCM to RangeRCP, it varies from 2.1 for 2006–2036 to 1.8 for 2068–2099, i.e. decreases slightly with time.
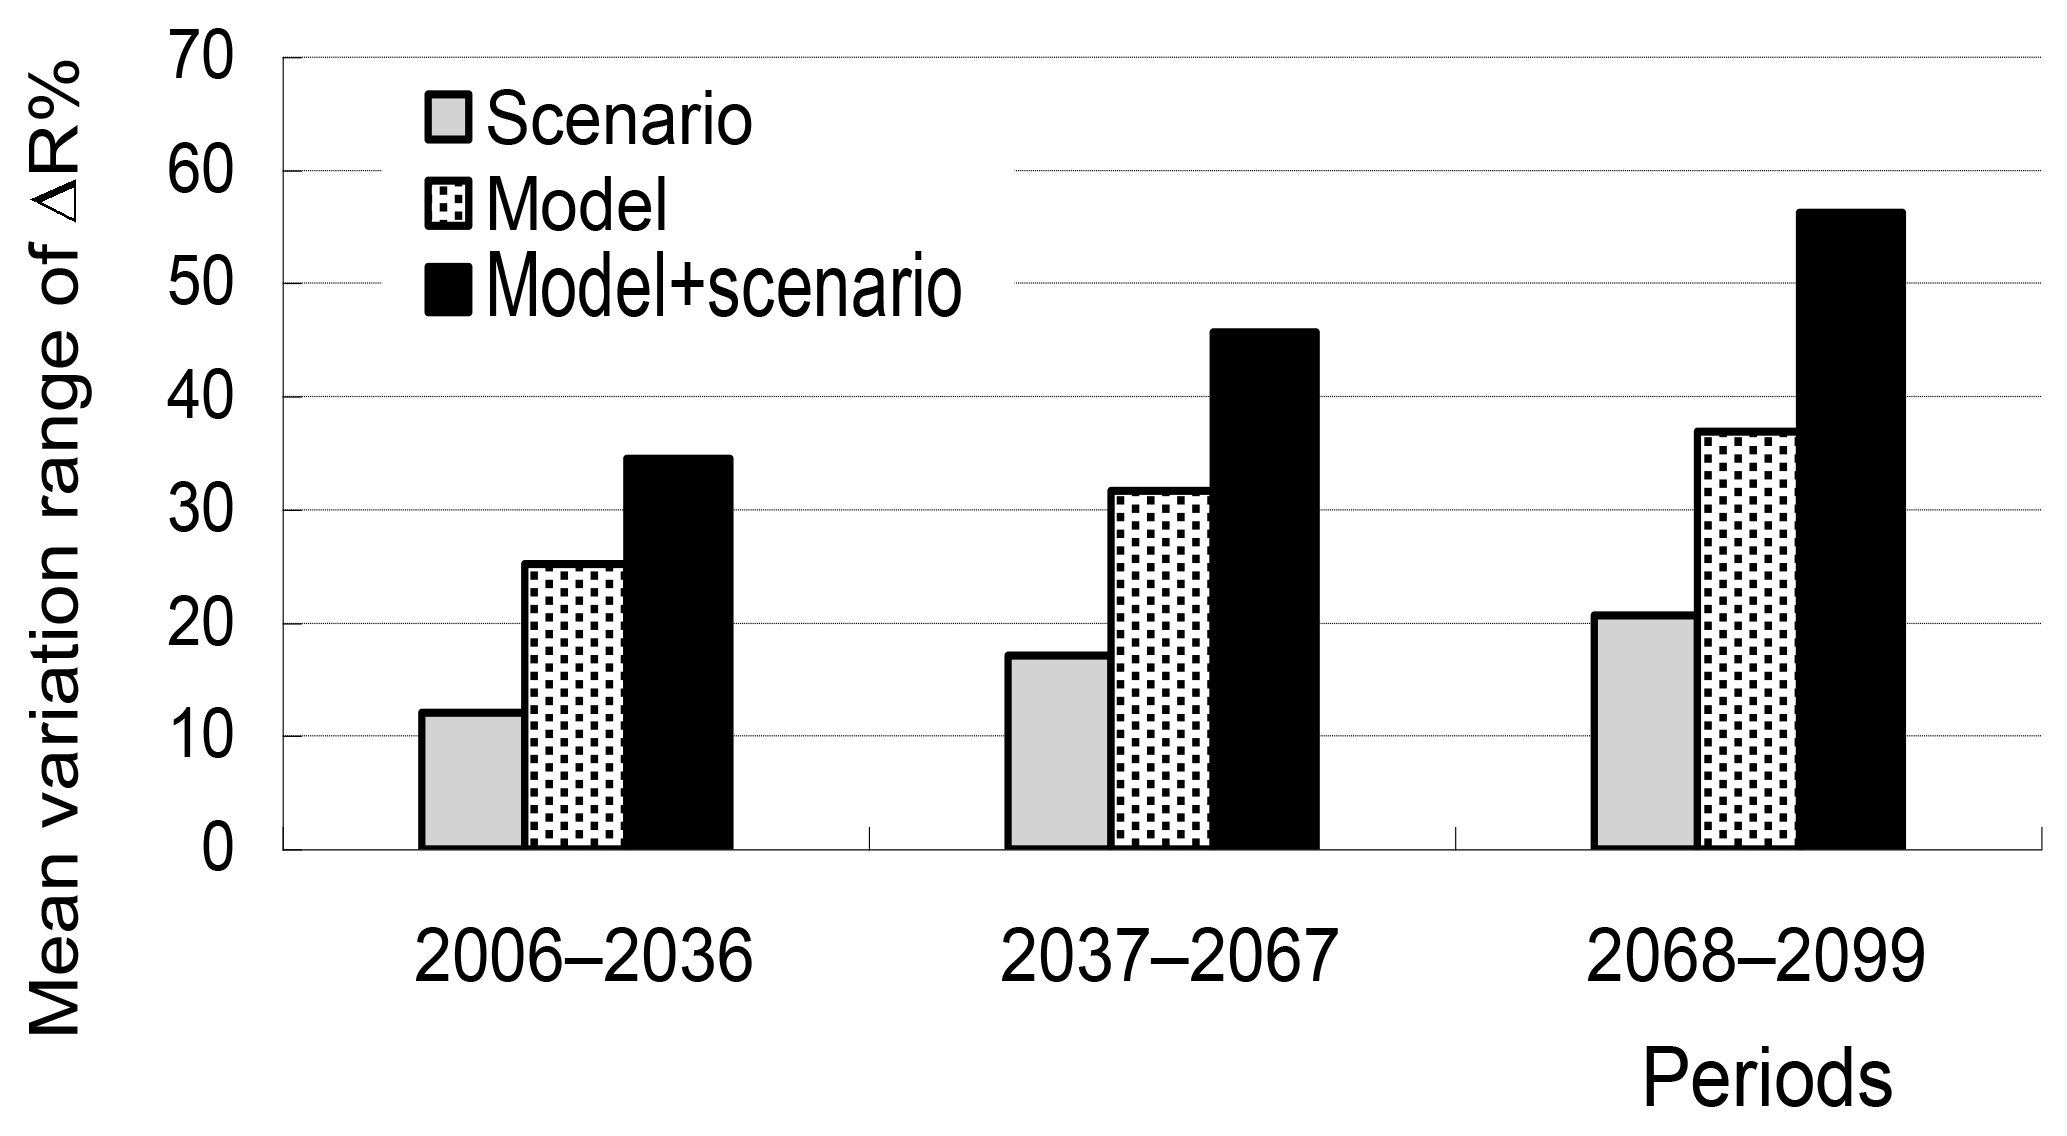
Figure 4Mean variation range of projected relative changes in climatic river runoff (averaged over 11 river basins) due to differences in RCP scenarios (“Scenario”), GCMs (“Model”), as well as both scenarios and models (“Model + Scenario”).
Twenty projections of the dynamics of river runoff from 11 large-scale basins during the 21st century were calculated with the help of the SWAP model driven by meteorological projections simulated by 5 GCMs for 4 climatic scenarios of the RCP family. They allowed us to project relative changes in climatic river runoff for three prognostic periods and estimate their uncertainties.
Analysis of the uncertainties of the projected changes in river runoff has shown that: (1) the largest uncertainties resulted from application of different GCMs and different climatic scenarios were obtained for the Darling, Tagus, Niger and Ganges rivers; (2) the uncertainties increase by the end of the 21st century; (3) for all 11 rivers and for the three prognostic periods, the contribution of GCMs into the uncertainty of the projected relative changes in climatic river runoff is larger than that of the RCP scenarios; (4) on the average, the contribution of GCMs into hydrological uncertainty is nearly twice larger than that of RCP scenarios; (5) on the average, the contribution of GCMs into the total hydrological uncertainty slightly decreases with time, as compared with the contribution of RCP scenarios.
Data were provided by ISI-MIP regional-scale water sector organizers, and by GRDC (the Global Runoff Data Centre, 56068 Koblenz, Germany).
The authors declare that they have no conflict of interest.
This article is part of the special issue “Innovative water resources management – understanding and balancing interactions between humankind and nature”. It is a result of the 8th International Water Resources Management Conference of ICWRS, Beijing, China, 13–15 June 2018.
The study was supported by the Russian Science Foundation (grant no.
16-17-10039). We are grateful to ISI-MIP regional-scale water sector
organizers for providing with data and materials, and to GRDC for providing
discharge data.
Edited by: Zongxue
Xu
Reviewed by: two anonymous referees
Gelfan, A., Gustafsson, D., Motovilov, Yu., Arheimer, B., Kalugin, A., Krylenko, I., and Lavrenov, A.: Climate change impact on water regime of two great Arctic rivers: modeling and uncertainty issues, Climatic Change, 141, 499–515, 2017.
Gosling, S. N., Taylor, R. G., Arnell, N. W., and Todd, M. C.: A comparative analysis of projected impacts of climate change on river runoff from global and catchment-scale hydrological models, Hydrol. Earth Syst. Sci., 15, 279–294, https://doi.org/10.5194/hess-15-279-2011, 2011.
Gusev, E. M. and Nasonova O. N.: Simulation of heat and water exchange at the land–atmosphere interface on a local scale for permafrost territories, Eurasian Soil Sci., 37, 1077–1092, 2004.
Gusev, E. M. and Nasonova, O. N.: Modelling heat and water exchange between the land surface and the atmosphere, Nauka, Moscow, 2010.
Gusev, E. M., Nasonova, O. N., Dzhogan, L. Ya., and Kovalev, E. E.: The application of the land surface model for calculating river runoff in high latitudes, Water Resources, 35, 171–184, 2008.
Gusev, Ye. M., Nasonova, O. N., Kovalev, E. E., and Aizel, G. V.: Mdelling river runoff and estimating its weather-related uncertainty for 11 large-scale rivers located in different regions of the globe, Hydrol. Res., https://doi.org/10.2166/nh.2017.015, 2017.
Gusev, Ye. M., Nasonova, O. N., Kovalev, E. E., and Aizel, G. V.: Impact of possible climate changes on river runoff under different natural conditions, Proc. IAHS, in press, 2018.
Hempel, S., Frieler, K., Warszawski, L., Schewe, J., and Piontek, F.: A trend-preserving bias correction – the ISI-MIP approach, Earth Syst. Dynam., 4, 219–236, https://doi.org/10.5194/esd-4-219-2013, 2013.
Krysanova, V. and Hattermann, F. F.: Intercomparison of climate change impacts in 12 large river basins: overview of methods and summary of results, Climatic Change, 141, 363–379, 2017.
Nasonova, O. N., Gusev, Ye. M., Volodin, E. M., and Kovalev, Ye. E.: Application of the land surface model SWAP and global climate model INMCM4.0 for projecting runoff of northern Russian rivers. 2. Projections and their uncertainties, Water Resources, in press, 2018.
Vetter, T., Reinhardt, J., Flörke, M., van Griensven, A., Hattermann, F., Huang, S., Koch, H., Pechlivanidis, I. G., Plötner, S., Seidou, O., Su, B., Vervoort, R. W., and Krysanova, V.: Evaluation of sources of uncertainty in projected hydrological changes under climate change in 12 large-scale river basins, Climatic Change, 141, 419–433, 2017.
Warszawski, L., Frieler, K., Huber, V., Piontek, F., Serdeczny, O., and Schewe, J.: The inter-sectoral impact model intercomparison project (ISI–MIP): project framework, P. Natl. Acad. Sci. USA, 111, 3228–3232, 2013.
Weedon, G. P., Gomes, S., Viterbo, P., Shuttleworth, W. J., Blyth, E., Oesterle, H., Adam, J. C., Bellouin, N., Boucher, O., and Best, M.: Creation of the WATCH Forcing Data and its uses to assess global and regional reference crop evaporation over land during the twentieth century, J. Hydrometeorol., 12, 823–848, 2011.
Wilby, R. L. and Harris, I.: A framework for assessing uncertainties in climate change impacts: low-flow scenarios for the River Thames, UK, Water Resour. Res., 42, W02419, https://doi.org/10.1029/2005WR004065, 2006.