
the Creative Commons Attribution 4.0 License.
the Creative Commons Attribution 4.0 License.
 | 16 Sep 2026
Temporal variability of extreme precipitation in Cotonou: stable climate signal and worsening urban flood impacts
Ninette Alceste Tollo

Audace A. V. Dossou-Olory
Inès Oyédé
Urban flooding has worsened significantly in Cotonou (major flood events in 2010, 2018, and 2020), yet this deterioration occurs against a backdrop of largely stable extreme precipitation. This study analyses the temporal variability of extreme precipitation indices in Cotonou over 40 years (1984–2024) in order to explain this paradox. Based on daily rainfall data from the Cotonou synoptic station, eleven standardised ETCCDI climate indices were calculated at four temporal scales (annual, monthly, seasonal, and decadal). Monotonic trends were detected using the Mann-Kendall test and Sen's slope estimator, while structural breakpoints were identified through a combined application of the Pettitt and Buishand tests. Contrary to widespread expectations of intensifying extremes, the results reveal that only the Simple Daily Intensity Index (SDII) presents a significant downward trend (Sen's slope = −0.084 mm d−1 yr−1, p=0.034). Three structural breakpoints were detected during the 2008–2012 period based on the Buishand criterion (Q>1.45): SDII in 2011, CWD in 2008, and R50mm in 2012. The frequency and intensity of extreme events (R95p, R99p, R95pTOT, R99pTOT) show no significant trend at any of the temporal scales considered. These findings demonstrate that the worsening of urban flood impacts in Cotonou results primarily from accelerated urbanisation – population growth of +140 % and soil impermeability of 70 %–80 % – rather than from climate change intensification, a pattern consistent with observations in other rapidly urbanising West African coastal cities.
- Article
(1950 KB) - Full-text XML
- BibTeX
- EndNote


Climate change constitutes a major challenge for West Africa, although this region contributes minimally to global greenhouse gas emissions (less than 4 % according to the IPCC) (IPCC, 2021). Since the 1970s, rainfall regimes have become increasingly irregular and extreme events have intensified, profoundly disrupting environmental and socio-economic balances (Nicholson, 2013; Biasutti, 2019). The Sixth Assessment Report of the IPCC (2021) predicts a substantial modification of precipitation regimes with a significant upward trend in the occurrence of extreme events in Sub-Saharan Africa (IPCC, 2021), a region identified as the most vulnerable to climate change (Atègbo et al., 2020).
Benin is not immune to these changes. Cotonou, the economic capital of Benin, acutely illustrates this problem. The events of 2010, 2018 and 2020 recorded in this city caused considerable human and economic losses, exacerbated by galloping urbanisation (Atègbo et al., 2020; Azagoun et al., 2024). Paradoxically, despite these growing impacts, scientific understanding of the actual evolution of extreme precipitation remains limited. Several recent studies have documented the evolution of precipitation in Benin (Kiki, 2011; Boko, 1998; Badou et al., 2018), but none has systematically exploited the complete set of standardised ETCCDI climate indices over a 41-year series at the scale of a station in Cotonou. This methodological gap limits the capacity for anticipation in the face of hydro-climatic risks.
2.1 Study area
Cotonou (6°20′–6°24′ N; 2°20′–2°29′ E) occupies 79 km2 between the Atlantic Ocean and Lake Nokoué. The commune has approximately 720 000 inhabitants (2024 estimate), with a density exceeding 15 000 inhabitants km−2 in certain districts (INSAE, 2013). The sub-equatorial climate presents four seasons: long rainy season (April–July), short dry season (August), short rainy season (September–November) and long dry season (December–March). The flat topography (altitudes 0.4–6.5 m) and massive impermeabilisation (70 %–80 % in urban areas) accentuate vulnerability to flooding (Atègbo et al., 2020).
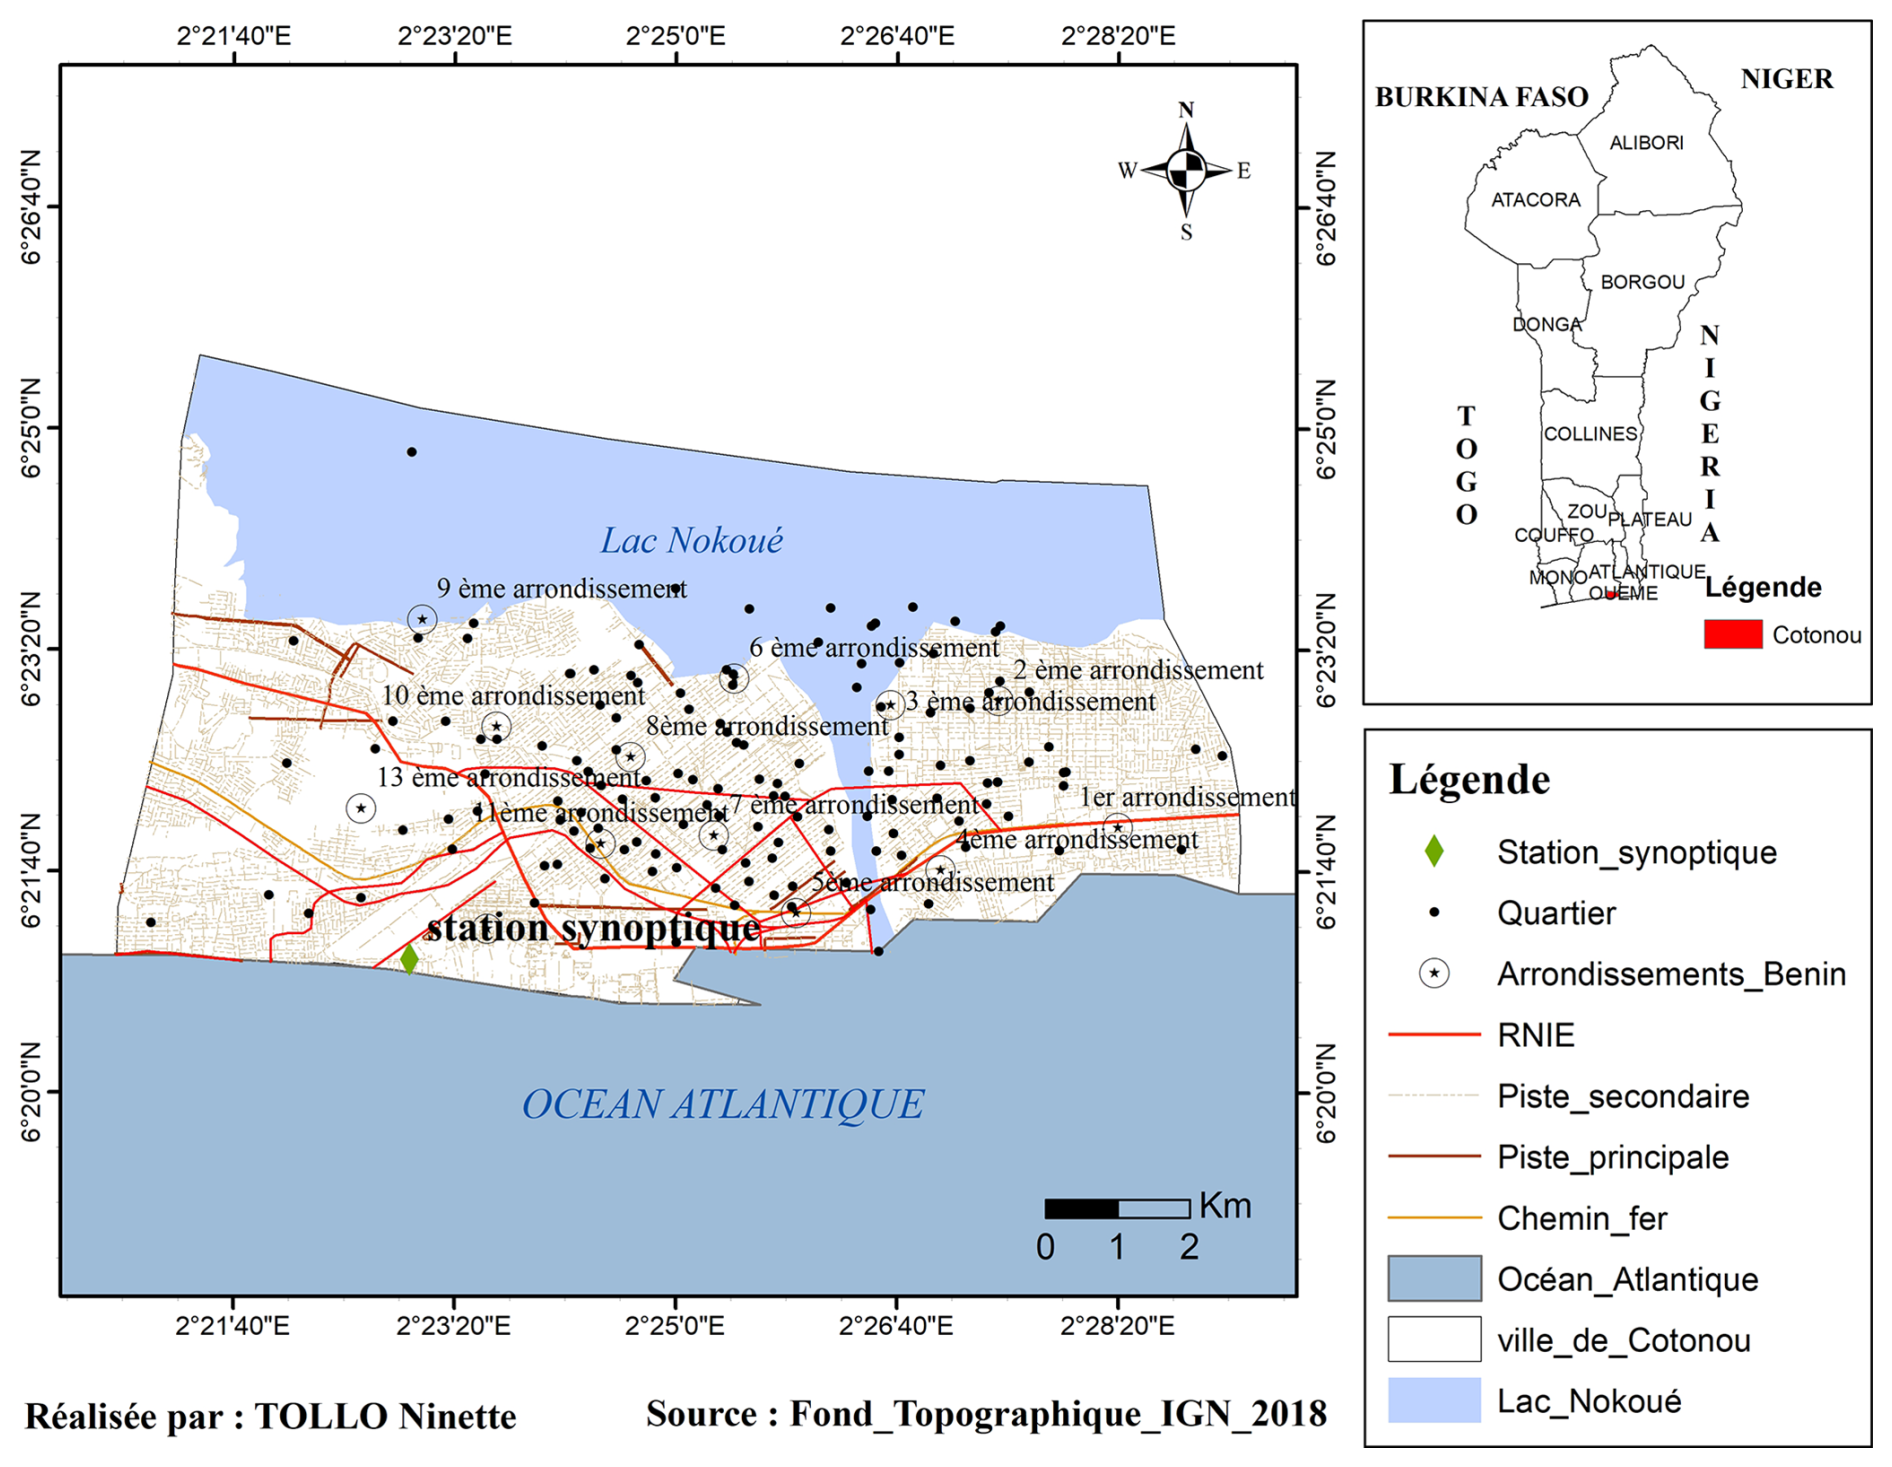
Figure 1Location map of the city of Cotonou; Map data courtesy of IGN (Institut Géographique National), 2018.
2.2 Data used
Daily rainfall data (1984–2024, n=41 years) come from the synoptic station at Cardinal Bernardin Gantin Airport in Cotonou (6°37′ N, 2°42′ E, altitude 5 m), managed by Météo-Bénin in collaboration with ASECNA (Agency for the Safety of Air Navigation in Africa and Madagascar). Observations are carried out daily at 06:00 local time with a WMO-approved standard rain gauge. Data quality was verified by cross-checking against the Météo-Bénin/ASECNA archives, and no significant gaps or anomalies were detected for the study period.
2.3 ETCCDI climate indices
Eleven standardised indices were calculated according to ETCCDI definitions (Zhang et al., 2011; Peterson et al., 2001; Alexander et al., 2006) in the R environment (version 4.x). A manual implementation was favoured to allow multi-scale temporal aggregation (monthly, seasonal, decadal) not directly supported by the standard climdex.pcic package. The indices are categorised as follows:
-
Intensity. RX1day (maximum precipitation in 1 d, mm), RX5day (maximum accumulation over 5 consecutive days, mm), SDII (average daily intensity, mm d−1), R95pTOT and R99pTOT (annual accumulation of precipitation exceeding the 95th and 99th percentiles, mm)
-
Frequency. R20mm and R50mm (number of days with precipitation ≥20 mm and ≥50 mm), R95p and R99p (number of days exceeding the 95th and 99th percentiles)
-
Duration. CDD (maximum number of consecutive dry days, <1 mm), CWD (maximum number of consecutive wet days, ≥1 mm)
The percentile thresholds (95th and 99th) were calculated over the entire 1984–2024 series and kept constant for all temporal scales, in accordance with ETCCDI recommendations (Zhang et al., 2011).
2.4 Statistical analyses
Monotonic trends were detected using the Mann-Kendall test (Z statistic, significance threshold α=0.05) and Sen's slope estimator (Panthou et al., 2014; Nakou et al., 2022). Structural breakpoints were identified using a combined approach: the Pettitt test (non-parametric, rank-based) (Pettitt, 1979) and the Buishand test (parametric, mean-change based) (Buishand, 1982). The combined application of both tests provides more robust breakpoint detection than either test alone. In cases where the two tests yield discordant results, significance is attributed on the basis of the Buishand criterion (Q>1.45 for n≈40 years), which has greater statistical power for detecting mean shifts in hydroclimatic series of this length (Pettitt, 1979; Buishand, 1982). The Pettitt test results are reported as indicative of the change-point location. All analyses were conducted at annual, seasonal, monthly and decadal scales in the R environment (version 4.x) with the “trend”, “zoo” and “dplyr” packages.
3.1 Interannual Variability and Annual Trends
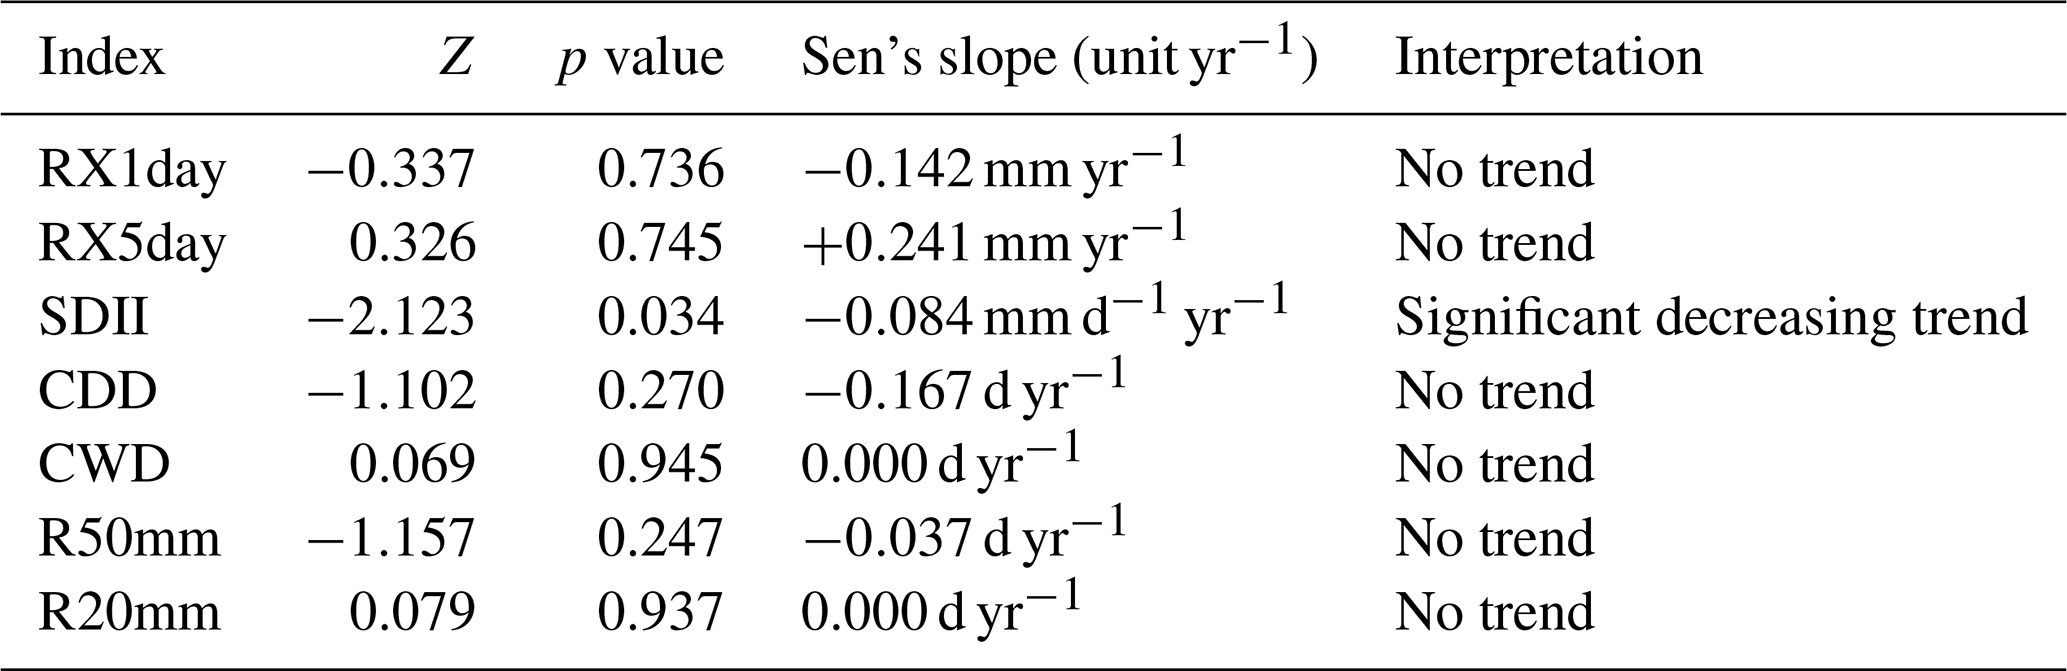
From the analysis of Table 1, we note that contrary to expectations of generalised intensification, only SDII presents a significant decreasing trend (, p=0.034, slope = −0.084 mm d−1 yr−1), representing a decrease of approximately 3.4 mm d−1 over 40 years. The other indices (RX1day, RX5day, CDD, CWD, R50mm, R20mm) show no significant trend (all p>0.05).
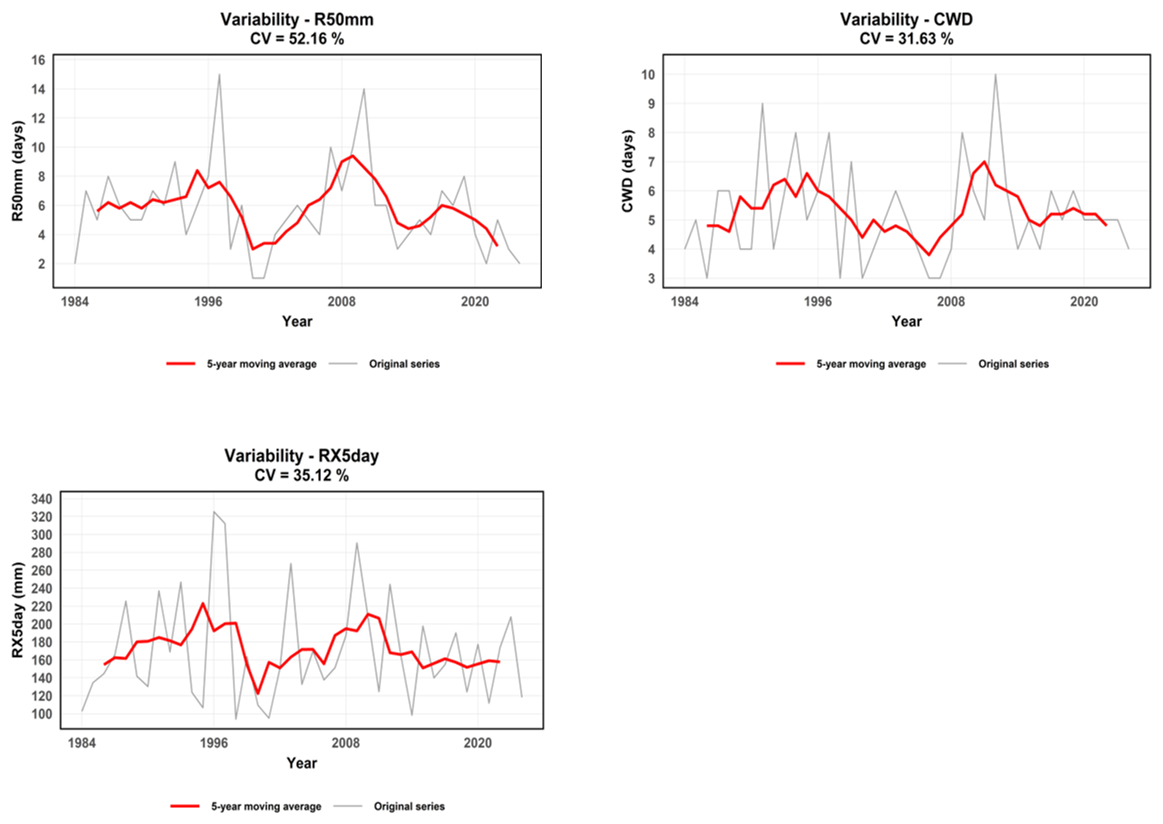
The analysis reveals strong interannual variability (Fig. 2). The coefficients of variation (CV) are particularly high for R50mm (52.16 %), CWD (31.63 %) and RX5day (35.12 %), indicating marked irregularity. These high CV values reflect the intrinsically sporadic nature of extreme precipitation in the Guinean coastal zone, dominated by convective events, rather than a detectable directional climate signal: in the absence of significant Mann-Kendall trends for these indices, high variability is interpreted as natural interannual fluctuation. RX1day varies from 51.9 mm (1984) to 194.2 mm (2003), with a mean of 103.95 mm.
Table 1Results of Mann-Kendall tests and Sen's slope at annual scale.
3.2 Climate breaks 2008–2012
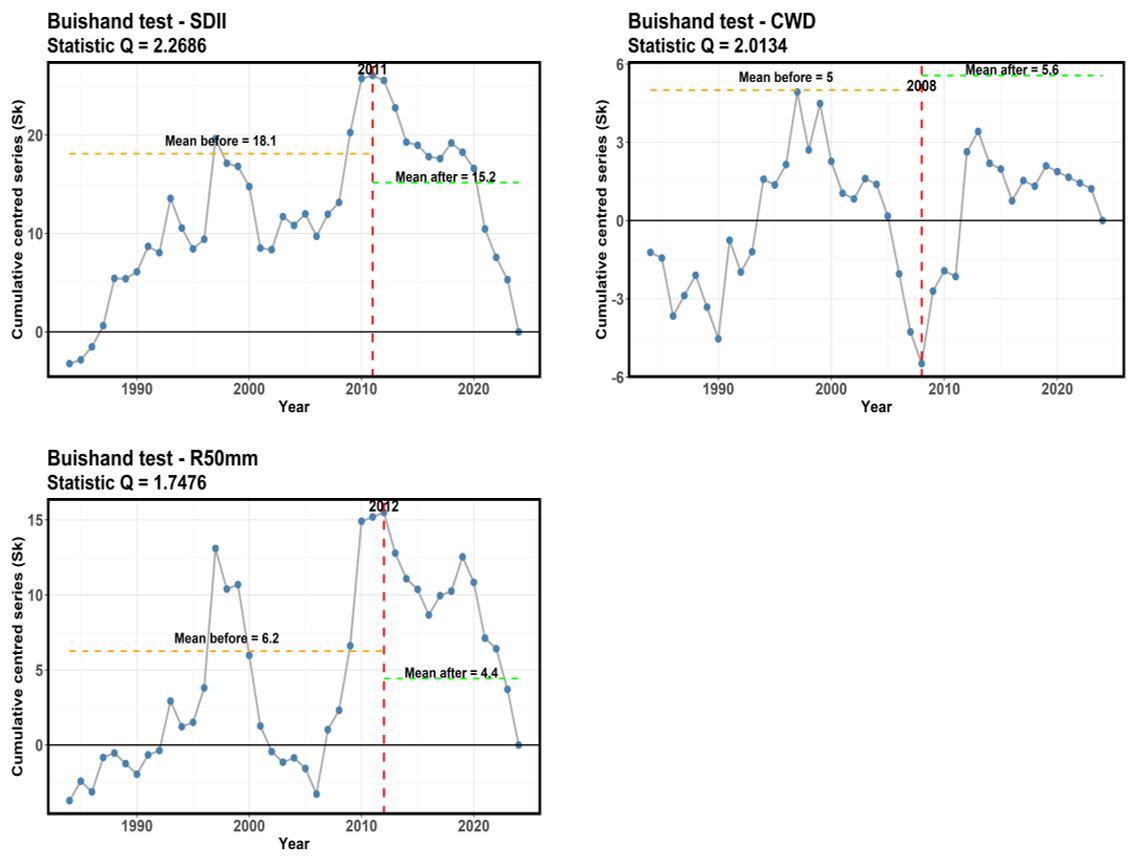
The breakpoint tests detect three abrupt changes during the 2008–2012 period (Table 2). These breakpoints are identified as significant on the basis of the Buishand test criterion (Q>1.45 for n≈40 years): SDII (Q=2.269), CWD (Q=2.013), and R50mm (Q=1.748) all exceed this threshold. The Pettitt test, whilst not reaching the conventional significance threshold of α=0.05 (p=0.067, 0.099, and 0.425 respectively), identifies the same change-point years and is consistent with the Buishand results, reinforcing the detection of these structural shifts.
Table 2Results of Pettitt and Buishand tests.

Significant at threshold α=0.05 based on Buishand criterion (Q>1.45; n≈40 years). Pettitt p values are indicative of change-point location.
From the combined analysis of Table 2 and Fig. 3, it emerges that SDII falls in 2011, dropping from 18.1 to 15.2 mm d−1, representing a 16 % decrease; CWD increases slightly in 2008, from 5 to 5.6 consecutive wet days; and R50mm collapses in 2012, dropping from 6.2 to 4.4 d yr−1, representing a 29 % fall. Consequently, between 2008 and 2012, Cotonou's rainfall regime was restructured: moderate rains weaken but concentrate over slightly longer sequences, whilst very intense events become rarer.
3.3 Stability of Extreme Event Frequency and Intensity
The analysis of R95p, R99p, R95pTOT and R99pTOT reveals no significant trend at any of the four temporal scales (all p>0.05). The frequency of extreme days oscillates between 0 and 12.5 d yr−1 without directional signal. The cumulative intensity presents strong variability, ranging from 0 mm – during dry months with no events exceeding the percentile thresholds – to a maximum of 380.8 mm for R95pTOT and 256.7 mm for R99pTOT at the monthly scale. The zero values correspond to months during the dry season (December–March) when no day exceeds the 95th or 99th percentile threshold, while peak values correspond to exceptionally rainy months concentrating multiple extreme events. This variability is dominated by isolated peaks (1988, 1994, 2003, 2010) without temporal progression.
3.4 Seasonal and Monthly Specificities
At the seasonal scale, only SDII in April–July (long rainy season) presents a significant decreasing trend (p=0.010, slope = −0.141 mm d−1 yr−1), representing a 23.7 % decrease (from 19.4 to 14.8 mm d−1). This decline largely explains the annual signal. At the monthly scale, three isolated trends emerge: RX1day in April (p=0.040, slope = −0.537 mm yr−1), CDD in October (p=0.005, slope = −0.105 d yr−1), and CWD in November (p=0.019). The break in CDD in October 2001 (40 % decrease: 9.3→5.6 d) indicates better temporal distribution of precipitation during the short rainy season.
3.5 Decadal Confirmation and Nature of Change
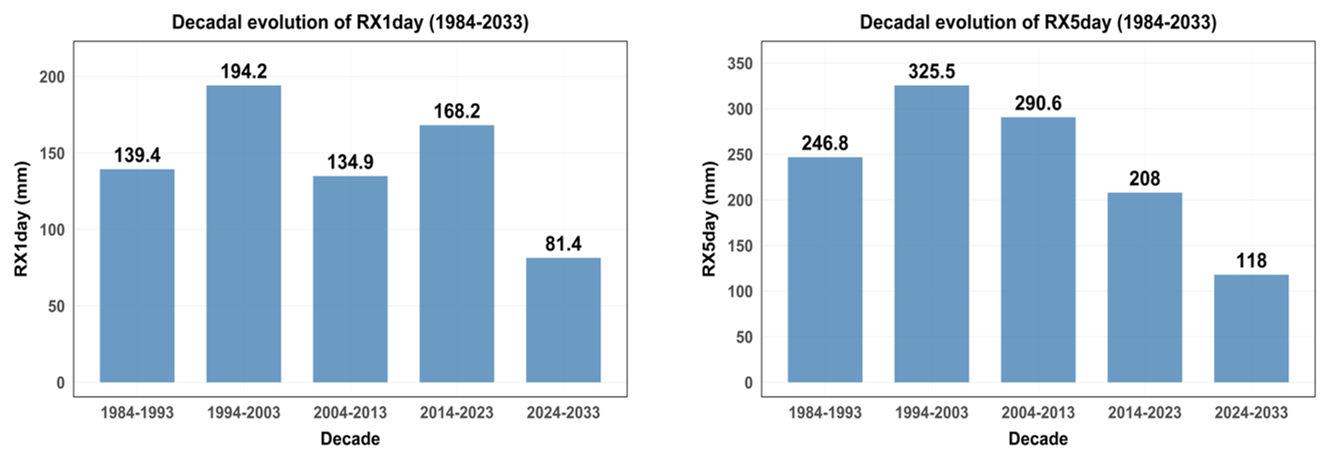
The decadal analysis (1984–1993, 1994–2003, 2004–2013, 2014–2023, and the partial decade 2024–2033 comprising only 2024) confirms the decreasing trend of SDII observed annually: 18.7 mm d−1 (1984–1993) to 15.6 mm d−1 (2014–2023), representing a −16.5 % decrease over 41 years. The absolute extreme indices (RX1day, RX5day) present strong decadal variability without clear directional trend (Fig. 4), confirming their stability observed at annual and seasonal scales. Maximums systematically exceed decadal means by 27 % to 86 % depending on decades and indices, highlighting the sporadic character of the most extreme events. This constancy of extreme events, combined with the progressive decrease in SDII and the rarefaction of R50mm, supports the hypothesis of a redistribution of rainfall energy: weakening of moderate events (10–30 mm) that contributed to the mean, maintenance of extremes (>50 mm) that occur a few days per decade but retain their catastrophic potential.
4.1 Main results and central paradox
The central finding of this study is the existence of a fundamental paradox: hydro-climatic impacts are worsening in Cotonou whilst extreme precipitation remains largely stable over the 1984–2024 period. Only SDII shows a significant downward trend (−0.084 mm d−1 yr−1, p=0.034), with three structural breaks in 2008–2012 marking a bipolarisation of the rainfall regime: moderate events are weakening whilst the most intense events maintain their catastrophic potential. The frequency and intensity of extreme events (R95p, R99p, R95pTOT, R99pTOT) show no significant trend at any of the four temporal scales analysed. This finding challenges the common assumption that worsening flood impacts necessarily reflect climate-driven intensification of extreme precipitation.
4.2 Dominant role of urbanisation
The worsening of floods (2010, 2018, 2020) despite the stability of climate extremes reveals that accelerated urbanisation constitutes the main explanatory factor rather than climate change. Between 1990 and 2020, Greater Cotonou grew from 500 000 to more than 1.2 million inhabitants (+140 %), accompanied by massive impermeabilisation (runoff coefficient 70 %–80 % in urban areas versus 20 %–30 % in natural areas) (Azagoun et al., 2024), suppression of natural buffer zones (depressions, mangroves), and saturation of drainage networks initially dimensioned for 200 000 inhabitants (Azagoun et al., 2024).
Our results support this interpretation: R50mm decreases after 2012 (from 6.2 to 4.4 d yr−1) whilst SDII also decreases, suggesting that the overall rainfall regime is not intensifying. Yet floods continue to worsen. The urban system has become so sensitive that even moderate rainfall events are now sufficient to cause overflows, as drainage infrastructures struggle to absorb runoff peaks (Azagoun et al., 2024). This anthropogenic vulnerability amplifies the impacts of a globally stable climate hazard, a configuration documented in other West African coastal cities facing rapid urbanisation, notably in Accra, Ghana, where flood vulnerability has been shown to co-evolve with informal urbanisation dynamics (Amoako and Inkoom, 2018), and in Lagos, Nigeria, where urbanisation and inadequate drainage infrastructure – rather than climate change – have been identified as the primary drivers of flooding (Adeloye and Rustum, 2011).
4.3 Comparison with regional studies: West African heterogeneity
Our results partially diverge from Sahelian trends. Panthou et al. (2014) document a marked intensification of extreme precipitation (+40 % for certain indices since 1950) in the Sahel, not confirmed in Cotonou. This geographical divergence highlights West African climate heterogeneity (Nicholson, 2013; Biasutti, 2019); the distinct atmospheric dynamics between the concentrated Sahelian regime (one rainy season) and the bimodal Guinean regime (two seasons) generate differentiated responses to global climate forcing. The absence of significant intensification in Cotonou's record can be further explained by: (1) the analysis period (1984–2024) beginning after the major Sahelian drought, reducing the historical contrast compared to studies covering 1960–2010; and (2) the nature of ETCCDI indices themselves, which measure gradual trends potentially masked by the strong interannual variability characteristic of convective regimes.
Our results partially converge with Kiki (2011) (intensification observed in Porto-Novo, Cotonou, Ouidah, 1961–2010), but the temporal divergence is explained: Kiki included the drought decades of 1970–1990, creating a more marked historical contrast. Our identification of 2008–2012 breaks converges with Nakou et al. (2022) (disturbances in the lower Mono valley, 1967–2017), confirming the chronic instability of Beninese rainfall regimes. Badou et al. (2018) confirm a worsening of extremes in the coastal zone, but their multi-station aggregation masks the local specificities revealed by our single-station approach.
4.4 Strengths, limitations and perspectives
The strengths of this study include: (1) the use of 41 years of daily data from a single reference station, allowing fine-scale temporal analysis; (2) a multi-scale approach (annual, monthly, seasonal, decadal) providing a comprehensive view of variability patterns; (3) the use of standardised ETCCDI indices, ensuring comparability with international studies; and (4) the combined application of two complementary breakpoint detection tests.
Limitations include: (1) the single-station approach, which limits spatial generalisation across the greater Cotonou area; (2) the absence of quantitative flood data (discharge, inundation extent) preventing a direct statistical link between precipitation indices and flood occurrence; and (3) the non-inclusion of temperature data, which could provide additional insight into evapotranspiration dynamics and net water availability.
Future research perspectives include: (1) extension of the analysis to other Beninese synoptic stations to assess spatial heterogeneity; (2) integration of land use and land cover change data to quantify the respective contributions of urbanisation and climate variability to flood risk; and (3) coupling of precipitation indices with hydraulic modelling to establish threshold relationships between rainfall intensity and urban drainage capacity.
4.5 Implications for policy and adaptation
The causal attribution of observed impacts relates more to deficient urban management than to the pure climate signal. Adaptation policies must therefore primarily target urban planning, drainage rehabilitation and preservation of natural buffer zones. This finding has direct implications for investment prioritisation: rather than focusing exclusively on climate-centred adaptation measures, policymakers in Cotonou and similar West African coastal cities should prioritise improvements to drainage infrastructure capacity and enforce land use regulations that limit further impermeabilisation.
This study reveals that hydro-climatic impacts are worsening in Cotonou whilst extreme precipitation remains largely stable over the 1984–2024 period. Only the SDII index decreases significantly (−0.084 mm d−1 yr−1, p=0.034), with three structural breaks detected during 2008–2012 based on the Buishand criterion, marking a bipolarisation of the regime: moderate events weaken whilst extreme events maintain their catastrophic potential. The frequency and intensity of extreme events (R95p, R99p, R95pTOT, R99pTOT) show no significant trend at any of the four temporal scales analysed.
The worsening of flood impacts therefore results primarily from accelerated urbanisation (population growth +140 %, impermeabilisation 70 %–80 %, infrastructural saturation) rather than from climate change intensification. This finding is consistent with observations in other rapidly urbanising West African coastal cities and challenges the common assumption that deteriorating flood situations necessarily reflect intensifying precipitation. Adaptation strategies in Cotonou must prioritise urban planning and drainage infrastructure improvements alongside – and in many cases ahead of – climate-focused measures.
The analyses were conducted using R software (version 4.x). The scripts used to perform the statistical analyses and generate the figures are available from the corresponding author upon reasonable request.
The daily rainfall data used in this study were obtained from Météo-Bénin and ASECNA (Agency for the Safety of Air Navigation in Africa and Madagascar) and consist of daily precipitation records from the Cotonou synoptic station for the period 1984–2024. The datasets are not publicly available because they are subject to institutional access restrictions, but they can be obtained from the corresponding author upon reasonable request and with permission from the data provider.
Conceptualization: NAT, AAVDO; formal analysis: NAT; methodology: NAT; software: NAT; writing – review and corrections: NAT, AAVDO, IO; writing – first draft: NAT. All authors approved the final version of the manuscript.
At least one of the (co-)authors is a guest member of the editorial board of Proceedings of the International Association of Hydrological Sciences for the special issue “Circular Economy and Technological Innovations for Resilient Water and Sanitation Systems in Africa II”. The peer-review process was guided by an independent editor, and the authors also have no other competing interests to declare.
Publisher's note: Copernicus Publications remains neutral with regard to jurisdictional claims made in the text, published maps, institutional affiliations, or any other geographical representation in this paper. The authors bear the ultimate responsibility for providing appropriate place names. Views expressed in the text are those of the authors and do not necessarily reflect the views of the publisher.
This article is part of the special issue “Circular Economy and Technological Innovations for Resilient Water and Sanitation Systems in Africa II”. It is a result of the 2nd Edition of the C2EA Water and Sanitation Week on “From Research to Innovation and Technology Transfer”, Cotonou, Benin, 3–5 June 2025.
The authors thank Météo-Bénin and ASECNA for providing rainfall data, as well as the National Water Institute (INE) for institutional support.
This paper was edited by Aymar Bossa and reviewed by two anonymous referees.
Adeloye, A. J. and Rustum, R.: Lagos (Nigeria) flooding and influence of urban planning, Proc. Inst. Civ. Eng. Urban Des. Plan., 164, 175–187, https://doi.org/10.1680/udap.1000014, 2011.
Alexander, L. V., Zhang, X., Peterson, T. C., Caesar, J., Klein Tank, A. M. G., Haylock, M., Collins, D., Trewin, B., Rahimzadeh, F., Tagipour, A., Rupa Kumar, K., Revadekar, J., Griffiths, G., Vincent, L., Stephenson, D. B., Burn, J., Aguilar, E., Brunet, M., Taylor, M., New, M., Zhai, P., Rusticucci, M., and Vazquez-Aguirre, J. L.: Global observed changes in daily climate extremes of temperature and precipitation, J. Geophys. Res., 111, D05109, https://doi.org/10.1029/2005JD006290, 2006.
Amoako, C. and Inkoom, D. K. B.: The production of flood vulnerability in Accra, Ghana: re-thinking flooding and informal urbanisation, Urban Stud., 55, 2903–2922, https://doi.org/10.1177/0042098016686526, 2018.
Atègbo, J. M., Ahouanvoedo, O. D., and Odoulami, L.: Analyse des facteurs de vulnérabilité aux inondations dans la ville de Cotonou (Bénin), Revue de Géographie Tropicale et d'Environnement, 2, 64–78, 2020.
Azagoun, V. C., Amoussou, E., Boko, M., and Yabi, I.: Dynamique urbaine et vulnérabilité aux inondations dans le Grand Cotonou (Bénin), Revue Espace, Territoires, Sociétés et Santé, 7, 115–132, 2024.
Badou, D. F., Diekkrüger, B., Kapangaziwiri, E., Mbaye, M. L., Yira, Y., Lawin, E. A., Oyerinde, G. T., and Afouda, A.: Modelling blue and green water availability under climate change in the Beninese Basin of the Niger River Basin, West Africa, Hydrol. Process., 32, 2526–2542, https://doi.org/10.1002/hyp.13153, 2018.
Biasutti, M.: Rainfall trends in the African Sahel: characteristics, processes, and causes, WIREs Clim. Change, 10, e591, https://doi.org/10.1002/wcc.591, 2019.
Boko, M.: Climats et communautés rurales du Bénin: rythmes climatiques et rythmes de développement, thèse de doctorat d'État, Université de Bourgogne, Dijon, France, 1998.
Buishand, T. A.: Some methods for testing the homogeneity of rainfall records, J. Hydrol., 58, 11–27, https://doi.org/10.1016/0022-1694(82)90066-X, 1982.
INSAE: Quatrième recensement général de la population et de l'habitation (RGPH4), Institut National de la Statistique et de l'Analyse Économique, Cotonou, Bénin, https://www.instad.bj (last access: 4 September 2026), 2013.
IPCC: Climate Change 2021: The Physical Science Basis. Contribution of Working Group I to the Sixth Assessment Report of the Intergovernmental Panel on Climate Change, Cambridge University Press, Cambridge, United Kingdom and New York, NY, USA, https://doi.org/10.1017/9781009157896, 2021.
Kiki, P. C.: Variabilité climatique et production maraîchère dans le département de l'Atlantique au Bénin, mémoire de DEA, institutional DEA thesis, Université d'Abomey-Calavi, Bénin, 2011.
Nakou, R. T., Codo, F. D. P., Worou, N. C., Sintondji, L. O., Alassane, A., and Yalo, N.: Caractérisation des événements pluviométriques extrêmes dans la basse vallée du fleuve Mono au Bénin, Afrique Sci., 21, 177–192, 2022.
Nicholson, S. E.: The West African Sahel: a review of recent studies on the rainfall regime and its interannual variability, ISRN Meteorol., 2013, 453521, https://doi.org/10.1155/2013/453521, 2013.
Panthou, G., Vischel, T., and Lebel, T.: Recent trends in the regime of extreme rainfall in the Central Sahel, Int. J. Climatol., 34, 3998–4006, https://doi.org/10.1002/joc.3984, 2014.
Peterson, T. C., Folland, C., Gruza, G., Hogg, W., Mokssit, A., and Plummer, N.: Report on the activities of the Working Group on Climate Change Detection and Related Rapporteurs 1998–2001, WMO/TD-No. 1071, WCDMP-No. 47, World Meteorological Organization, Geneva, Switzerland, 2001.
Pettitt, A. N.: A non-parametric approach to the change-point problem, J. R. Stat. Soc. C Appl. Stat., 28, 126–135, https://doi.org/10.2307/2346729, 1979.
Zhang, X., Alexander, L., Hegerl, G. C., Jones, P., Klein Tank, A. M. G., Peterson, T. C., Trewin, B., and Zwiers, F. W.: Indices for monitoring changes in extremes based on daily temperature and precipitation data, WIREs Clim. Change, 2, 851–870, https://doi.org/10.1002/wcc.147, 2011.