the Creative Commons Attribution 4.0 License.
the Creative Commons Attribution 4.0 License.
Landslide hazard mapping of Wayanad District of Kerala, India, incorporating copula-based estimation of joint probability of rainfall
Shamla Dilama Shamsudeen
Adarsh Sankaran
The development and integration of the spatial and temporal probabilities of landslides are required for complete landslide hazard mapping at any location. Under changing climate, the computation of the temporal probability of landslides with rainfall magnitude alone is inaccurate. This research proposes a framework based on copula functions to develop a landslide probability map using multi-site rainfall data by accounting for the rainfall variables of intensity and duration using a joint-probability approach. The proposed technique is used for Wayanad District, Kerala, India, considering extreme rainfall events in 2018. Firstly, the landslide susceptibility map of the district was developed using a robust random forest (RF) model. Based on regional geology, geomorphology, and climate, different regions of Wayanad have varying rainfall thresholds assessed according to the intensity and duration of the rainfall. Then, the temporal probability of landslides was developed, accounting for the intensity and duration of rainfall events using the joint-probability estimation using copula. Through the integration of the landslide spatial probability map with the temporal probability, landslide hazard maps (LHMs) for Wayanad were developed for time periods ranging from 1 to 50 years. The results of the study indicate the need for bi- or multi-variate landslide probability modeling in studies on regional landslide hazard assessments.
- Article
(2553 KB) - Full-text XML
- BibTeX
- EndNote
Landslides, defined as the downward movement of rock, debris, or earth as induced by gravity, have had a profound impact on property and human life. Landslides can be induced by a variety of external factors, including heavy rainfall, earthquakes, changes in water level, storm waves, or human activity, with rainfall being the most common and most major triggering element. Landslide threats are anticipated to increase globally as weather extremes intensify (Crozier, 2010). Landslides have become a common monsoon disaster in Kerala's Western Ghats region in recent years (Ajin et al., 2022; Hao et al., 2020). The distinct physiography and climate of the Western Ghats region are considered to be responsible for the catastrophic landslides that occur along their windward slope during periods of intense rainfall (Achu et al., 2021). The coupling influence of rainfall processes and environmental parameters such as topography, landform, lithology, and fault in the prediction of regional landslides has only been examined in a few studies. Regional landslide hazards have been assessed using probability models. In general, a univariate approach has been employed to examine the impact of climatological variables on landslides. Climate variables are highly correlated, and univariate analysis cannot capture the complex and latent characteristics of climatological events. Thus, multivariate analysis is required to describe the structure of variable dependence. Copula functions enable a multivariate approach in which the dependence structure among random variables is determined irrespective of the marginal distributions.
The main focus of this research is to develop a landslide hazard map for Wayanad District of Kerala, India, using copula functions. The copula functions offer a multivariate approach in this study, where rainfall duration and intensity can be evaluated. The specific objectives are (i) to determine the intensity–duration (ID) relationship between landslide occurrence and rainfall, (ii) to prepare the landslide susceptibility map of Wayanad District of Kerala using the machine learning technique of random forests, (iii) to determine the temporal probability of landslides considering multi-site rainfall information using the copula function, and (iv) to prepare the hazard map by integrating the spatial and the temporal probability of landslides.
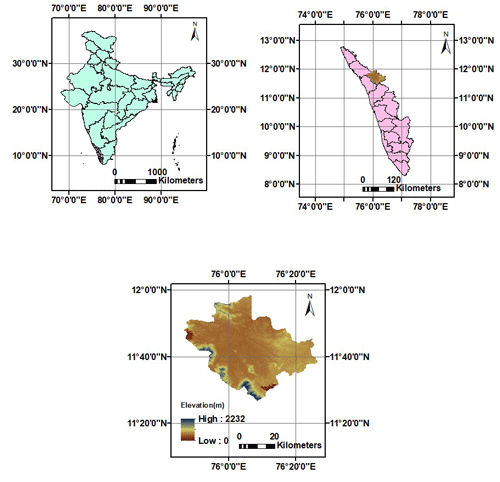
The research was carried out in Wayanad District (Fig. 1) of Kerala, India, which is located in the northeastern part of the state (11–12° N, 75.5–76.25° E). The study region has a total area of 2132 km2, of which 885.92 km2 is covered by forest. It is located between 700 and 2300 m a.m.s.l. (above mean sea level).
The average annual precipitation in the region is 2322 mm.
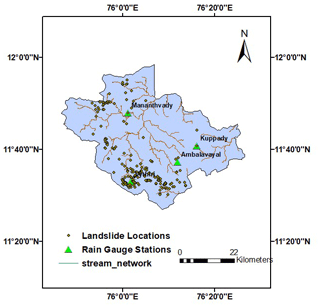
The landslide inventory (Fig. 2) of Wayanad was created for the years 2007 to 2018 using data from the Geological Survey of India's Bhukosh (https://gsi.gov.in, last access: 5 June 2023).
The study area has been divided into four zones (Fig. 2) based on the proximity to rain gauge stations in order to account for the varying properties of rainfall belonging to the different regions of Wayanad. The rainfall data for the study were obtained from IMD (India Meteorological Department, https://imdpune.gov.in, last access: 5 June 2023), specifically gridded data of 0.25°×0.25° resolution from 1991 to 2021 at a daily scale. The data were retrieved for four rain gauge stations (Fig. 2): Mananthavady (11.8°, 76.02°), Vythiri (11.5°, 76.03°), Ambalavayal (11.62°, 76.2°), and Kuppady (11.68°, 76.27°).
This research suggests a copula-based approach that takes the duration and intensity from multi-site rainfall data into account while creating the landslide probability map.
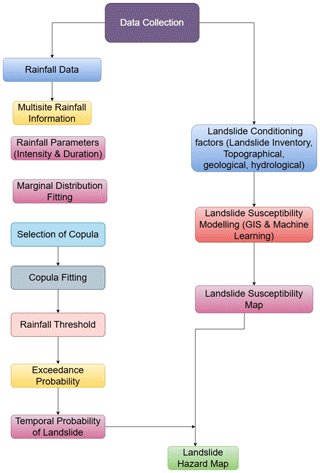
The landslide probability map was prepared by integrating the landslide susceptibility and the temporal probability of the landslide. The susceptibility map was created utilizing the conditioning factors, which included topographical, hydrological, geological, and land use or land cover maps, as well as the landslide inventory map. The joint-probability approach of copula functions was used to obtain the temporal probability of a landslide by calculating the exceedance probability of rainfall parameters, such as intensity and duration, which are considered to be triggering factors of landslide occurrence in the study area. The overall methodology is depicted in Fig. 3.
The rainfall data were collected on a daily basis for different regions of Wayanad. The data were used to determine the rainfall threshold by cross-referencing it with the landslide inventory data from the period of 2007–2018. The empirical rainfall threshold using a power law was calculated using the relationship between rainfall intensity and duration, as well as the landslide events. This was expressed by the following formula:
where α and β are the intercept and slope parameters, respectively (Segoni et al., 2018; Berti et al., 2020). The rainfall thresholds in Wayanad varied depending on the local, geological, geomorphological, and climatic conditions.
In order to determine the temporal probability of landslides, the rainfall parameter, such as intensity, was acquired by disaggregating the annual maximum rainfall into durations of 3, 5, 7, 15, and 30 d. For this study, we used rainfall data spanning 31 years (1991–2021) to determine the temporal probability of landslides.
The rainfall variables of intensity (I) and duration (D) are modeled using the log-normal distributions and gamma distributions. The parameters were determined using the maximum-likelihood method. The multivariate probability distribution was joined with the univariate marginal distribution functions using the Frank copula, which belongs to the Archimedean family of copulas, C:
where u and v are marginal distribution functions of intensity and duration, and θ is the Frank copula parameter. The maximum-likelihood estimation (MLE) approach was also used to estimate the parameters of the copula functions. The dependencies among the rainfall parameters of intensity and duration were determined in terms of Kendall's tau, τ, the correlation coefficient.
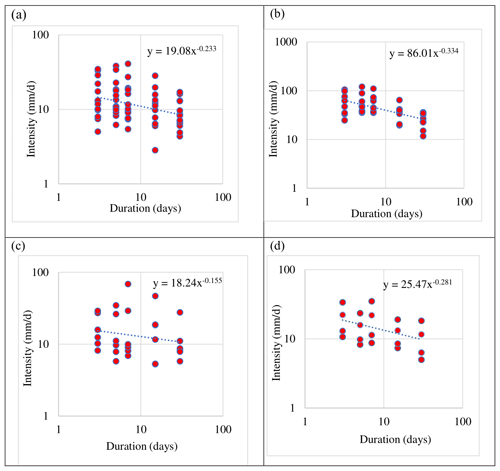
Figure 4Rainfall threshold obtained at (a) Mananthavady, (b) Vythiri, (c) Ambalavayal, and (d) Kuppady.
The joint exceedance probabilities of rainfall intensity and duration were determined by the theory of the return period (T) using the copula functions. The return period can be defined using the copula theory according to the event for X given Y≥y or the event for Y given X≥x; these are known as the conditional return period for X given Y≥y and the conditional return period for Y given X≥x and are calculated as follows (Shiau et al., 2006; Bezak et al., 2016; Haile, 2022):
where T is the return period, and F(x) and F(y) are cumulative distributions (CDFs) of marginal distributions.
Using the exceedance conditional probability p, the bivariate risk during a period of N years, Pr (N), can be determined as follows (Pabaghi et al., 2023):
Thus, the temporal probability of landslides over N years can be determined using Eq. (5).
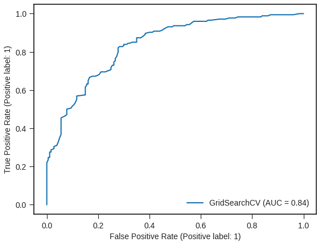
The identification of topographical, geological, environmental, and anthropogenic factors that influence the occurrence of landslides in the study area is an important step in landslide hazard mapping. Thus, the following conditioning factors were used in the landslide susceptibility analysis: slope, aspect, curvature, elevation, stream power index (SPI), topographic wetness index (TWI), land use and land cover (LULC), geology, and normalized difference vegetation index (NDVI). The factor maps were created with a 30 m × 30 m resolution SRTM (Shuttle Radar Topography Mission) digital elevation model. The random forest machine learning technique was used for feature selection and landslide susceptibility mapping. The receiver operating characteristic (ROC) curve and the area under the ROC curve (AUC) were used to validate predictions. The landslide hazard maps (LHMs) for different time periods were then created by integrating the landslide susceptibility map (LSM) with the temporal probability of landslide (Lee et al., 2020; Kim et al., 2020).
The hazard mapping under the estimated rainfall threshold was done by integrating the landslide susceptibility mapping and the temporal probability of a landslide occurrence obtained by the copula function.
4.1 Rainfall threshold
The rainfall intensity–duration thresholds (Fig. 4) obtained at Mananthavady, Vythiri, Ambalavayal, and Kuppady are 19.08D−0.223, 86.01D−0.334, 18.24D−0.155, and 25.47D−0.281, respectively, where D is the duration in days. The rainfall threshold values obtained in this study are comparable to those obtained in Wayanad in a previous study by Abraham et al. (2020). The rainfall threshold obtained at Vythiri could be validated with the landslide occurrence on 8 August 2019, which happened with a daily rainfall amount of 192.22 mm and a 3 d rainfall intensity of 81.6 mm d−1.
4.2 Temporal probability assessment of landslides
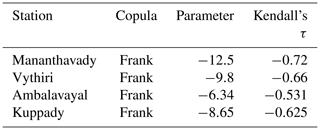
Using the copula functions, the combined conditional exceedance probability of rainfall intensity and duration is used to calculate the temporal probability of landslides. Table 1 shows the parameters and correlation coefficient that were determined for the Frank copula.
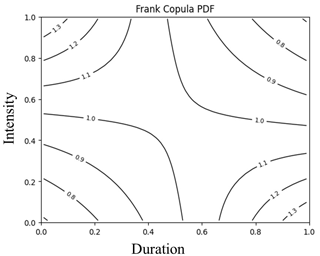
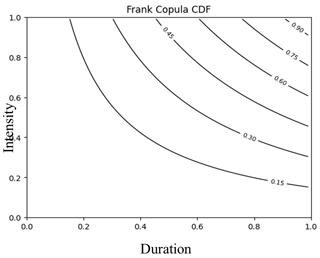
The joint probability distribution function (PDF) (Fig. 5) demonstrates zero tail dependency, indicating that the variables are asymptotically independent of their tails. The negative value of Kendall's τ shows that the rainfall variables of intensity and duration are negatively dependent (Zhang and Singh, 2012). The combined cumulative distribution function (CDF) in the copula similarly indicates that the two factors are negatively reliant on each other (Fig. 6).
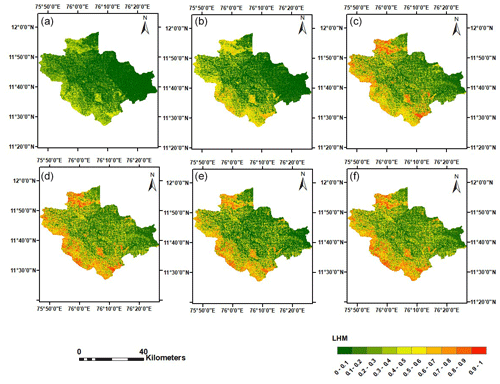
Figure 9Landslide hazard maps for different periods of time: (a) 1 year, (b) 2 years, (c) 5 years, (d) 10 years, (e) 20 years, and (f) 50 years.
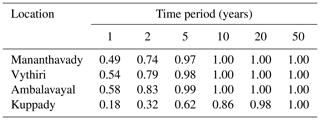
The temporal probability of landslides (Table 2) over N years was calculated using joint conditional exceedance probability values. The conditional probability values show that, as the duration increases, the probability value decreases.
Thus, the maximum exceedance value was observed for a 3 d period in the Mananthavady, Vythiri, Ambalavayal, and Kuppady regions. Equation (5) was then used to calculate the temporal probability for each region of Wayanad over various time periods.
4.3 Landslide susceptibility mapping
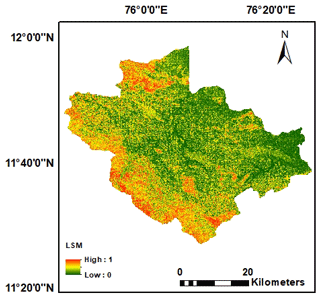
The map indicating the likelihood of landslides occurring (Fig. 7) was made by taking into account various factors that contribute to landslides. To confirm the accuracy of this map, the ROC curve was used. The LSM created using the random forest had an AUC value of 0.84, indicating a more accurate prediction, as shown in Fig. 8.
The feature selection shows that slope has the greater influence on landslide susceptibility, followed by SPI, TWI, and NDVI. The feature relevance of SPI and TWI demonstrates the indirect influence of rainfall on these parameters. The SPI shows the erosion power of water, whereas the TWI reflects soil saturation (Riihimäki et al., 2021; Mandal et al., 2021). The NDVI has an impact on the stream power index as well.
4.4 Landslide hazard mapping
The landslide hazard maps were prepared by integrating the temporal probability of landslides with the landslide susceptibility. The exceedance probability of each region was obtained as the temporal probability using the copula function, and then it was multiplied by the landslide susceptibility map to obtain the LHM (Fig. 9), showing the landslide hazard proneness calculated for time periods of 1, 2, 5, 10, 20, and 50 years. According to the hazard assessment, during a period of 1 to 2 years, the landslide hazard proneness was in the low and medium range of 70 %–80 % and 10 %–20 %, respectively. Over the period of 5 to 10 years, 30 %–40 % of the area is at medium hazard and 50 %–60 % is at moderate hazard. The area that is at high hazard proneness rises to 20 %–30 % after 10 years. The validity of the hazard map is proven when compared with the landslide occurrence on 3 July 2022 in the Vythiri region of Wayanad (https://www.manoramaonline.com/, last access: 29 June 2023). The results show that the landslide occurred in the area that was identified to be more hazard-prone, as predicted by the map. This confirms the importance of using such maps in preventing natural disasters and protecting lives and property.
The research discusses the use of a joint-probability approach to determine the temporal probability of landslides based on the intensity and duration of rainfall, the triggering factors. To determine the temporal probability, an empirical rainfall threshold was computed based on previous landslide occurrences. The research found that different regions of Wayanad such as Mananthavady, Vythiri, Ambalavayal, and Kuppady had varying rainfall intensities that could trigger landslides, including 19.08, 86.01, 18.24, and 25.47 mm d−1, respectively. The copula functions were used to obtain the temporal probability of landslides as the joint conditional exceedance probability of rainfall variables such as intensity and duration. The exceedance probability values obtained showed that, as the duration increased, the probability value decreased. Landslide hazard maps for different periods were prepared by integrating the landslide susceptibility and the temporal probability of landslides. The variation in the hazard proneness of different regions of Wayanad demonstrated the spatial relevance of multi-site rainfall information. The study concluded that the copula approach could analyze the combined effect of variables, thus reducing the impacts of natural hazards such as landslides.
The code cannot be made publicly available at this time because the current work is still in progress. However, the authors can make the codes available with a genuine and reasonable request. All of the original data used in this study are freely available from their respective sources.
The work was conceptualized by SDS and AS. SDS retrieved and analyzed the data, as well as carried out the implementation. The draft was prepared by SDS. The paper was revised by AS. The research was overseen by AS.
The contact author has declared that neither of the authors has any competing interests.
Publisher's note: Copernicus Publications remains neutral with regard to jurisdictional claims made in the text, published maps, institutional affiliations, or any other geographical representation in this paper. While Copernicus Publications makes every effort to include appropriate place names, the final responsibility lies with the authors.
This article is part of the special issue “Mountain Hydrology and Cryosphere”. It is a result of the International Conference on Mountain Hydrology and Cryosphere, Kathmandu and Dhulikhel, Nepal, 9–10 November 2023.
Shamla Dilama Shamsudeen acknowledges the Department of Science and Technology for recommending them for the WISE-KIRAN PhD Fellowship for sanctioning the project entitled “Regional hazard mapping of Western Ghats of Kerala, India accounting the temporal probability of rainfall” (grant no. DST/WISE-PhD/EA/2023/1, TPN-95768).
This research has been supported by the Department of Science and Technology, Ministry of Science and Technology, India (grant no. DST/WISE-PhD/EA/2023/1, TPN-95768).
Abraham, M. T., Satyam, N., Rosi, A., Pradhan, B., and Segoni, S.: The Selection of Rain Gauges and Rainfall Parameters in Estimating Intensity-Duration Thresholds for Landslide Occurrence: Case Study from Wayanad (India), Water, 12, 1000, https://doi.org/10.3390/w12041000, 2020.
Achu, A. L., Joseph, S., Aju, C. D., and Mathai, J.: Preliminary analysis of a catastrophic landslide event on 6 August 020 at Pettimudi, Kerala State, India, Landslides, 18, 1459–1463, https://doi.org/10.1007/s10346-020-01598-x, 2021.
Ajin, R. S., Nandakumar, D., Rajaneesh, A., Oommen, T., Ali, Y. P., and Sajinkumar, K. S.: The tale of three landslides in the Western Ghats, India: lessons to be learnt, Geoenviron. Disast., 9, 16, https://doi.org/10.1186/s40677-022-00218-1, 2022.
Berti, M., Bernard, M., Gregoretti, C., and Simoni, A.: Physical Interpretation of Rainfall Thresholds for Runoff-Generated Debris Flows, J. Geophys. Res.-Earth, 125, e2019JF005513, https://doi.org/10.1029/2019jf005513, 2020.
Bezak, N., Šraj, M., and Mikoš, M.: Copula-based IDF curves and empirical rainfall thresholds for flash floods and rainfall-induced landslides, J. Hydrol., 541, 272–284, https://doi.org/10.1016/j.jhydrol.2016.02.058, 2016.
Crozier, M. J.: Deciphering the effect of climate change on landslide activity: A review, Geomorphology, 124, 260–267, https://doi.org/10.1016/j.geomorph.2010.04.009, 2010.
Haile, M. M.: Bivariate Flood Frequency Analysis: A case study of Rib River, Upper Blue Nile Basin, Ethiopia, ARRUS J. Eng. Technol., 2, 46–64, https://doi.org/10.35877/jetech489, 2022.
Hao, L., Rajaneesh A., van Westen, C., Sajinkumar K. S., Martha, T. R., Jaiswal, P., and McAdoo, B. G.: Constructing a complete landslide inventory dataset for the 2018 monsoon disaster in Kerala, India, for land use change analysis, Earth Syst. Sci. Data, 12, 2899–2918, https://doi.org/10.5194/essd-12-2899-2020, 2020.
Kim, H., Lee, J.-H., Park, H.-J., and Heo, J.-H.: Assessment of temporal probability for rainfall-induced landslides based on nonstationary extreme value analysis, Eng. Geol., 294, 106372, https://doi.org/10.1016/j.enggeo.2021.106372, 2020.
Lee, J. H., Kim, H., Park, H.-J., and Heo, J.-H.: Temporal prediction modeling for rainfall-induced shallow landslide hazards using extreme value distribution, Landslides, 18, 321–338, https://doi.org/10.1007/s10346-020-01502-7, 2020.
Mandal, K., Saha, S., and Mandal, S.: Applying deep learning and benchmark machine learning algorithms for landslide susceptibility modelling in Rorachu river basin of Sikkim Himalaya, India, Geosci. Front., 12, 101203, https://doi.org/10.1016/j.gsf.2021.101203, 2021.
Pabaghi, Z., Bazrafshan, O., Zamani, H., Shekari, M., and Singh, V. P.: Bivariate Analysis of Extreme Precipitation Using Copula Functions in Arid and Semi-Arid Regions, Atmosphere, 14, 275, https://doi.org/10.3390/atmos14020275, 2023.
Riihimäki, H., Kemppinen, J., Kopecký, M., and Luoto, M.: Topographic Wetness Index as a Proxy for Soil Moisture: The Importance of Flow-Routing Algorithm and Grid Resolution, Water Resour. Res., 57, https://doi.org/10.1029/2021wr029871, 2021.
Segoni, S., Piciullo, L., and Gariano, S. L.: A review of the recent literature on rainfall thresholds for landslide occurrence, Landslides, 15, 1483–1501, https://doi.org/10.1007/s10346-018-0966-4, 2018.
Shiau, J. T.: Fitting Drought Duration and Severity with Two-Dimensional Copulas, Water Resour. Manage., 20, 795–815, https://doi.org/10.1007/s11269-005-9008-9, 2006.
Zhang, L. and Singh, V. P.: Bivariate Rainfall and Runoff Analysis Using Entropy and Copula Theories, Entropy, 14, 1784–1812, https://doi.org/10.3390/e14091784, 2012.


