the Creative Commons Attribution 4.0 License.
the Creative Commons Attribution 4.0 License.
 | 19 Apr 2024
Calculating flood probability in Obihiro using a probabilistic method: incorporating the probability of dike failure with uncertainty
Fumihiko Uemura
Guus Rongen
Shigekazu Masuya
Takatoshi Yoshida
Tomohito J. Yamada
In Japan, estimating flood risk follows a deterministic approach. A probabilistic risk method, as adapted in the Netherlands, would be better suited for the quantitative evaluation of flood damage. This study applies such a method in Obihiro, Hokkaido, northern island of Japan. We modelled dike failure with the mechanism overtopping. The probability of dike failure is calculated with a Monte Carlo simulation, considering uncertainties in water levels, critical flow velocity, and dike heights. This results in more accurate failure probabilities compared to the deterministic approach. Additionally, we corrected the dike failure probability for upstream dike failures because these reduce downstream water levels. This conditional flood probability is about 1/10th of the independent situation, indicating a significant effect of considering dike failure in dependence on upstream failures.
- Article
(849 KB) - Full-text XML
- BibTeX
- EndNote


In assessing risk information, determining dike failure conditions is crucial, significantly influencing hazard evaluation. In Japan, the commonly used criterion for dike failure conditions is the Planned High Water Level (HWL) in flood control plans. However, actual dike failures can result from factors like overtopping, erosion, and seepage, differing from flood control plan criteria. Numerous cases have been reported where levees didn't breach despite water levels exceeding the HWL (MLIT, 2020).
Determining dike failure conditions is considered effective through probabilistic evaluation of multiple failure modes and uncertainties in dike failure. The United States and European countries have already incorporated a probabilistic assessment of failure modes into policies. In the Netherlands, a dike failure probability evaluation model accommodating multiple failure modes has been developed. Additionally, a risk-based approach that plans flood countermeasures based on floodplain risk has been introduced, indicating a growing integration of probabilistic considerations into disaster preparedness (Vergouwe, 2016).
This study aims to develop a Dike Failure Probability (DFP) evaluation model tailored to the target river's characteristics for the quantitative assessment of flood risk in Japan.
The key points of our research approach are as follows:
-
We constructed a model that considers the temporal variation of hydraulic conditions and uncertainties inherent to the breach process. This is particularly relevant in Japan, characterized by steep-gradient rivers where water levels, their temporal changes, and associated uncertainties are significant.
-
We proposed a method that considers the presence or absence of upstream breaches in determining the downstream DFP. In Japan, the flooding pattern is characterized by flush flood, where damages vary at each breach point, accounting for upstream overtopping or breaches and their impact on downstream discharge reduction is essential.
These two aspects form the foundation of our study, addressing the unique challenges posed by Japan's rivers, where damages vary at breach points, and the probability of downstream breaches changes due to upstream breaches.
2.1 Target area
This research focuses on the urban area of Obihiro City in Hokkaido, Japan. The DFP evaluation was conducted at 0.2 km intervals within the KP53.8 to KP62.8 section of the Tokachi River, which is adjacent to the study area. “KP” indicates the distance from the river mouth, and the Tokachi River is managed by the MLIT.
2.2 Model of dike failure due to overtopping
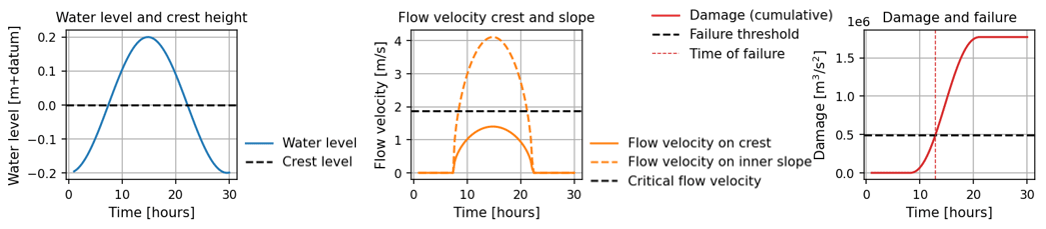
We developed the model to assess dike failure due to overtopping, which is the most prevalent failure mode in Japan. The process of failure due to overtopping is assumed to occur when the river water level exceeds the crest height, leading to the flow of floodwaters down the slope, resulting in erosion of the slope. An overview of the failure determination by the model is shown in Fig. 1, where (a) depicts the dike height and the time-series water level, and (b) illustrates the crest velocity and slope velocity. Flow velocity occurs during periods when the water level in (a) exceeds the dike height. (c) show the cumulative work on the slope and the threshold for dike failure determination. Erosion occurs in the range where slope velocity in (b) exceeds the critical erosion velocity. Dike failure is determined when the cumulative work (i.e., the total transferred energy) on the slope surpasses the threshold for failure determination.
Specifically, the dike failure model used Eqs. (1) and (2) to calculate overtopping discharge from the water level at the dike crest.
The velocity at the toe of the slope uslope,t is calculated based on the overtopping discharge qt and the slope gradient α using Eq. (3), with a roughness coefficient f set at 0.08:
Subsequently, the occurrence of dike failure was determined using the cumulative value of the work done by the slope, which Dean et al. (2010) proposed as an indicator influencing dike erosion. The work done on the slope at a given time.
here, KW is the coefficient for the work done by erosion, βW consolidates terms involving water mass density and shear stress, and uc,W is the critical flow velocity at which work is done on the slope. Erosion occurs when . The threshold value for erosion occurrence under good turf growth conditions was determined as:
2.3 Probability evaluation using a Monte Carlo simulation
The DFP due to overtopping was calculated using a Monte Carlo (MC) simulation, following the approach of Tabata et al. (2015). In the MC simulation, uncertainties involved in the process are represented as variables with probability distributions and incorporated into the model. The DFP, Pfailure was determined using Eq. (6):
here, N represents the total number of calculations in the MC simulation, and nfailure is the count of instances where dike failure is determined. In this study, the total number of calculations was set to 10 000. The boundary conditions for the model were defined by a hydrograph. Assuming a sine curve shape with a period of T=30 hours the hydrograph was created using Eqs. (7), (8).
Equation (7) represents the pre-established relationship for the river under consideration, denoted as the H−Q relationship. The parameter Qpeak was varied in increments of 500 m s−1, and the DFP was assessed for each flow rate, resulting in a relationship between discharge and the DFP.
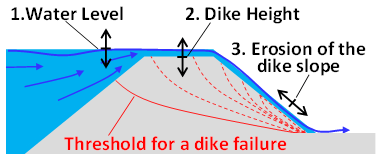
We assessed the uncertainties associated with elements within the developed model, focusing on water level, dike height, and erosion of the slope, as illustrated in Fig. 2.
2.3.1 Water level
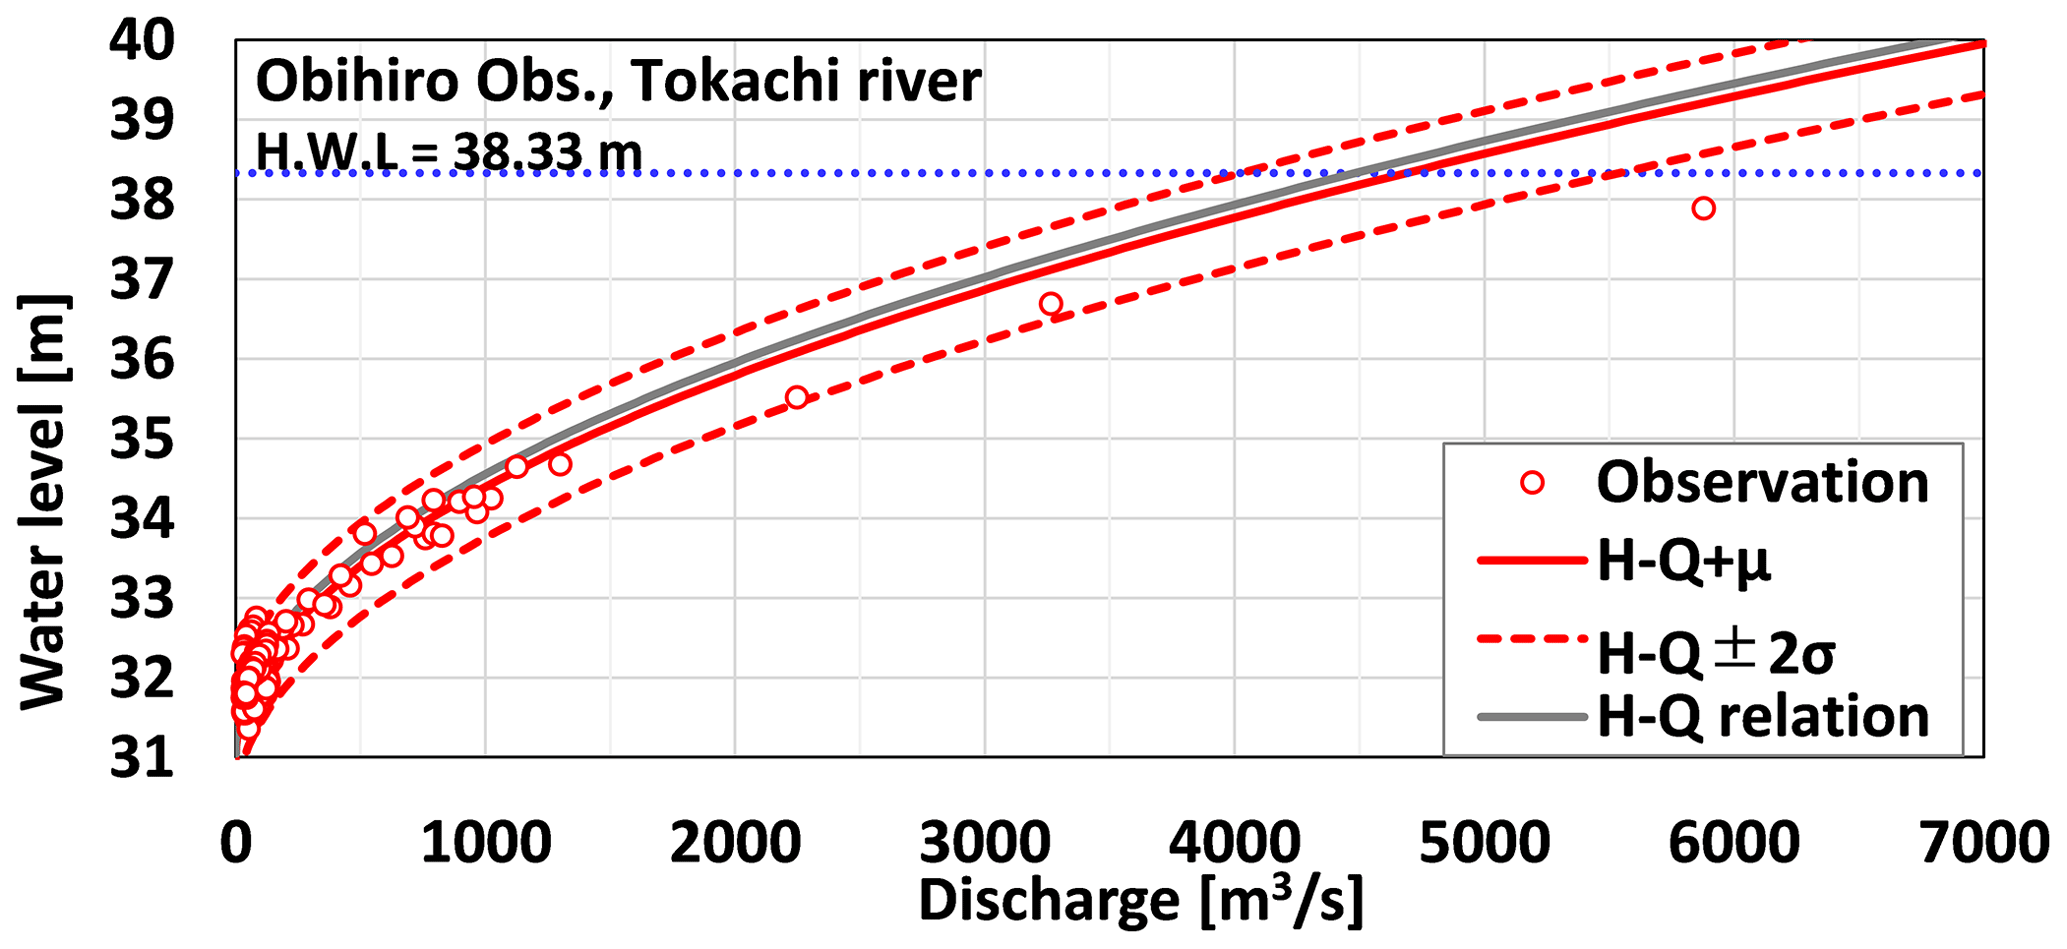
In this study, we incorporated water level as a random variable in the MC simulation due to the non-uniform relationship between water level and discharge in actual flood events, influenced by changing channel morphology and water surface gradient. Figure 3 shows the variability in observed data around the H−Q equation, indicating water level and discharge at each flood event's peak. To model water level as a random variable, we calculated the mean and variance of differences between water levels from the H−Q equation and observed values using Eqs. (9), (10).
here, hObs. represents the observed peak water level, hH−Q denotes the water level based on the H−Q equation, n is the number of observed samples, μWL represents the mean value of water level errors, is the variance, and indicates the water level for each MC simulation.
In the MC simulation, we assumed a normal distribution for the probability distribution, because conventionally the H−Q equation has been derived by assuming a normal distribution for errors in observed water levels and discharges, determining coefficients “a” and “b” through a least squares minimization.
Additionally, the water level variability in this study excludes two elements: variation with discharge magnitude and temporal changes within a single event. Future verification should consider improvements in observation accuracy and data accumulation.
2.3.2 Dike height
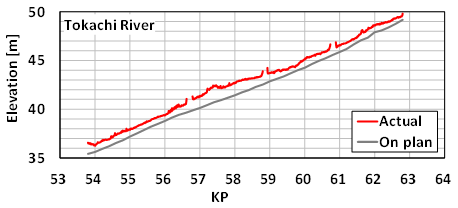
In this study, we treated dike height as one of the random variables in the MC simulation. This is because dike height changes over time due to the heterogeneity of soil inside the dike and construction conditions. Figure 4 illustrates the planned dike height and the actual dike height. The actual dike height data were obtained at 10 m intervals in the longitudinal direction from the LP survey. To incorporate dike height as a random variable in the model, we calculated the mean and variance of the differences between the planned dike height and the actual dike height using Eqs. (11), (12).
Here, hactual represents the actual levee height, hplan is the planned levee height, n is the number of survey points in the 100 m section centered around each KP, is the error in levee height at the evaluation point KP, is the variance, and denotes the levee height in each MC simulation run.
In the MC simulation, we assumed that the variance of dike height follows a normal distribution. Identifying the actual distribution is challenging, given the various factors influencing dike height variation, such as the heterogeneity of soil during construction, weather conditions, and construction methods. Verification through advancements in observational techniques for dike internal structures and data accumulation is anticipated in the future.
Additionally, it's essential to acknowledge that when defining dike height variability in this study, independence among data intervals is unconfirmed if a singular event results in subsidence or damage surpassing a 10 m data interval. Future refinement of data intervals will require verification of the scale of events causing displacement.
2.3.3 Erosion of the dike slope
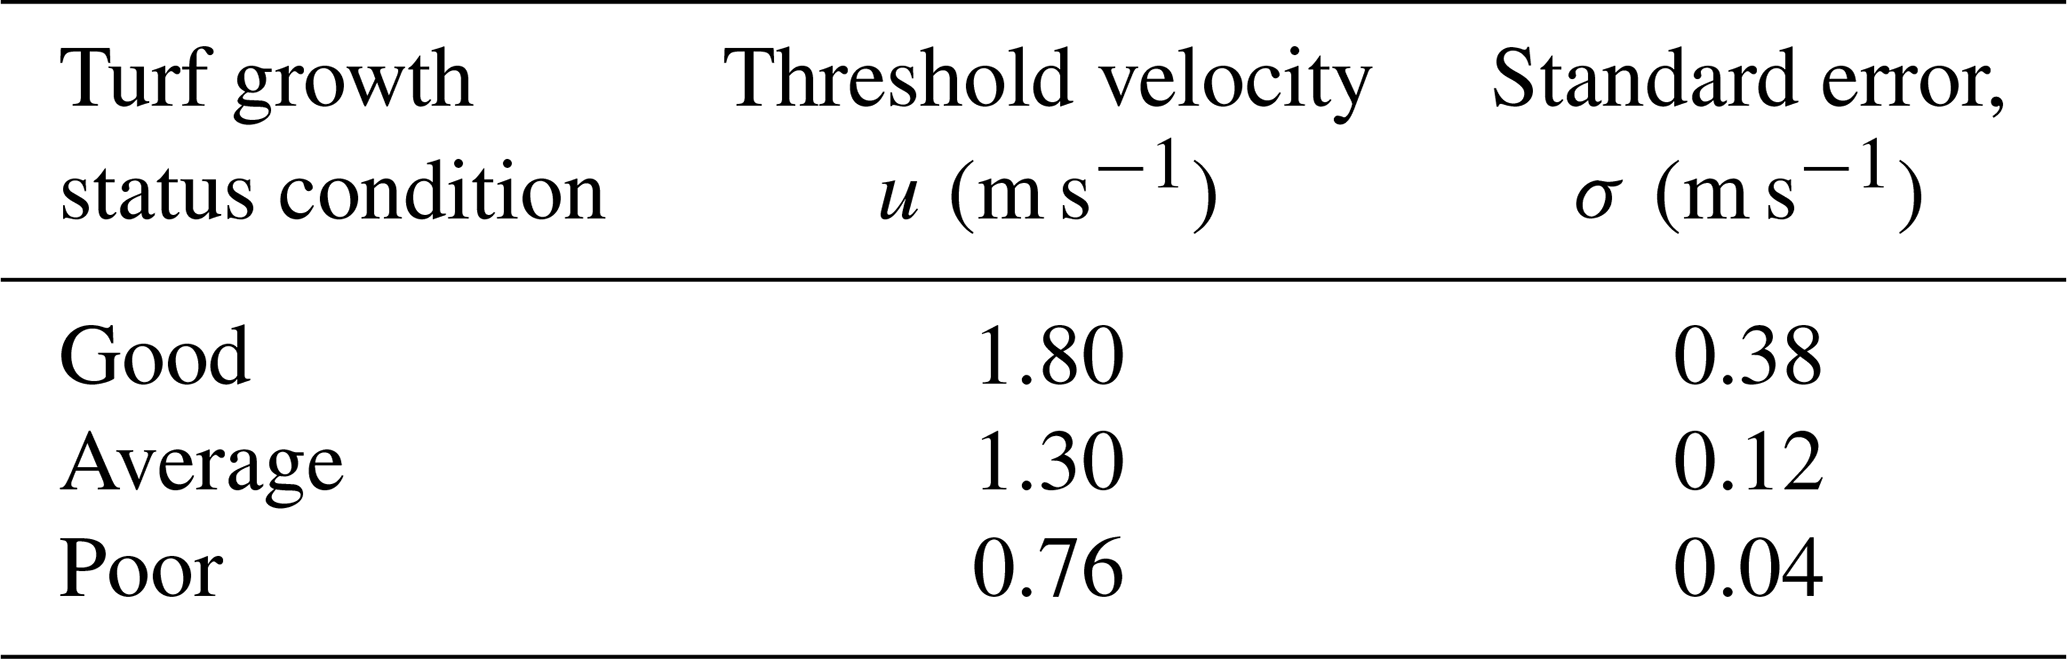
In the MC simulation, the erosion resistance of the turf on the levee slope was treated as a random variable (). This approach accounts for the heterogeneity present in the condition of the turf. The erosion resistance of the turf was calculated using Eq. (13). The critical velocity (uCritical) for erosion occurrence and its variance () were set based on Table 1 under conditions of good turf growth, as established by Dean et al. (2010).
2.4 Integration of dike failure probabilities
This study uses a method incorporating point dependence to calculate the DFP for the entire levee section. Each point is termed a “segment”, and segments with similar inundation are integrated into a “section”. Complete dependence is assumed within a section, while partial dependence is considered between sections. This accommodates varying dependence based on the longitudinal levee scale in fast-flowing rivers. For adjacent points, higher DFP for an upstream section reduces downstream DFP due to decreased river flow. However, for segments further apart, the dependence impact diminishes, as the upstream breach may return flood flow to the river.
Initially, under the assumption of dependence between segments, we computed the DFPs for each section at various discharge conditions using Eq. (14), where dike failure occurs at the point with the maximum DFP within the section, and no failure occurs at other points:
here, Pf,section represents the DFP in a specific section, and |q denotes the conditional probability at discharge q. stands for the DFP in segment i. The parameter n indicates the number of segments included within the section.
Next, assuming that no dike failure occurs in downstream sections if a failure occurs in an upstream section (partial dependence), we calculated the DFP for the entire levee. Specifically, according to Eq. (15), the DFP for the uppermost section remains unaffected by other breach points since it is not influenced by upstream dike failures. For downstream sections, as per Eqs. (16) to (18), the DFP is determined by multiplying the non-DFP of the upstream section by the DFP in the respective downstream section.
⋮
here, represents the DFP considering dependence, |q denotes the conditional probability at discharge q, and n indicates the number of sections. The DFP for the entire levee section under a specific discharge condition ( is calculated according to Eq. (18) as the sum of the DFPs considering dependence for each section.
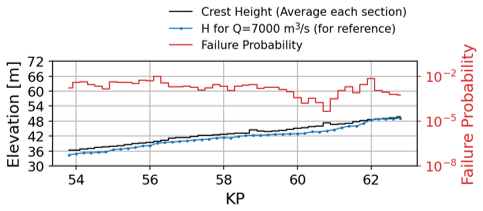
Figure 5 depicts the segment DFP along the Tokachi River (10−5 to 10−2) across its length. At 7000 m3 s−1 discharge, near crest height, a correlation is observed between increased freeboard and reduced failure probability. KP60.8, with higher conveyance capacity, exhibits the lowest DFP.
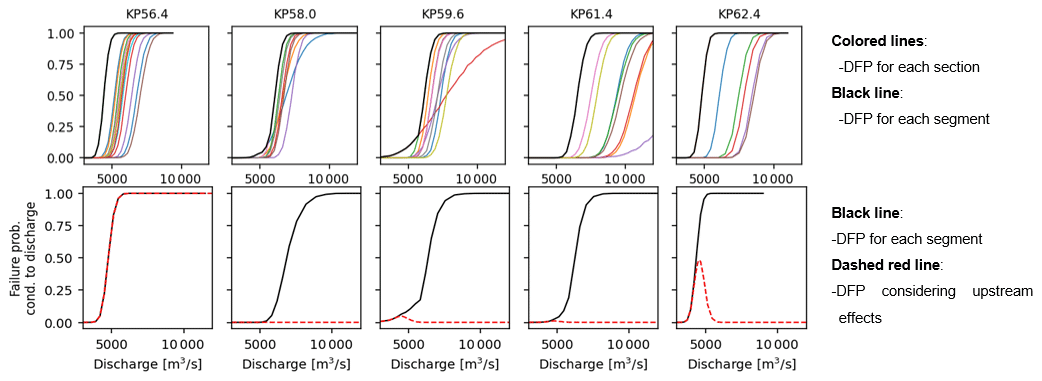
The DFP in Fig. 5 are grouped into section DFP (see Sect. 2.4). Figure 6, upper row, presents the DFP for all segments (colored lines), with the section's DFP derived from the maximum values (solid black line). The bottom graphs shows the adjusted DFP by deducting the upstream DFP, resulting in the dashed red lines. In the uppermost segment, under flow conditions exceeding 5000 m3 s−1, the DFP reaches 100 %. Consequently, downstream sections under the same discharge have a DFP of 0 %.
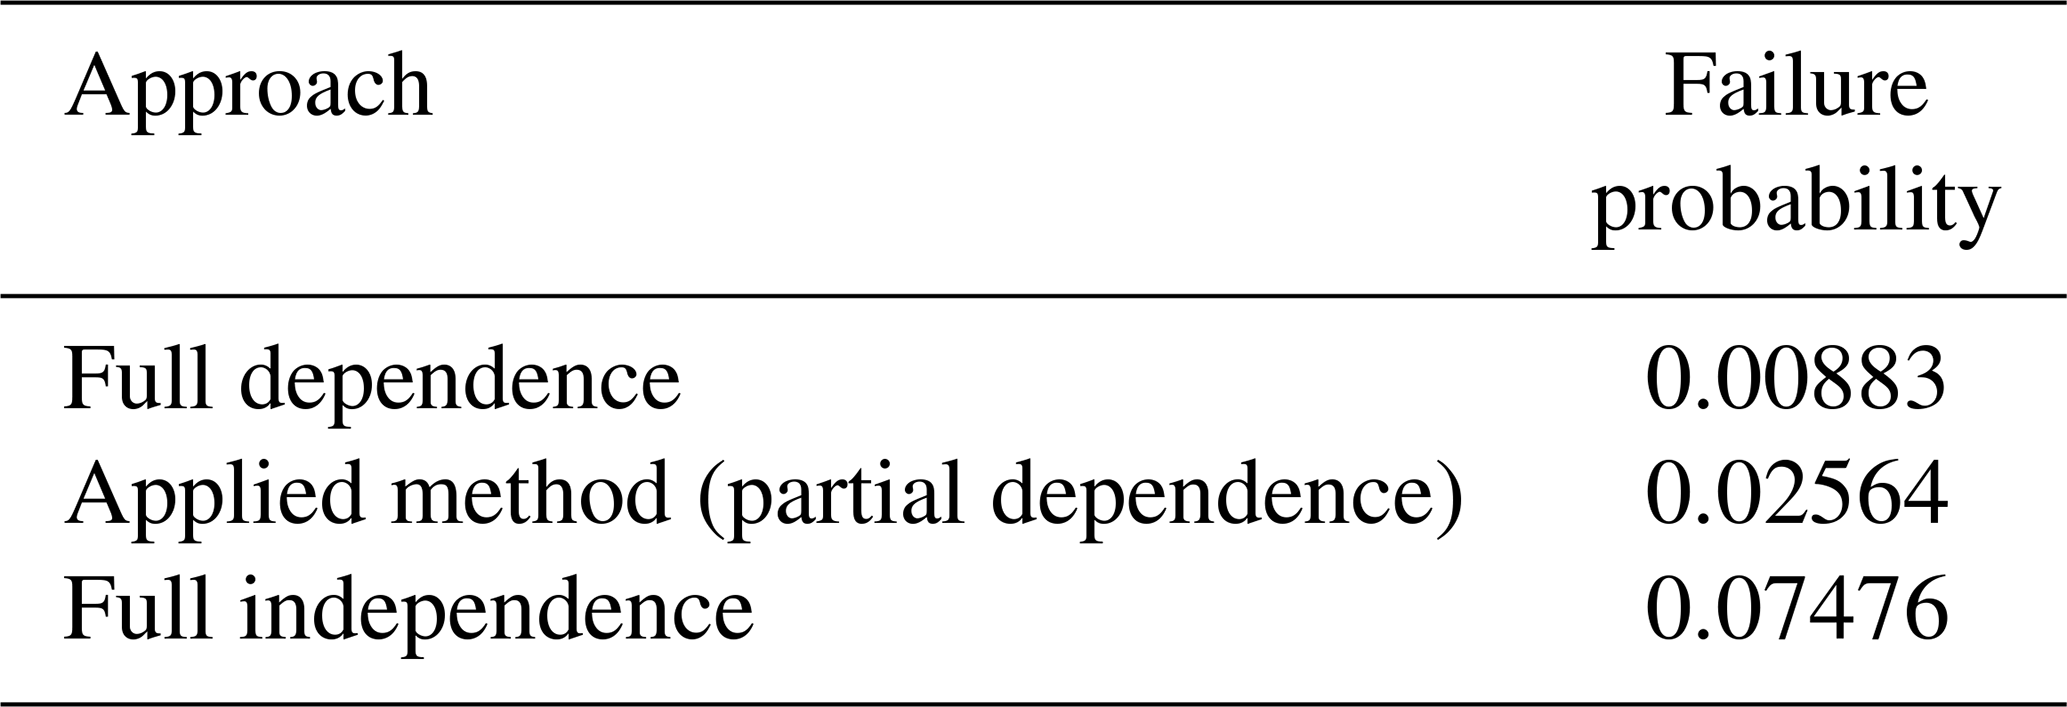
Table 2 shows DFP in the entire target area under varying dependence conditions in each section. The chosen dependence model notably impacts DFP values. Evaluating DFP along floodplains with downstream flooding, like the studied river, requires considering interdependence in breach occurrences.
The fact that the DFP for each section corresponded to flow capacity indicates that the constructed model represents breach probabilities aligned with susceptibility to overflow. Moving forward, it is essential to verify elements, probability distributions, and levels of impact that should be incorporated into the model as uncertainties.
In this study, mathematical methods represented the reduction in downstream DFP from upstream breaches. Future work will incorporate hydrological approaches for downstream discharge reduction due to flooding, ensuring the consideration of upstream breaches on downstream flow in DFP assessment.
This study aims to quantify flood risk in the context of flash flood conditions in steep-gradient river. It involves the construction of a model to assess levee breach conditions as probabilities and proposes a method for calculating breach probabilities considering upstream levee breaches. The research outcomes are as follows:
-
Developed a breach probability evaluation model that considers uncertainties associated with overtopping events.
-
Highlighted the necessity of considering interdependence between breach points in breach events.
The datasets generated and/or analyzed during the current study are available from the corresponding author on reasonable request.
FU planned, conducted, and analyzed the research, and wrote the manuscript. GR performed analysis and interpretation. SM and TY contributed to research conceptualization. TJY supervised the project. All authors approved the final manuscript for publication.
The contact author has declared that none of the authors has any competing interests.
Publisher’s note: Copernicus Publications remains neutral with regard to jurisdictional claims made in the text, published maps, institutional affiliations, or any other geographical representation in this paper. While Copernicus Publications makes every effort to include appropriate place names, the final responsibility lies with the authors.
This article is part of the special issue ”ICFM9 – River Basin Disaster Resilience and Sustainability by All”. It is a result of The 9th International Conference on Flood Management, Tsukuba, Japan, 18–22 February 2023.
The study received additional support from the Rijkswaterstaat and the MLIT's Hokkaido Regional Development Bureau for providing data. The Embassy of the Kingdom of the Netherlands in Japan assisted in reporting and promoting the project's results.
This research has been supported by the Rijksdienst voor Ondernemend Nederland (grant no. PVW4S19009).
This paper was edited by Daisuke HARADA and reviewed by Masafumi YAMADA and one anonymous referee.
Dean, R. G., Rosati, J. D., Walton, T. L., and Edge, B. L.: Erosional equivalences of levees: Steady and intermittent wave overtopping, Ocean Eng., 37, 104–113, https://doi.org/10.1016/j.oceaneng.2009.07.016, 2010.
Ministry of Land, Infrastructure, Transport and Tourism: Technical Study Committee Report on River Dikes of the Damage Caused by Typhoon No. 19, Hagibis, https://www.mlit.go.jp/river/shinngikai_blog/gijutsu_kentoukai/dai03kai/pdf/houkokusyo.pdf (last access: 30 January 2024), 2020.
Vergouwe, R.: The national flood risk analysis for the Netherlands: final report, Rijkswaterstaat VNK Project Office, OCLC 952522344, 2016.
Tabata, K., Fukuoka, S., and Sezaki, T.: Study on evaluation method for probability of levee failures during large scale flood, Journal of Japan Society of Civil Engineers, Ser. B1 (Hydraulic Engineering), 71, I_1273–I_1278, https://doi.org/10.2208/jscejhe.71.I_1273, 2015.