the Creative Commons Attribution 4.0 License.
the Creative Commons Attribution 4.0 License.
Regional Characteristics of shape and stagnation of rainfall in Japan using Radar/Raingauge Analyzed Precipitation product
Yuta Ohya
Tomohito J. Yamada
Recently, floods and sediment disasters caused by line-shaped rainbands (LRBs) have increased in frequency following events such as the torrential rainfall around Tokyo of September 2015, which flooded the Kinu River, Japan. During this event, the shape of the rainfall area matched the topology of the river basin, causing water levels to rise rapidly and resulting in a serious disaster. Therefore, the shape and duration of heavy rainfall patterns are critical factors that must be considered for flood prevention. In this study, we examined features of LRBs in river basins across Japan using long-term radar raingauge data, and investigated relationships between rainfall intensity, shape, duration, and quantity.
- Article
(2802 KB) - Full-text XML
- BibTeX
- EndNote
Japan is located in the East Asian monsoon region, where rainfall is concentrated in summer/autumn season due to typhoons and the Baiu. Except for meso-α-scale or larger rainfall events associated with these seasonal patterns, most heavy rainfall in Japan is caused by mesoscale convective systems (MCSs), 40 %–60 % of which are long and narrow (Tsuguchi and Kato, 2014). Line-shaped rainbands (LRBs) are composed of multiple linearly organized cumulonimbus clouds that produce stagnant rainfall over the same area for several hours. However, the size of these rainfall areas varies widely, ranging from several hundred to several thousand square kilometers, which is on the scale of river basins in Japan. Many of LRBs have influenced the flow of first-order rivers as well as smaller rivers in Japan, such as torrential flooding of the Kinu River near Tokyo in September 2015 and the Kuma River in Kyushu in July 2020. These events caused serious damage due to rainfall stagnation over river basins.
The physical mechanisms of LRBs have been investigated using numerical models and Doppler radar observations (e.g., Kato, 1998, 2006, 2020; Yoshizaki et al., 2000). Statistical analysis of radar rainfall data was first conducted by Bluestein and Jain (1985), who analyzed an 11-year dataset in the USA and classified 52 linear MCSs into five classes (broken line, back-building, broken area, embedded area, and other). Later, Houze et al. (1990) and Parker and Johnson (2000) reclassified linear MCSs into two or three classes, based on a combination of convective and stratiform clouds. Schumacher and Johnson (2005) analyzed 76 MCSs that occurred during a 3-year period for the three classes proposed by Parker and Johnson (2000), plus two frequently occurring, unclassified MCS types. Based on these classification systems, regional and seasonal trends of other MCSs were analyzed by Stevenson and Schumacher (2014) and Haberlie and Ashley (2019). Feng et al. (2016) used a 35-year observational dataset to show an increasing trend in the number of MCSs in recent years. Furthermore, Fairman et al. (2016) and Ashley et al. (2019) investigated features relating to LRBs in the United States. Prein et al. (2017) applied a climate projection model to show that the frequency and amount of rainfall will increase in a future climate.
Shimura et al. (2000) classified 37 heavy rainfall events in the Japanese Kanto region over a 4-year period into frontal organization and multiple- and single-cell movement classes. Seko (2010) categorized back-building, squall line, and back-and side-building MCS rainfall in the USA using previous case analyses and classification systems. Yamada et al. (2012) examined the spatiotemporal distribution and environmental characteristics of LRBs in northern Japan based on 21 years of observations. Tsuguchi and Kato (2014) showed that among 286 heavy rainfall events throughout Japan during a 15-year observation period, 64.8 % involved LRBs. Unuma and Takemi (2016) investigated the rainfall shape, duration, amount, and environmental characteristics of 4133 events in Japan using an 8-year observation dataset.
In this study, we investigated the relationship between rainfall duration and shape associated with LRBs in Japan using long-term, nationwide observational datasets. LRBs were extracted using an algorithm proposed by Hirockawa et al. (2020) and revised with some thresholds by Ohya and Yamada (2023; OY22 hereafter).
2.1 Datasets
In this study, we used the Radar/Raingauge Analyzed Precipitation product (RA; Nagata, 2011), which is a composite of C-band radar rainfall data corrected using ground-based rain gauge data managed by the Japan Meteorological Agency. The spatial resolution was 5 km when data delivery began in 1988, but was increased to 2.5 km in 2001, and to 1 km in 2006. These changes are improvements due to the expanded radar and ground rain gauges used. In this study, to analyze long-term trends, we standardized the resolution through bilinear interpolation to 5 km, and data from 1988 to 2019 were used.
2.2 LRBs definition
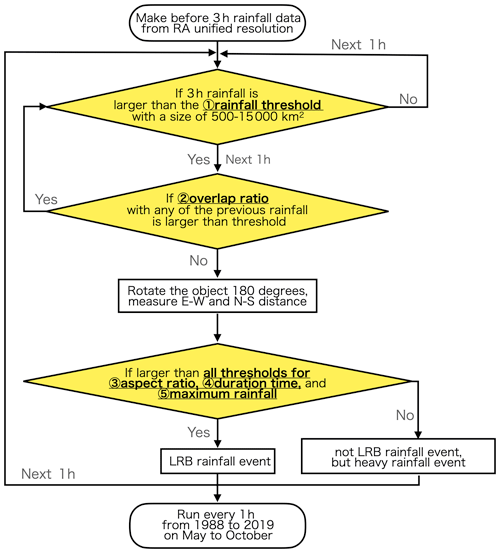
A flowchart of the LRBs extraction process is shown in Fig. 1. This method was based on that of Hirockawa et al. (2020), using a threshold proposed by OY22. First, closed curves that satisfy 40 mm per 3 h before the rainfall event were extracted, and an area of 500–15 000 km2 was selected as the target area of intense rainfall as a meso-β-scale criterion. If the area overlap threshold was ≥40 % of the rainfall area in the previous 3-h rainfall period, both were considered to be the same event, indicating stagnation. For each 3 h rainfall area, the aspect ratio of the major axis to the minor axis was calculated as an indicator of the shape of the area. In this study, we adopted the OY22 LRBs definition to apply statistical analyses to many regions. Thus, LRBs were defined as having an aspect ratio of ≥2.5, a stagnation time of ≥4 h, and a maximum grid rainfall of 35 mm h−1 in all heavy rainfall events. In this study, heavy rainfall events are considered to be those that satisfy the rainfall and area thresholds of the algorithm; LRBs are assumed to satisfy the aspect ratio and duration time criteria for such events.
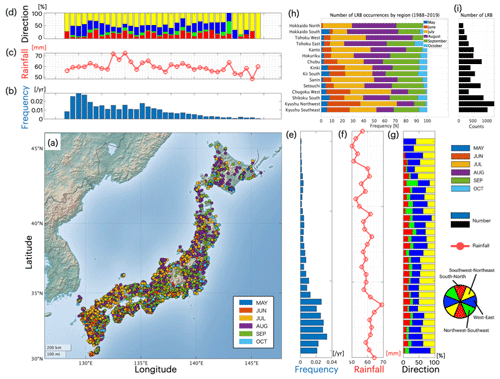
Figure 2Distribution of LRBs during May–October period from 1988 to 2019 according to (b) latitude and (e) longitude, normalized by land area. Average rainfall according to (c) latitude and (f) longitude. Rainband orientation according to (d) latitude and (g) longitude. (h) Frequency of LRBs occurrence by month and total LRBs numbers for each region.
Through LRBs extraction, we obtained 15 119 heavy rainfall events, among which 5240 were LRBs (Fig. 2). The locations where LRBs occurred during May–October from 1988 to 2019 are plotted in Fig. 2a, along with average rainfall and LRBs orientation according to longitude and latitude. LRBs also occurred in northern parts of Japan such as the Tohoku and Hokkaido regions, although they were relatively common in Kyushu and western Japan (Fig. 2a). The frequency distributions of these rainfall events according to longitude and latitude (Fig. 2b, e) indicate that LRBs frequency was higher in the west and south, and lower in the east and north. The average rainfall amount was higher for LRBs in the south than for those in the north, but not higher for LRBs in western Japan than for those in the east (Fig. 2c, f). In the northwest Kyushu region, the southwestern part of Japan, more than half of all rainfall areas appeared in June and July, indicating that LRBs oriented in the east–west and southwest-northwest directions were significantly more frequent in this region. Many of the LRBs extracted in this study appear to have been generated during the Baiu season, although heavy rainfall events extracted in the Chubu, southern Kii, and Kanto regions (see Fig. 4 for the detail locations) mainly occurred from August to September, corresponding to the typhoon season; many of these events were directly caused by typhoons and topography. Around 140° E, particularly near 37–38° N, larger proportions of LRBs were oriented in the northwest-southeast direction (green color, Fig. 2d, g), which is typical of LRBs generated from the Sea of Japan toward the Hokuriku and Tohoku regions.
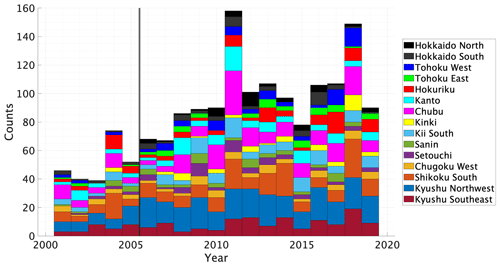
Figure 3Interannual variation in LRBs occurrence by region. Colors indicate the regions where the center coordinates are located.
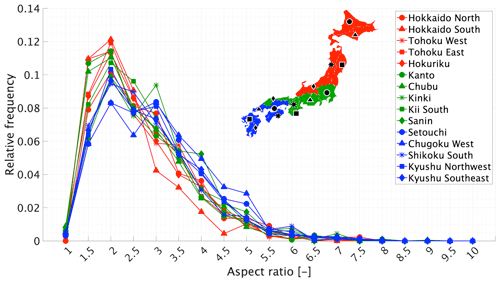
Figure 4Frequency of LRBs aspect ratios by region. Colors indicate the regions where the center coordinates are located.
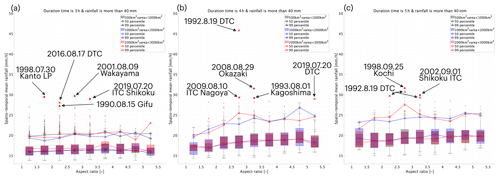
Figure 5Box and whisker plots of the relationship between rainfall intensity and aspect ratio. Lines represent means, box borders represent 25th and 75th percentiles, whiskers represent 1.5× the interquartile range, and dots and crosses represent outliers. The dates and regions of the top five rainfall events are indicated for rainfall durations of (a) 3 h, (b) 4 h, and (c) 5 h. Precipitation directly caused by tropical cyclones are indicated by dashes.
The numbers of LRBs that occurred in each region during May–October from 1988 to 2019 are plotted in Fig. 3. The annual mean was 101, with a standard deviation of 20. Years with particularly high LRBs occurrence included 1993, 1998, 2011, and 2018, which correspond to years with many heavy rainfall events nationwide due to typhoons and Baiu fronts as large-scale disturbances. Although few events occurred from 2001 to 2007, the spatial resolution of RA changed in 2001. Although this study interpolated the data to standardize the resolution, the analysis results may have been affected by the resolution change. Similarly, the spatial resolution changed in 2006, such that simple comparisons based on the same resolution are possible only after 2006. The Mann–Kendall test rejected our results for the Kinki and southern Chugoku regions (P<0.05), indicating an increasing trend.
The frequency distributions of heavy rainfall aspect ratios for each region are shown in Fig. 4. The aspect ratio indicates the ratio of the major axis to the minor axis of the rainfall area. A larger aspect ratio represents a more elongated shape, while a smaller aspect ratio represents a more blocky shape. Empirically, an aspect ratio of 2.5 or higher is often associated with LRBs. In all regions, aspect ratios of 2 to 2.5 showed the highest frequency, and significantly fewer events had larger aspect ratios, indicating a high degree of linearity. Large aspect ratios were more frequent in southern regions (blue, Fig. 4) than in all other regions.
Relationships between aspect ratio and rainfall intensity according to date, location, and duration for 7424 rainfall events that occurred from May to October during 1988–2019 are shown in Fig. 5. For average rainfall events, there was no significant relationship between aspect ratio and rainfall intensity. However, many extreme rainfall events had aspect ratios of 1–3.5. For example, some strong, short-duration heavy rainfall events showed a linear relationship with aspect ratio, such as torrential rains of 101 mm h−1 recorded at Kurisugawa site, in Kii South region, in August 2001, and the 92 mm h−1 rainfall event recorded in Yokohama site, near Tokyo, in July 1998, which was the largest rainfall event to have occurred since the station was established. More than 60 % of all rainfall area corresponded to localized torrential rains of 1000 km2 or smaller. Among 4 h rainfall events, both the median and 95th percentile values indicate that rainfall intensity increased with the aspect ratio (Fig. 5b), and extreme rainfalls, including the 8.1 disaster in Kyushu, in 1993, and the Okazaki city torrential rainfall in 2008, in Chubu, showed a linear relationship for aspect ratios of 2–4. Among 5 h rainfall events, no significant relationship with aspect ratio was detected, although the 95th percentile value tended to increase with the aspect ratio at aspect ratios close to 2.5 (Fig. 5c). Similar trends were observed nationally and regionally throughout Japan.
In this study, we examined the nationwide distribution of LRBs using long-term rainfall data for May to October during 1988–2019, as well as relationships between rainfall shape, duration, amount, and intensity. We extracted 15,119 meso-β-scale heavy rainfall events from datasets covering all of Japan during the study period. Among these, approximately 40 % of rainfall events had a duration of ≥4 h, and 5240 were LRBs. Both the number of LRBs and rainfall amount were significantly more frequent in the south than in the north, and almost 80 % were in Kyushu and along the coast of the Pacific Ocean (i.e., southern Shikoku, southern Kii, central Japan, and Kanto). The most frequent aspect ratio range was 2.0–2.5, which indicates shape linearity, and this distribution pattern was similar over broad regions of Japan. Significantly more rainbands were oriented in the east-west direction in Kyushu, where rainfall is concentrated during the Baiu season, and in the southwest-northeast direction in other areas. In southern Shikoku and southern Kii, the algorithm implemented in this study extracted heavy rainfall events that were directly caused by typhoons. Among non-stagnant heavy rainfall events, there was no significant relationship between rainfall amount and aspect ratio for many events. Extreme rainfall events were concentrated within an aspect ratio of 2.0–3.5. These results suggest that linear shape may contribute to rainfall intensity, regardless of rainfall duration and area. A future study should investigate the physical properties influencing the precipitation efficiency of LRBs.
The software code used in this study is not publicly accessible. The reasons for not making the code available include: The software code contains proprietary algorithms and methods that are part of ongoing research and development projects. Public disclosure at this stage could compromise competitive advantage and intellectual property rights.
The primary data utilized in our research are available for purchase from the Japan Meteorological Business Support Center (JMBSC). These data can be accessed through the following link: https://www.jma.go.jp/jma/jma-eng/jma-center/rsmc-hp-pub-eg/techrev/text13-2.pdf (Nagata, 2011). The methodologies employed in analyzing the data are detailed in Ohya and Yamada (2023).
YO: Conceptualization; data curation; formal analysis; investigation; methodology; project administration; software; validation; visualization; writing – original draft; writing-review & editing. TJY: Conceptualization; data curation; funding acquisition; methodology; project administration; resources; software; supervision; validation; writing – original draft; writing-review & editing.
The contact author has declared that neither of the authors has any competing interests.
Publisher's note: Copernicus Publications remains neutral with regard to jurisdictional claims made in the text, published maps, institutional affiliations, or any other geographical representation in this paper. While Copernicus Publications makes every effort to include appropriate place names, the final responsibility lies with the authors.
This article is part of the special issue “ICFM9 – River Basin Disaster Resilience and Sustainability by All”. It is a result of The 9th International Conference on Flood Management, Tsukuba, Japan, 18–22 February 2023.
This study is supported by the Council for Science, Technology and Innovation (CSTI), Cross-ministerial Strategic Innovation Promotion Program (SIP), Development of a Resilient Smart Network System against Natural Disasters, with funding provided by the National Research Institute for Earth Science and Disaster Resilience (NIED), and The Advanced Studies of Climate Change Projection (SENTAN) (grant no. JPMXD0722680734) from the Ministry of Education, Culture, Sports, Science, and Technology (MEXT), Japan.
This work was supported by MEXT – Program for the advanced studies of climate change projection (SENTAN) (grant no. JPMXD0722680734) and the Cross-Ministerial Strategic Innovation Promotion Program (SIP) Enhancement of Societal Resiliency against Natural Disasters and KAKENHI (grant nos. 20J2193800, 22H0159402, and 19J0096322).
This paper was edited by Daisuke HARADA and reviewed by two anonymous referees.
Ashley, W. S., Haberlie, A. M., and Strohm, J.: A climatology of quasi-linear convective systems and their hazards in the United States, Weather Forecast., 34, 1605–1631, 2019.
Bluestein, H. B. and Jain, M. H.: Formation of mesoscale lines of precipitation: Severe squall lines in Oklahoma during the spring, J. Atmos. Sci., 42, 1711–1732, 1985.
Fairman Jr., J. G., Schultz, D. M., Kirshbaum, D. J., Gray, S. L., and Barrett, A. I.: Climatology of banded precipitation over the contiguous United States, Mon. Weather Rev., 144, 4553–4568, https://doi.org/10.1175/MWR-D-16-0015.1, 2016.
Feng, Z., Leung, L. R., Hagos, S., Houze, R. A., Burleyson, C. D., and Balaguru, K.: More frequent intense and long-lived storms dominate the springtime trend in central US rainfall, Nat. Commun., 7, 13429, https://doi.org/10.1038/ncomms13429, 2016.
Haberlie, A. M. and Ashley, W. S.: A radar-based climatology of mesoscale convective systems in the United States, J. Climate, 32, 1591–1606, 2019.
Hirockawa, Y., Kato, T., Tsuguchi, H., and Seino, N.: Identification and classification of heavy rainfall areas and their characteristic features in Japan, J. Meteorol. Soc. Jpn. Ser. II, 98, 835–857, 2020.
Houze, R. A., Smull, B. F., and Dodge, P.: Mesoscale organization of springtime rainstorms in Oklahoma, Mon. Weather Rev., 118, 613–654, 1990.
Kato, T.: Numerical simulation of bandshaped torrential rain observed over the southern Kyushu, Japan on 1 August 1993, J. Meteor. Soc. Jpn., 76, 97–128, 1998.
Kato, T.: Structure of the band-shaped precipitation system inducing the heavy rainfall observed over northern Kyushu, Japan on 29 June 1999, J. Meteor. Soc. Jpn., 84, 129–153, 2006.
Kato, T.: Quasi-stationary band-shaped precipitation systems, named “senjo-kousuitai”, causing localized heavy rainfall in Japan, J. Meteor. Soc. Jpn., 98, 485–509, 2020.
Nagata, K.: Quantitative precipitation estimation and quantitative precipitation forecasting by the Japan Meteorological Agency, RSMC Tokyo–Typhoon Center Technical Review, 13, 37–50, 2011 (data available at: https://www.jma.go.jp/jma/jma-eng/jma-center/rsmc-hp-pub-eg/techrev/text13-2.pdf, last access: 13 August 2024).
Ohya, Y. and Yamada, T. J.: Characteristics of line-shaped rainbands regarding duration, shape, and rainfall intensity in northern Japan using the Radar/Raingauge-Analyzed Precipitation Product, IOP Conf. Ser.-Earth Environ. Sci., 1136, 012025, https://doi.org/10.1088/1755-1315/1136/1/012025, 2023.
Parker, M. D. and Johnson, R. H.: Organizational modes of midlatitude mesoscale convective systems, Mon. Weather Rev., 128, 3413–3436, 2000.
Prein, A. F., Liu, C., Ikeda, K., Trier, S. B., Rasmussen, R. M., Holland, G. J., and Clark, M. P.: Increased rainfall volume from future convective storms in the US, Nat. Clim. Change, 7, 880–884, 2017.
Schumacher, R. S. and Johnson, R. H.: Organization and environmental properties of extreme-rain-producing mesoscale convective systems, Mon. Wather Rev., 133, 961–976, 2005.
Seko, H.: Study of the shapes and maintenance mechanisms of meso-β scale line-shaped precipitation systems in the middle-latitudes, J. Meteorol. Res., 62, 1–3, 2010 (in Japanese).
Shimira, K., Hara, H., and Yamada, T.: Study in deneration mechanism and classification of rainfall by the images of radar raingauge in the Kanto plain, P. Hydraul. Eng., 44, 97–102, 2000 (in Japanese).
Stevenson, S. N. and Schumacher, R. S.: A 10-year survey of extreme rainfall events in the central and eastern United States using gridded multisensor precipitation analyses, Mon. Weather Rev., 142, 3147–3162, 2014.
Tsuguchi, H. and Kato, T.: Objective Extraction of Heavy Rainfall Events and Statistical Analysis on their Characteristic Features, Tenki, 61, 455–469, 2014 (in Japanese).
Unuma, T. and Takemi, T.: Characteristics and environmental conditions of quasi-stationary convective clusters during the warm season in Japan, Q. J. Roy. Meteor. Soc., 142, 1232–1249, 2016.
Yamada, T. J., Sasaki, J., and Matsuoka, N.: Climatology of line-shaped rainbands over northern Japan in boreal summer between 1990 and 2010, Atmos. Sci. Lett., 13, 133–138, https://doi.org/10.1002/asl.373, 2012.
Yoshizaki, M., Kato, T., Tanaka, Y., Takayama, H., Shoji, Y., Seko, H., Arao, K., Manabe, K., and members of X-BAIU-98 observation: Analytical and numerical study of the 26 June 1998 orographic rainband observed in western Kyushu, Japan, J. Meteor. Soc. Jpn., 78, 835–856, 2000.


