the Creative Commons Attribution 4.0 License.
the Creative Commons Attribution 4.0 License.
 | 19 Apr 2024
Long-range streamflow prediction using a distributed hydrological model in a snowfed watershed
Akiyuki Kawasaki
Inadequate planning of spring snowmelt discharge can lead to wastage of water resources for various purposes such as hydropower and lead to reduced capacity of the dams to control floods during rainy season. In this research we analyze how much can the predictive skill of long-range forecasts be improved by using a distributed hydrological model. We used the Water and Energy Budget-based Distributed Hydrological Model with improved snow physics (WEB-DHM-S) for generating long-range forecasts with a lead time of up to 3 months for the case of Kurobe River Basin in Japan. The predictive skills of two sets of simulations were compared (i) climatology and (ii) ensemble stream flow prediction (ESP). In the case of ESP, the initial conditions of WEB-DHM-S are updated using real-time datasets from Radar-AMeDAS, AMeDAS and JRA55. We found that the model initial conditions are particularly important during the spring snowmelt season and can improve the forecast predictive skills quite significantly compared with the climatology.
- Article
(4155 KB) - Full-text XML
- BibTeX
- EndNote


Streamflow forecasts play an important role in adequate management of water resources, such as through the operation of dam reservoirs for flood control or hydropower generation. The predictive skill of hydrometeorological forecasts depends upon the model structure/parameterization, meteorological forecasts and the model initial moisture (snow, soil) conditions (Koster et al., 2010).
While the accuracy of meteorological forecasts at shorter lead times is improving, their accuracy at longer lead times is still unreliable. With the advancement in the development of physically based distributed hydrometeorological models it is becoming possible to estimate initial moisture (snow, soil) conditions quite accurately. These initial conditions can play a very important role in improving the predictive skills of long-range meteorological forecasts. Hydropower dam reservoir operators often require long-range forecasts for planning reservoir operations. The simplest way to obtain these forecasts is to use climatology, which is quite commonly used by hydropower reservoir operators. However, hydropower dam reservoirs are often located in mountainous regions where snowmelt runoff plays an important role in hydropower production. Here, the initial conditions of snow (in addition to soil) can play an important role in improving the predictive skills of the long-range forecasts.
The objective of this study is to evaluate the importance of initial moisture (snow, soil) conditions in improving the hydrometeorological forecasts compared with the use of climatology. At first, we develop a long-range (3-month lead time) forecasting system using historical meteorological observation (available in real-time) and the Water and Energy Budget-based Distributed Hydrological Model with improved snow physics (WEB-DHM-S). Then we compared the predictive skills of this forecasting system with climatology for hindcasts initialized in different seasons to evaluate the contribution of the initial conditions in the predictive skills of streamflow forecasts.
For the purpose of this study, we used the case of Kurobe River basin in Japan, a snowfed watershed which receives heavy snowfall in the winter season. The snowmelt runoff provides water to a cascade of hydropower dam reservoirs operated by Kansai Electric Power Company (KEPCO).
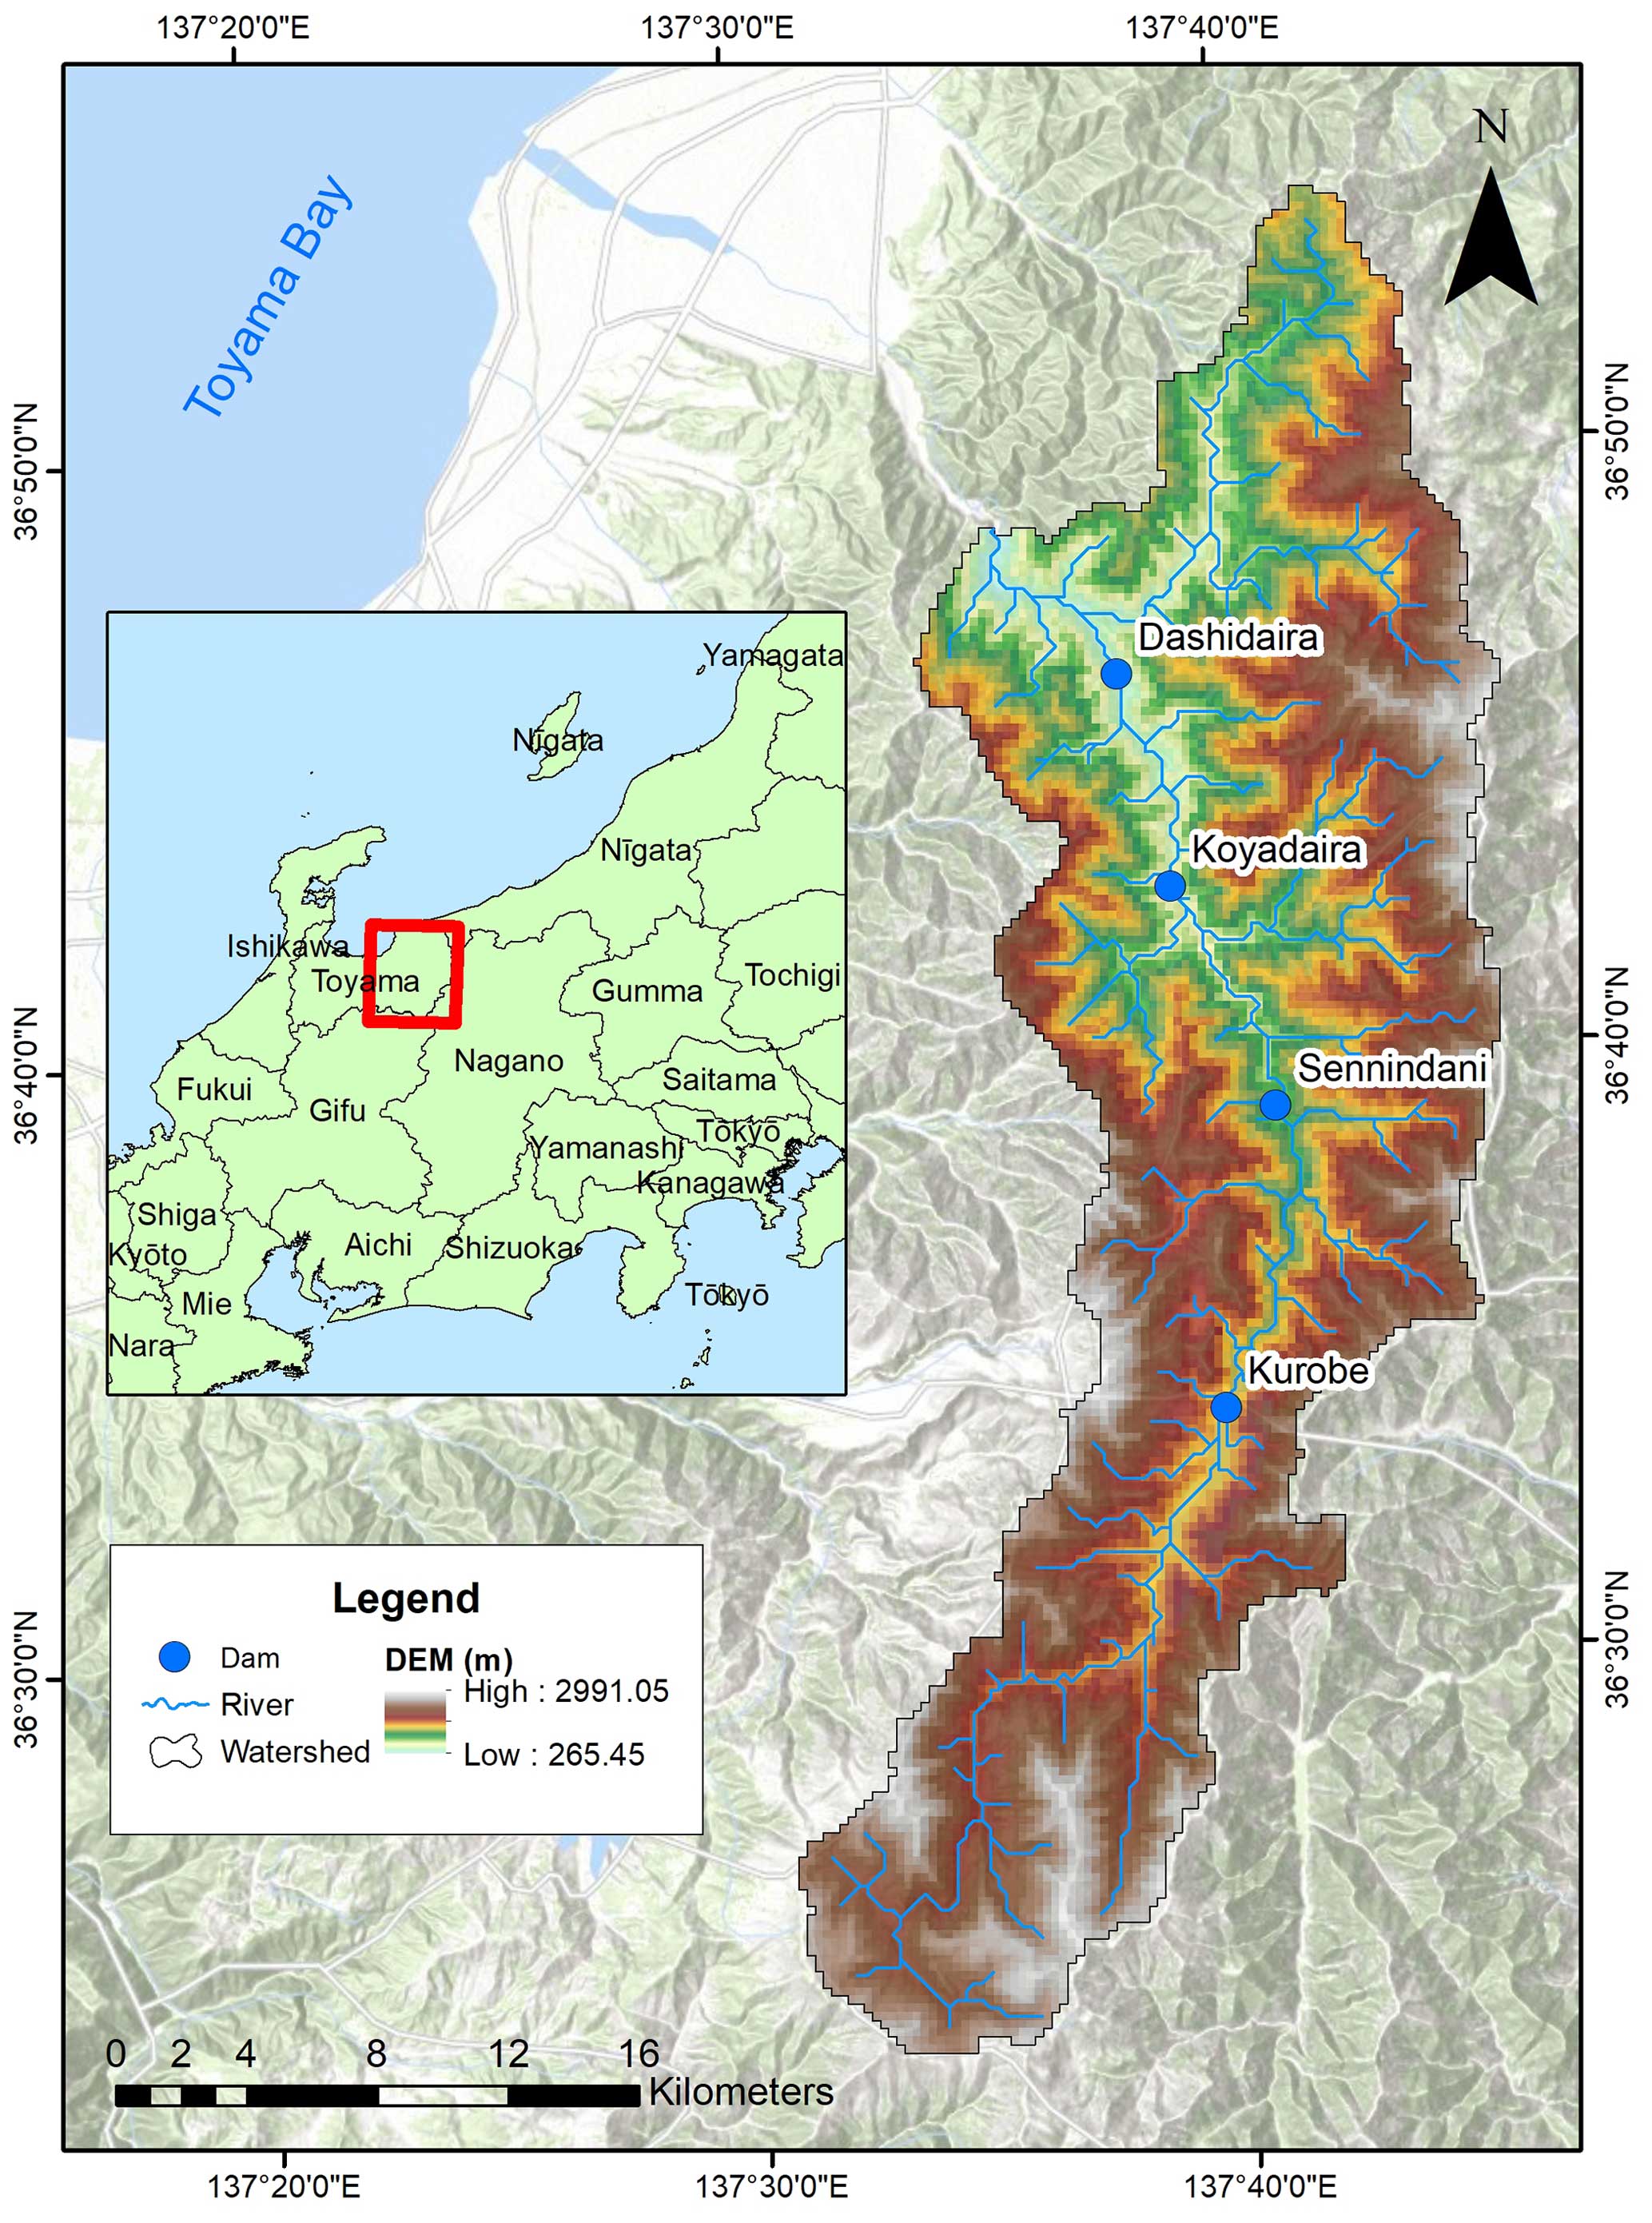
Figure 1Kurobe River basin and the location of hydropower dams in Kurobe River basin.
There are a total of four hydropower dams in this river basin (see Fig. 1). Kurobe Dam is the largest dam out of the four with the highest regulating capability. Since the inflows to the downstream dams are heavily influenced by the operation of Kurobe Dam, in this study we have only considered the area upstream of Kurobe Dam reservoir.
3.1 Description of WEB-DHM-S
For hydrological modelling of the watershed and for hydrometeorological forecasting we used the latest iteration of WEB-DHM-S in this study called the 4-component WEB-DHM-S model. The original WEB-DHM-S model is capable of representing turbulent fluxes (water and energy) and can simulate snow processes and variables such as snow depth, snow density and spatial snow cover in addition to river discharge (Shrestha et al., 2010).
The latest iteration of WEB-DHM-S has been reframed into four main components (i) the land surface component, (ii) the vertical soil moisture solver, (iii) hillslope runoff processes, and (iv) kinematic wave routing. In addition, the latest iteration of WEB-DHM-S also allows saving a “snapshot” of the model state variables (including the snow variables) and use them as initial conditions for forecasting. Furthermore, the new version of the model is also more computationally efficient due to the use of parallel programming. These features make this new version of the model very suitable for real-time hydrometeorological forecasting.
3.2 Model setup and datasets
Datasets can be divided into two categories, (i) static datasets and (ii) dynamic datasets. Static datasets include the Digital Elevation Model (DEM) from Japan Geospatial Institute, the soil type from Food and Agriculture Organization and the land use type from United States Geological Survey. Dynamic datasets include the Leaf Area Index and the Fraction of Photosynthetically Active Radiation, both of which were obtain from MODIS sensors. Further dynamic datasets include the meteorological forcings, which are very important for forecasting. In this study the precipitation data was obtained from Radar-AMeDAS (Automated Meteorological Data Acquisition System), which has a resolution of 1 km and a temporal resolution of 30 min. Air temperature is based on the station observations from AMeDAS and is corrected for elevation by using the vertical temperature profile from JRA55 (Japanese 55-year reanalysis). The remaining meteorological variables such as wind speed, relative humidity, downward longwave and shortwave radiation etc. were also obtained from JRA55. The WEB-DHM-S model was set at a resolution of 250 m and all of the datasets were regridded to this resolution. More details about the datasets and data pre-processing are explained by Moiz et al. (2022).
For model validation and evaluation of the skills of forecasts, we used the observed inflow to Kurobe dam, point snow depth at Kurobe dam and the satellite observed snow cover. Kurobe dam inflow and point snow depth data were obtained from KEPCO and the snow cover data was obtained from MODIS sensor.
3.3 Experiments
We conducted four different kinds of experiments to evaluate the importance of the model initial conditions in the predictive skills of hydrometeorological forecasts. 13 years of data was used from 2008–2020. In all of these experiments, the model is already fully calibrated and validated against river discharge, point snow depth and satellite snow cover data (see Moiz et al., 2022 for details). These experiments are visually explained in Fig. 2a–d.
In the first forecast experiment, the model is run continuously for 13 years from 2008–2020. The output of the model in this case is called Perfect Forecast and acts as the upper bound for the skill of forecast, as the skill of any forecast cannot be better than this forecast. During this process, the states (initial conditions) of the model are also saved for every month. The second forecast experiment is called ESP (Ensemble Streamflow Prediction) Forecast. In this case, the model is initialized using previously saved states for each time when the forecast is issued (every month). The ensemble meteorological forecast in this case is obtained by resampling the historical data using a leave-one-year-out approach.
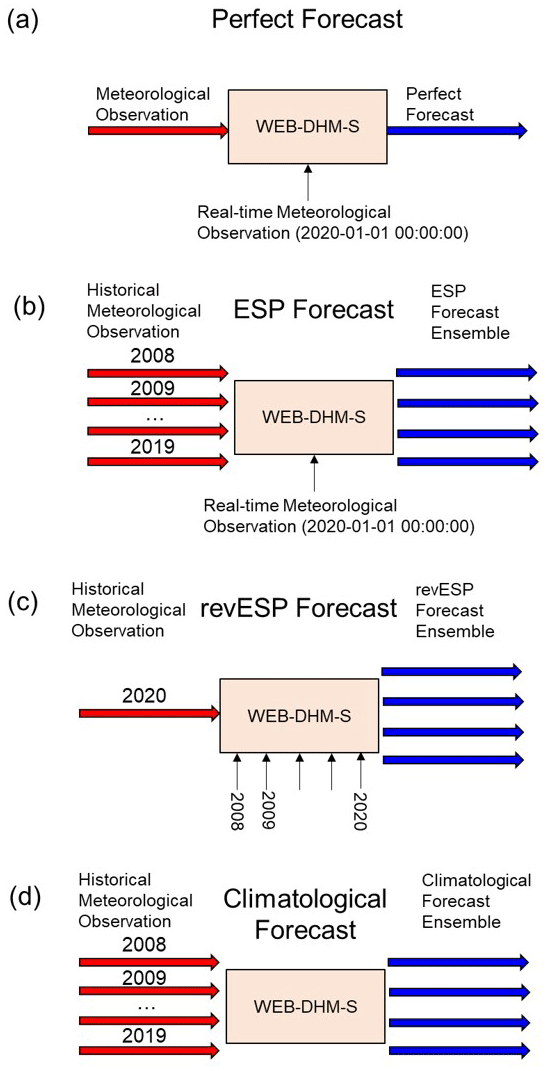
Figure 2Setting of all the different experiments used to generate forecasts (a) Perfect Forecast (b) ESP Forecast (c) revESP Forecast and (d) Climatological Forecast. Here, the red arrows represent meteorological inputs, the blue arrows show hydrometeorological outputs and the black arrows show the meteorological data used for model initialization.
For example, for the forecast issued on January 2017, meteorological data for all the years except 2017 is used leading to 12 ensemble members. In the case of revESP (reverse ESP) experiment, the reverse is true. An ensemble of initial conditions is used to generate hydrometeorological forecasts using the leave-one-year-out approach, but the perfect meteorological forecast is used. For example, for the forecast issued on January 2017, the initial conditions for January from all the years except 2017 are used while the meteorological forecast is based on the year 2017. In the case of the ESP Forecast experiment, the entire skill of the forecast is contributed by the initial conditions whereas in the case of revESP Forecast experiment, the entire skill is contributed by meteorological forecasts. In a final experiment called the Climatological Forecast, both the initial condition and the meteorological forecast are obtained using the leave-one-year-out approach. This forecast acts as the lower benchmark as this is entirely based on climatological information.
3.4 Forecast evaluation metrics
The ESP forecast is evaluated against the perfect forecast and climatological forecast using the continuous ranked probability score (CRPS) and the continuous ranked probability skill score (CRPSS).
Here, P(x) is cumulative density function of the ensemble forecast, whereas the Pa(x) is the cumulative density function of the observation (in this case, the perfect forecast). The value of CRPS ranges from 0 (perfect) to +∞ (no skill) and the values of CRPSS ranges from −∞ (no skill) to 1 (perfect). In case of CRPSS, climatology is used as the reference. A value of 1 means perfect skills, value of 0 means no skills compared to climatology and a negative value indicates that the forecast is has less skills than the climatology.
We then further also compared the ESP and revESP by comparing their relative mean squared errors (MSE) with each other following Wood and Lettenmaier (2008).
A relative MSE close to 0 indicates a higher predictive skill compared to climatology whereas a relative MSE close to 1 indicates a poor predictive skill similar to that of climatology.
4.1 Model calibration and validation
The WEB-DHM-S model was calibrated for the year 2011 and then validated for 2012–2014. The calibration process involved tuning the soil parameters, the snow process parameters as well as the radar snowfall correction parameters. In general, the model showed a high accuracy as discussed in Moiz et al. (2022). We further also validated the entire time series of river discharge simulation using data from 2008–2020. The model exhibited reasonable accuracy with a Nash coefficient of 0.79 and a percentage BIAS of −12.02 %.
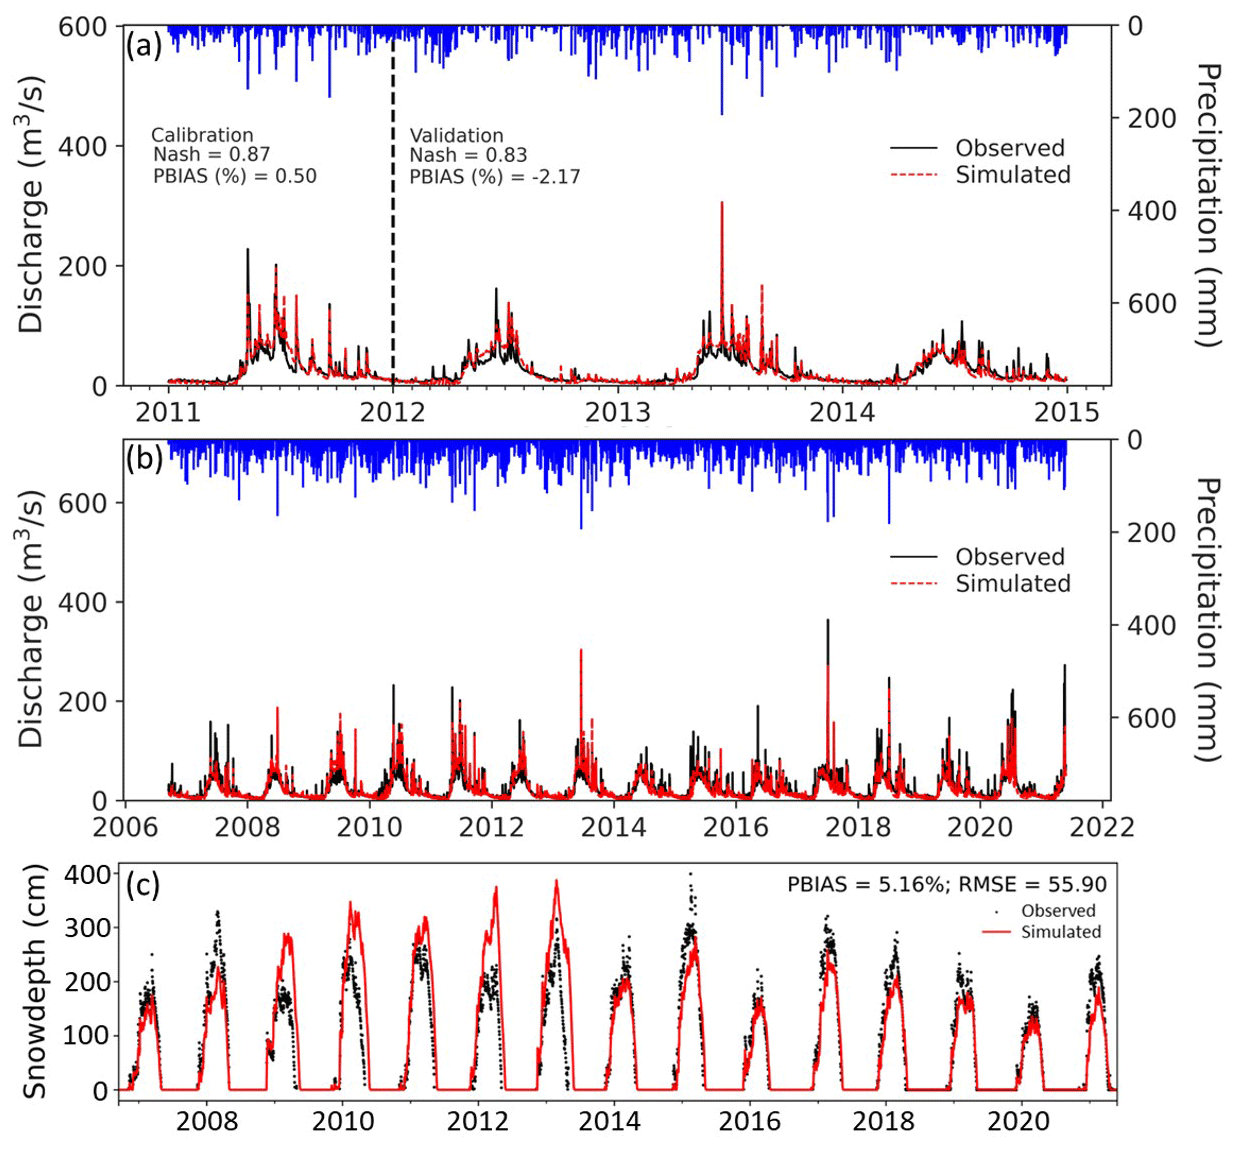
Figure 3Comparison of the WEB-DHM-S river discharge simulation and observation. (a) Calibration (2011) and Validation (2012–2014). (b) Entire simulation period (2008–2020).
The model was also validated against point snow depth observation (see Fig. 3c) and satellite snow cover (not shown here), both of which were also reasonably simulated. Snow depth at Kurobe can reach a maximum of around 4 m depth and starts melting in April where it contributes to Kurobe dam inflow. Most of this snow melts until the end of May. Therefore, in these two months initial condition of snow is very important for predicting snow melt runoff.
4.2 Long-range hydrometeorological forecasts
In all the experiments, forecasts are issued at the beginning of every month with a lead-time of 3-months. In the case of ESP forecast, for example, the initial condition is obtained using actual meteorological forcings and running the model up to the real-time (in this case, the time when the forecast is to be issued). An example of the forecast issued on 1 May 2010 is shown in Fig. 4.
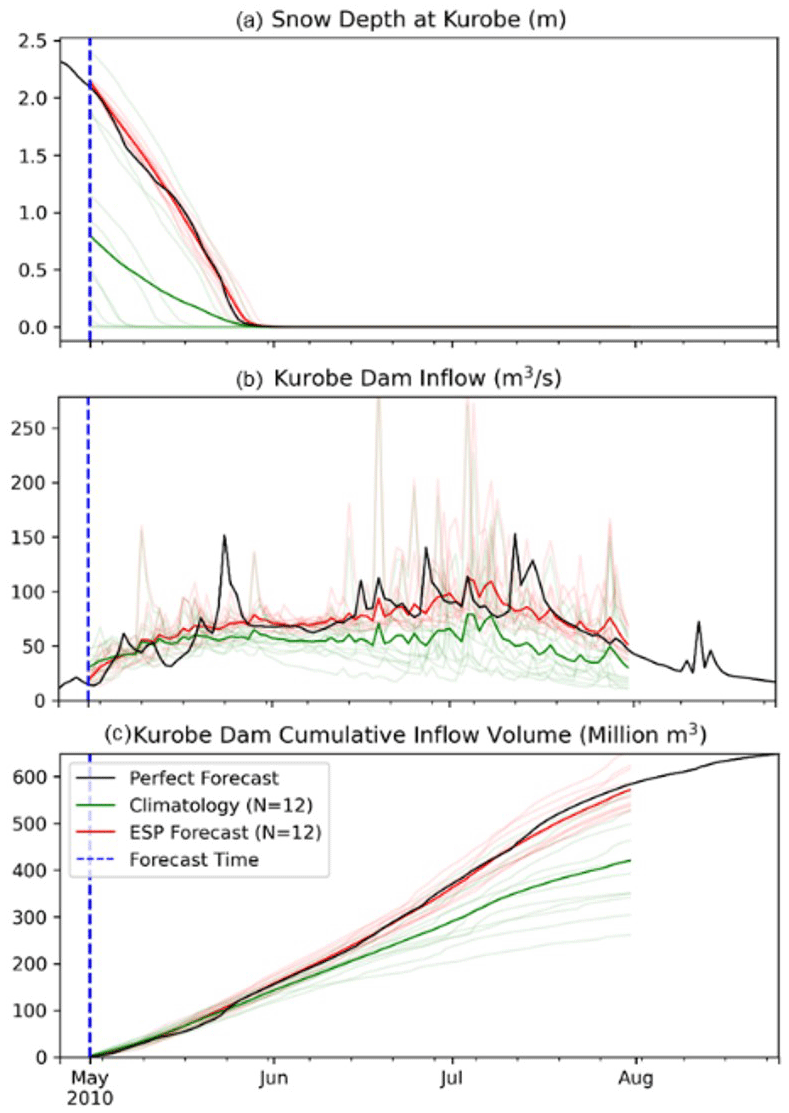
Figure 4Comparison of ESP forecast with climatology and perfect forecast for forecast issued on 1 May 2010.
From Fig. 4a it is quite evident that the use of initial condition leads to a much more reasonable forecast of point snow depth as compared with climatology. In Fig. 4b while the discharges at the beginning of the forecast are quite similar, they quickly become very different over time. Here it can be seen the ESP performs significantly better whose skill is mainly attributed to the initial condition. This difference can lead to very different forecasted cumulative reservoir inflow volumes at the end of the forecast horizon, which can have consequence for reservoir operations. The month of May is dominated by snowmelt runoff, so the initial condition of the snowpack can play a very important role in contributing to the skill of the forecast.
4.3 Comparison of ESP and climatology metrics
Figure 5 shows the CRPSS metric for the ESP forecasts average over 13 years and groups into four seasons (MAM = March–April–May; JJA = June–July–August; SON = September–October–November; DJF = December–January–February) depending upon the time the forecast was issued.
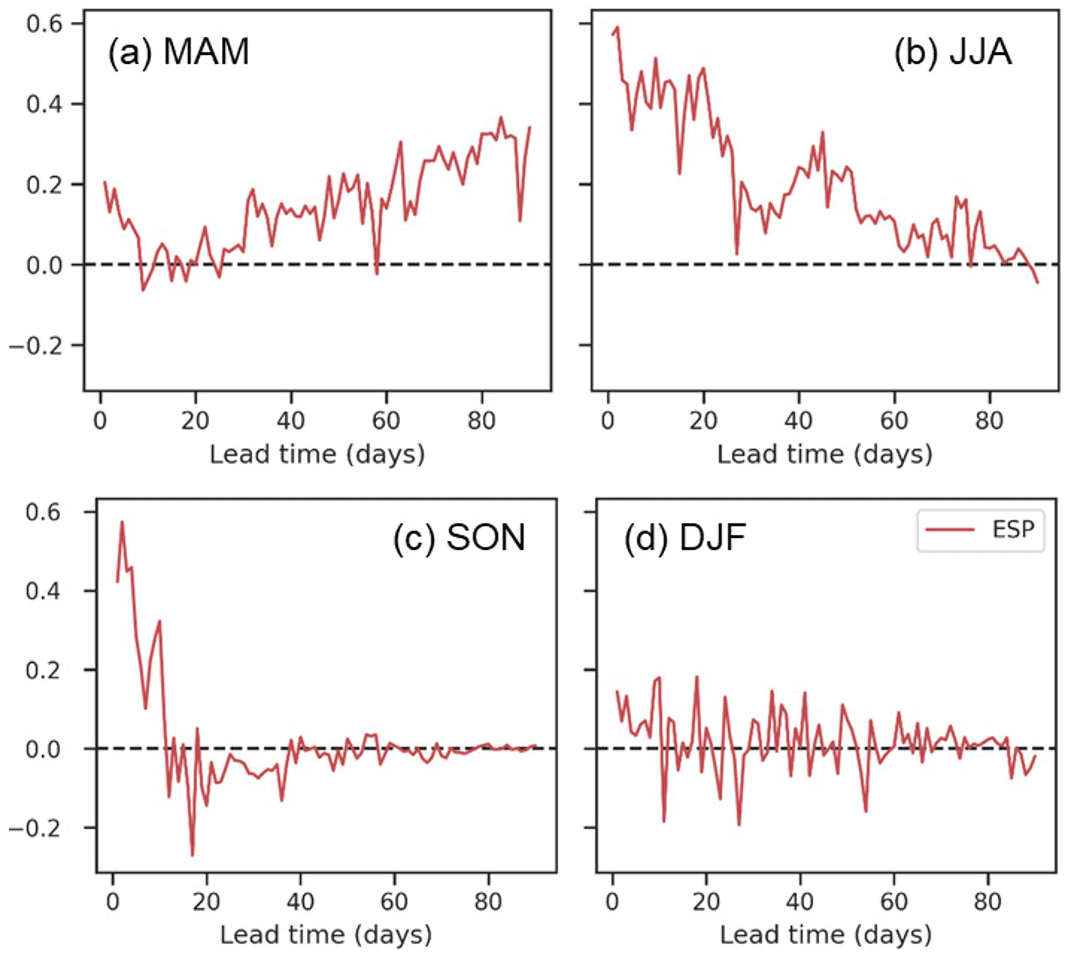
In general, the ESP is more skilful than the climatology for 8, 75, 11 and 10 d of lead time for MAM, JJA, SON and DJF respectively. In the case of MAM, the skill quickly drops after the first 8 d. In the case of JJA, the forecast remains more skilful for a very long lead time. We expect that this is largely due to the contribution of the forecast issued in May and June, where the initial condition of snow play an important role. Furthermore, here during the rainy season, the soil moisture initial condition must also play a very important role, to predict floods. The performance during SON and DJF is very poor and we think that this is likely due to the reason that the river discharge in this season is very low, since most of the precipitation received is in the form of snow.
4.4 Comparison of ESP and revESP
Figure 6 shows the comparison of the relative MSE for ESP and revESP. The climatology and perfect forecasts experiments are conducted as benchmarks. Climatology is used to calculate Ratio of MSE. Climatology has a Ratio of MSE equal to 1, whereas perfect forecast has a ratio of MSE equal to 0. ESP and revESP generally lie between these two benchmarks. The revESP has a lower relative MSE compared with ESP which is very close to 1.
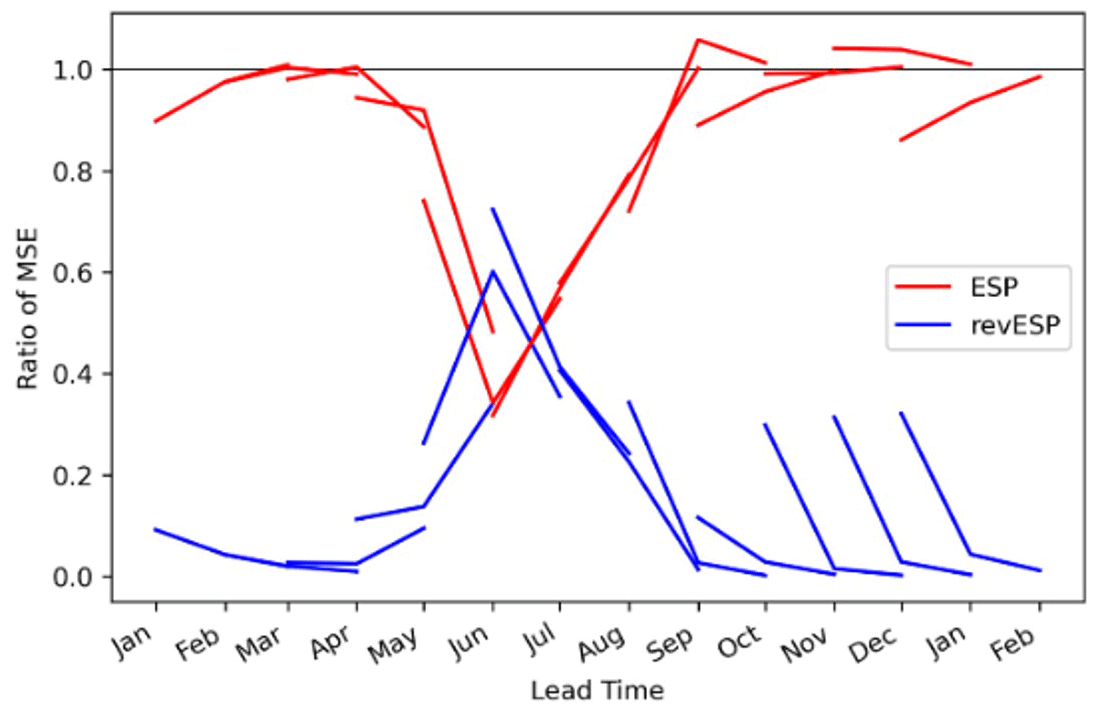
However, the situation is quite different for the forecasts issued in April, May, June, and July. Here, the relative MSE for ESP is sometimes higher and sometimes comparable to that of revESP. This means that for forecasts issued in these months, the model initial conditions play an important role. The decreasing (increasing) values of relative MSE for ESP (revESP) in April and May are due to the reason that most of the snow at Kurobe melts during these months, therefore the snow initial condition is important in these months. During JJA some snow exists at higher elevations. Furthermore, these months receive a lot of rainfall. Both of these factors contribute to soil moisture. Therefore, in JJA the initial condition of soil moisture in addition to snow is an important contributor to the skill of ESP forecast.
In this paper, we explained the development of a long-range (3-month) hydrometeorological prediction system for a snowfed watershed in Japan, using the latest iteration of WEB-DHM-S. We used 13-years of hindcast simulations to determine the accuracy of these forecast and more specifically answer, whether initial condition play an important role in contributing towards the skill of the forecasts. We found that the use of initial conditions can lead to the forecasts which are more skilful than climatology by 8–75 d of lead-time depending upon the season. Highest increase in skills was during the time when most of the snow melts. We believe that this research can lead to the development of long-range forecasting systems which can guide reservoir operators in snowfed watersheds for effective water resources management.
JRA55 dataset is from Kobayashi et al. (2015) and downloaded using the Data Integration and Analysis System (DIAS) (https://diasjp.net/en, last access: 10 June 2021). Radar-AMeDAS dataset was also downloaded from DIAS (https://diasjp.net/en, last access: 9 August 2021). Radar-AMeDAS can also be downloaded from a publicly open database (http://database.rish.kyoto-u.ac.jp/arch/jmadata/data/jma-radar/synthetic/original/, JMA, 2021). AMeDAS data can be downloaded from JMA's website (https://www.data.jma.go.jp/gmd/risk/obsdl/index.php, JMA, 2020).
AM contributed to conceptualization, methodology, formal analysis and writing. AK contributed to conceptualization, supervision, and funding acquisition.
The contact author has declared that neither of the authors has any competing interests.
Publisher's note: Copernicus Publications remains neutral with regard to jurisdictional claims made in the text, published maps, institutional affiliations, or any other geographical representation in this paper. While Copernicus Publications makes every effort to include appropriate place names, the final responsibility lies with the authors.
This article is part of the special issue “ICFM9 – River Basin Disaster Resilience and Sustainability by All”. It is a result of The 9th International Conference on Flood Management, Tsukuba, Japan, 18–22 February 2023.
This research was support by KEPCO, the DIAS project and the Ministry of Education, Culture, Sports, Science and Technology (MEXT).
This paper was edited by Mohamed Rasmy and reviewed by two anonymous referees.
JMA – Japan Meteorological Agency: AMeDAS station air temperature dataset, https://www.data.jma.go.jp/gmd/risk/obsdl/index.php, last access: 5 November 2020.
JMA – Japan Meteorological Agency: Radar-AMeDAS precipitation dataset, http://database.rish.kyoto-u.ac.jp/arch/jmadata/data/jma-radar/synthetic/original/, last access: 9 August 2021.
Kobayashi, S., Ota, Y., Harada, Y., Ebita, A., Moriya, M., Onoda, H., Onogi, K., Kamahori, H., Kobayashi, C., Endo, H., and Miyaoka, K.: The JRA-55 reanalysis: General specifications and basic characteristics, J. Meteorol. Soc. Jpn. Ser. II, 93, 5–48, https://doi.org/10.2151/jmsj.2015-001, 2015.
Koster, R. D., Mahanama, S. P. P., Livneh, B., Lettenmaier, D. P., and Reichle, R. H.: Skill in streamflow forecasts derived from large-scale estimates of soil moisture and snow, Nat. Geosci., 3, 613–616, https://doi.org/10.1038/ngeo944, 2010.
Moiz, A., Zhongwang, W., Naseer, A., Kawasaki, A., Acierto, R. A., and Koike, T.: Improving snow-process modeling by evaluating reanalysis vertical temperature profiles using a distributed hydrological model, J. Geophys. Res.-Atmos., 127, e2021JD036174, https://doi.org/10.1029/2021JD036174, 2022.
Shrestha, M., Wang, L., Koike, T., Xue, Y., and Hirabayashi, Y.: Improving the snow physics of WEB-DHM and its point evaluation at the SnowMIP sites, Hydrol. Earth Syst. Sci., 14, 2577–2594, https://doi.org/10.5194/hess-14-2577-2010, 2010.
Wood, A. W. and Lettenmaier, D. P.: An ensemble approach for attribution of hydrologic prediction uncertainty, Geophys. Res. Lett., 35, 1–5, https://doi.org/10.1029/2008GL034648, 2008.