the Creative Commons Attribution 4.0 License.
the Creative Commons Attribution 4.0 License.
 | 19 Apr 2024
Dual-Stage Attention-Based LSTM Network for Multiple Time Steps Flood Forecasting
Weiqi Wang
Wenqing Lin
Dawei Zhang
Flood forecasting plays a crucial role in supporting decision-making for flood management. In addition to conceptual and physical-based models, the data-driven models have garnered increasing attention in recent years. The proposed model in this study employs LSTM networks, Encoder-Decoder framework, as well as feedback and attention mechanism to effectively utilize diverse observed data and future rainfall as inputs for multiple time steps flood forecasting. The accuracy and reliability of the model have been validated across case studies in multiple watersheds in China. The results demonstrate the high performance of the LSTM-based flood forecasting model. Meanwhile, the efficacy of both the feedback mechanism and attention mechanism has been validated in the domain of flood prediction.
- Article
(3232 KB) - Full-text XML
- BibTeX
- EndNote


The artificial neural network (ANN) stands out as the most widely adopted algorithm among data-driven flood forecasting models, showcasing exceptional performance and remarkable stability. After years of development, the simple feedforward network has evolved into sophisticated architectures such as radial basis function (RBF) network and recurrent neural network (RNN) (Xiang et al., 2020; Kao et al., 2020), among which, the RNN with gating mechanism, such as the LSTM network (Hochreiter and Schmidhuber, 1997), has shown great performance in the field of series prediction. The structure of RNN can effectively utilize the information inherent in time series data, making it highly suitable for predicting rainfall and runoff series characterized by significant autocorrelation and cross-correlation.
Based on the CAMELS dataset (Addor et al., 2017; Newman et al., 2015), the LSTM network has been employed to construct runoff prediction models for multiple watersheds in the United States (Kratzert et al., 2018). Thapa et al. (2020) developed an LSTM-based discharge model driven by snowmelt in a Himalayan basin, which utilized MODIS snow images and remotely sensed meteorological data as input variables. The LSTM network and seq2seq architecture have been utilized to construct flood forecasting models for Clear Creek and Upper Wapsipinicon River in the United States, demonstrating the effective application of the LSTM-seq2seq model in short-term flood forecasting (Xiang et al., 2020). The LSTM network and Encoder-Decoder framework have been adopted to achieve multi-step prediction, providing a maximum lead time of 6 h for reservoir inflow prediction (Kao et al., 2020). The LSTM-based flood forecasting model developed by Dazzi et al. (2021) utilized the observed upstream and downstream water levels as inputs to accurately predict the flood stages of critical gauge stations.
In this paper, a flood forecasting model based on the LSTM network, Encoder-Decoder framework, as well as the feedback and attention mechanism are proposed to achieve multiple time steps flood forecasting. Three representative watersheds with distinct climate and underlying surface characteristics are selected to conduct case studies to validate the performance of the proposed model.
2.1 LSTM-based flood forecasting model
The internal structure of the LSTM cell is illustrated in Fig. 1, encompassing three gates for regulating information: the “forget gate”, “input gate”, and “output gate”.
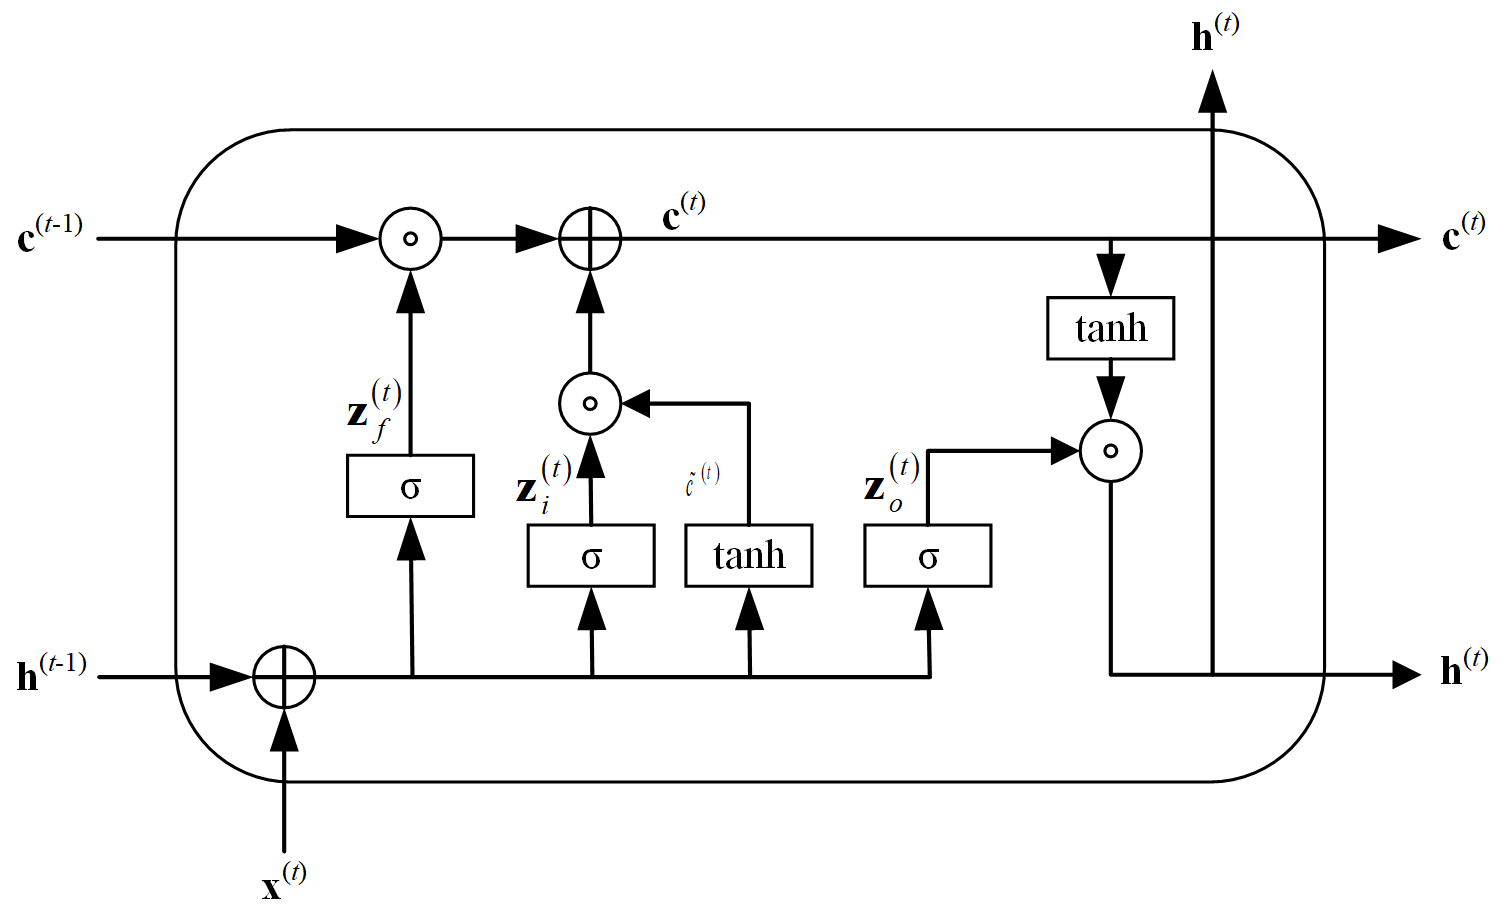
The information processing in “forgetting gate” is shown in Eq. (1), which mainly controls the information to be discarded in the internal state.
In which, σ is sigmoid function, W∗ is weight matrix, b∗ is bias weight, h(t−1) is the hidden state of previous time step, x(t) is the input at time t.
The computation of vectors in the “input gate” is illustrated in Eq. (2), which determines the novel information incorporated into the internal state at each time step. The candidate states are obtained through a feedforward network layer using the “tanh” function as the activation function, as depicted in Eq. (3).
The “output gate” process, depicted in Eq. (4), governs the transmission of information from the internal state to the hidden state at each time step. Nonlinear transformation is also essential in the output process and can be achieved through activation functions, as illustrated in Eq. (5).
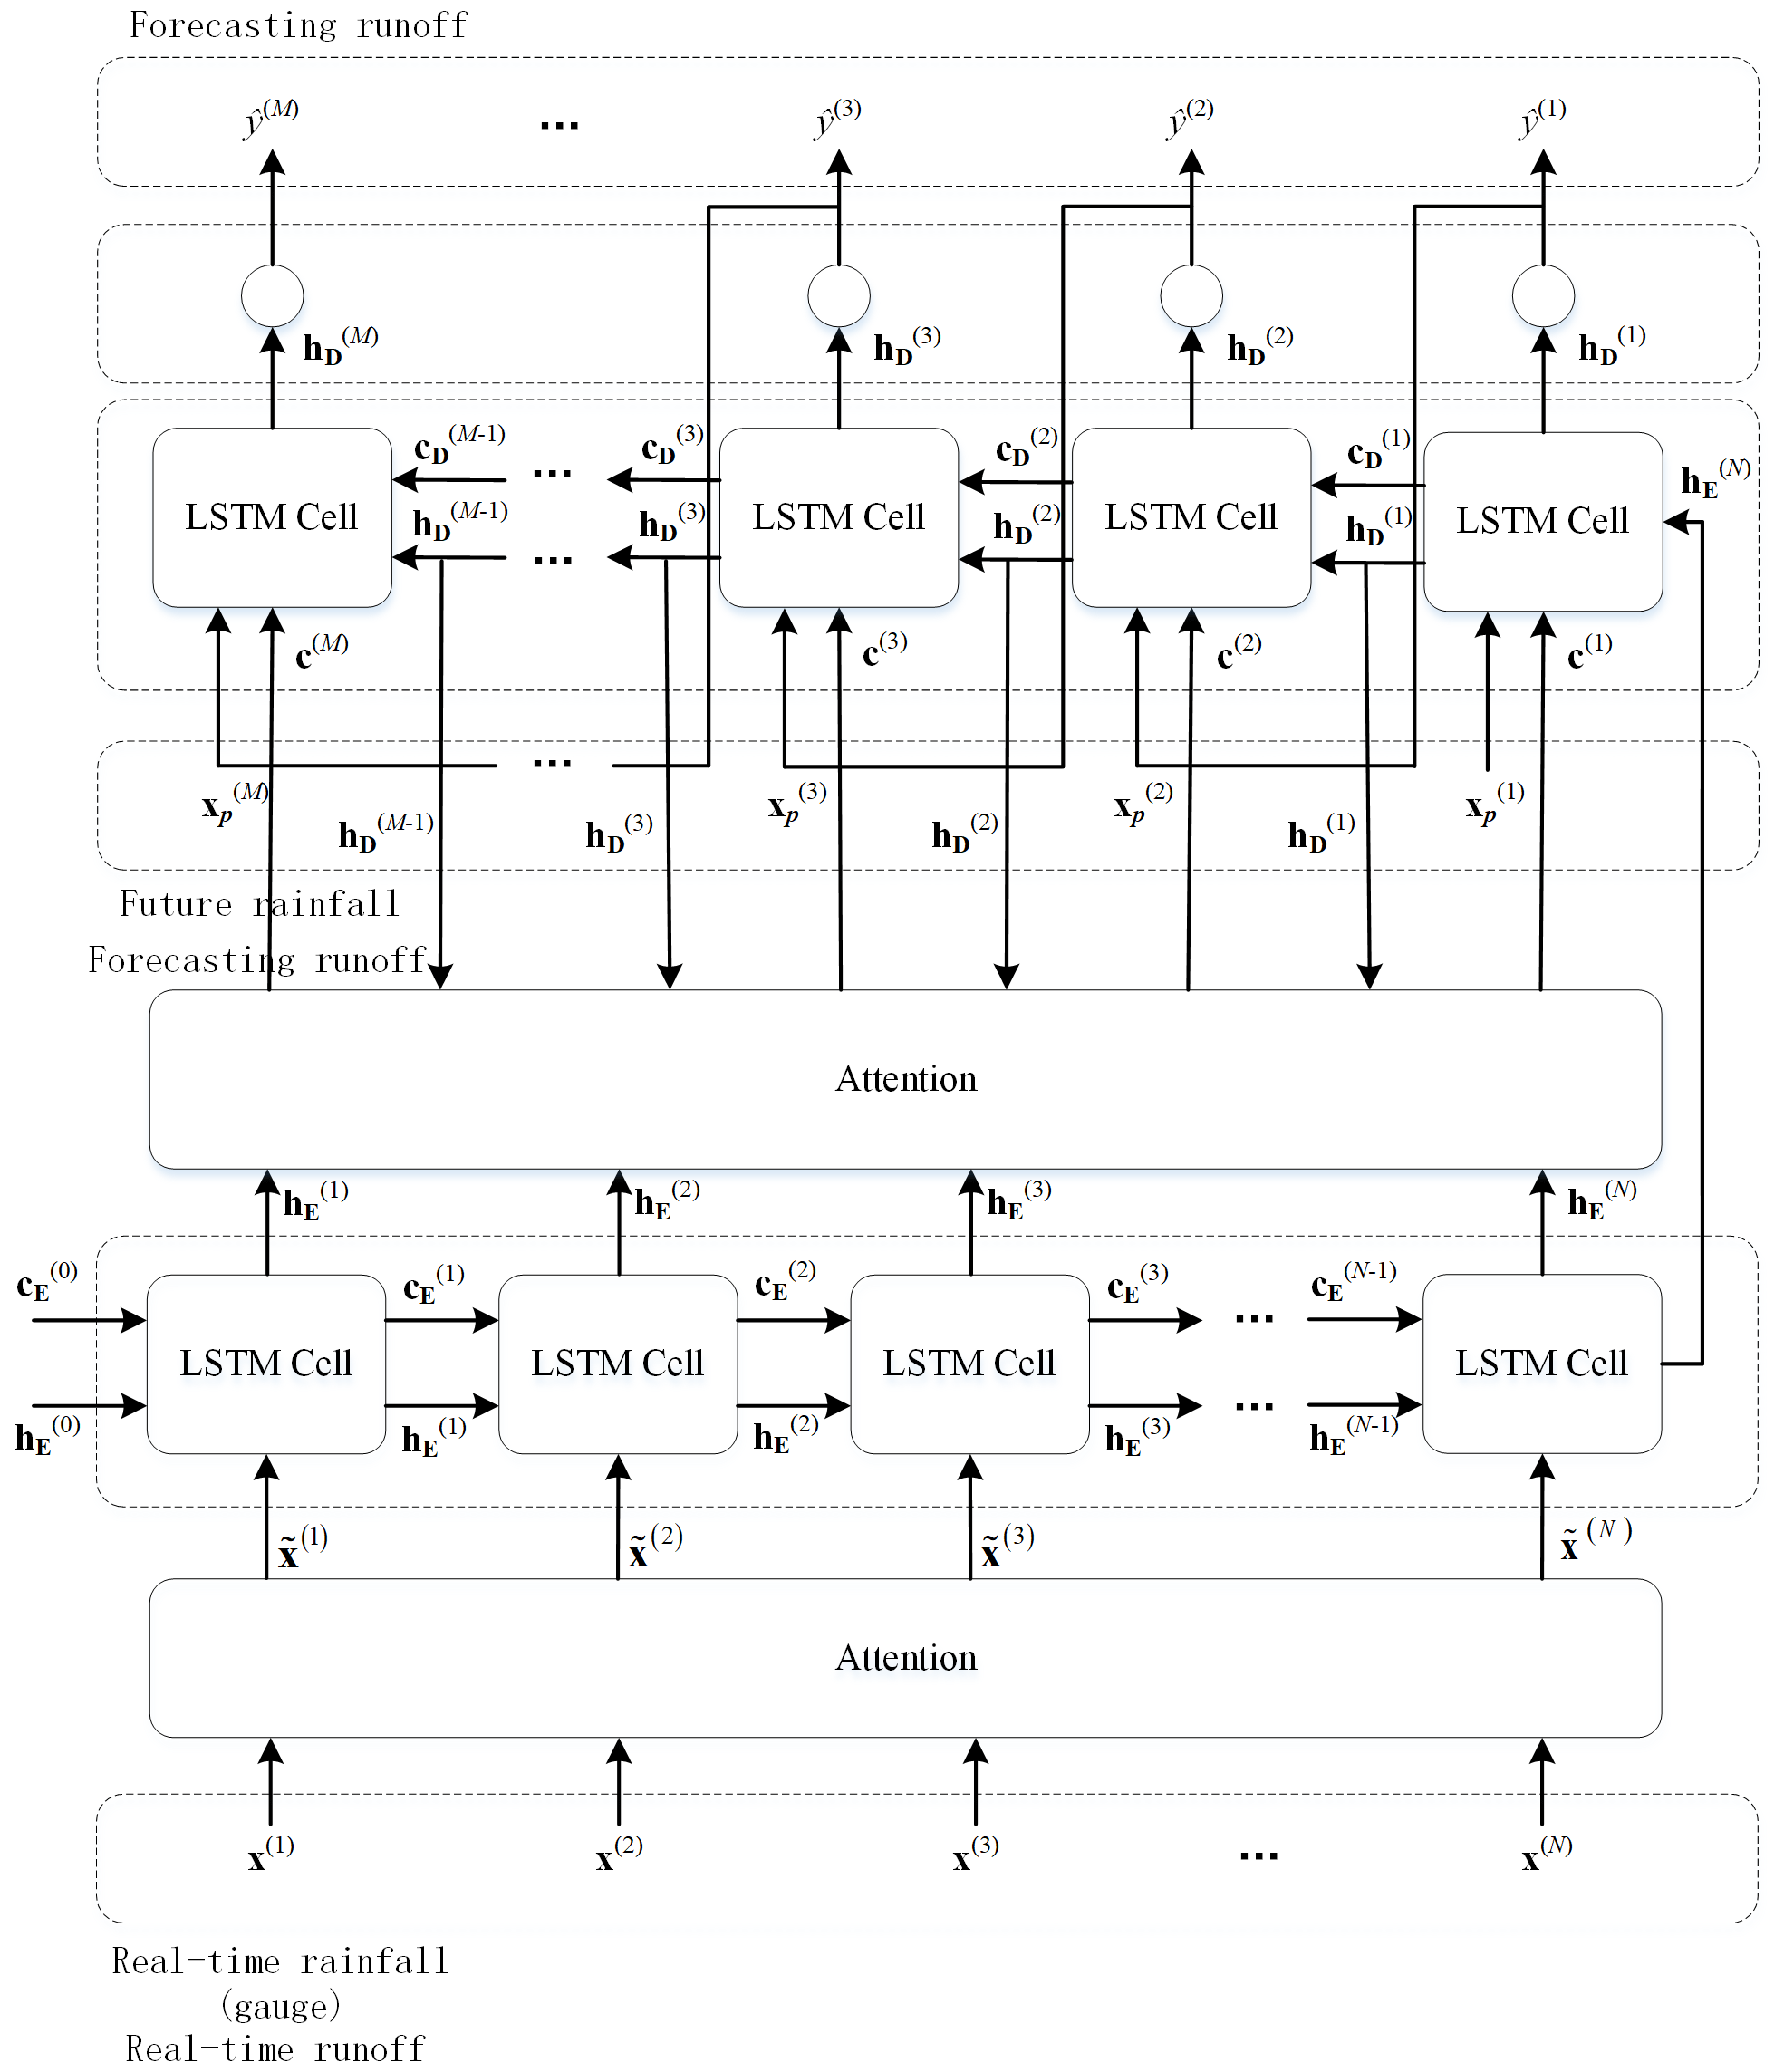
The proposed forecasting model is referred to as LSTM-DSA, with DSA representing the dual stage attention mechanism. The architectural depiction of LSTM-DSA can be observed in Fig. 2. The dual stage attention operates on both the Encoder and Decoder components individually. The Encoder part utilizes the attention mechanism to enable adaptive selection among multiple driving factors, thereby facilitating the utilization of point rainfall data as input instead of area rainfall data. In the Decoder part, the attention mechanism assigns weight coefficients to the hidden state of the encoder at each time step. Additionally, the model encompasses a feedback mechanism within the Decoder part to utilize future rainfall data as additional input.
2.2 Benchmark model
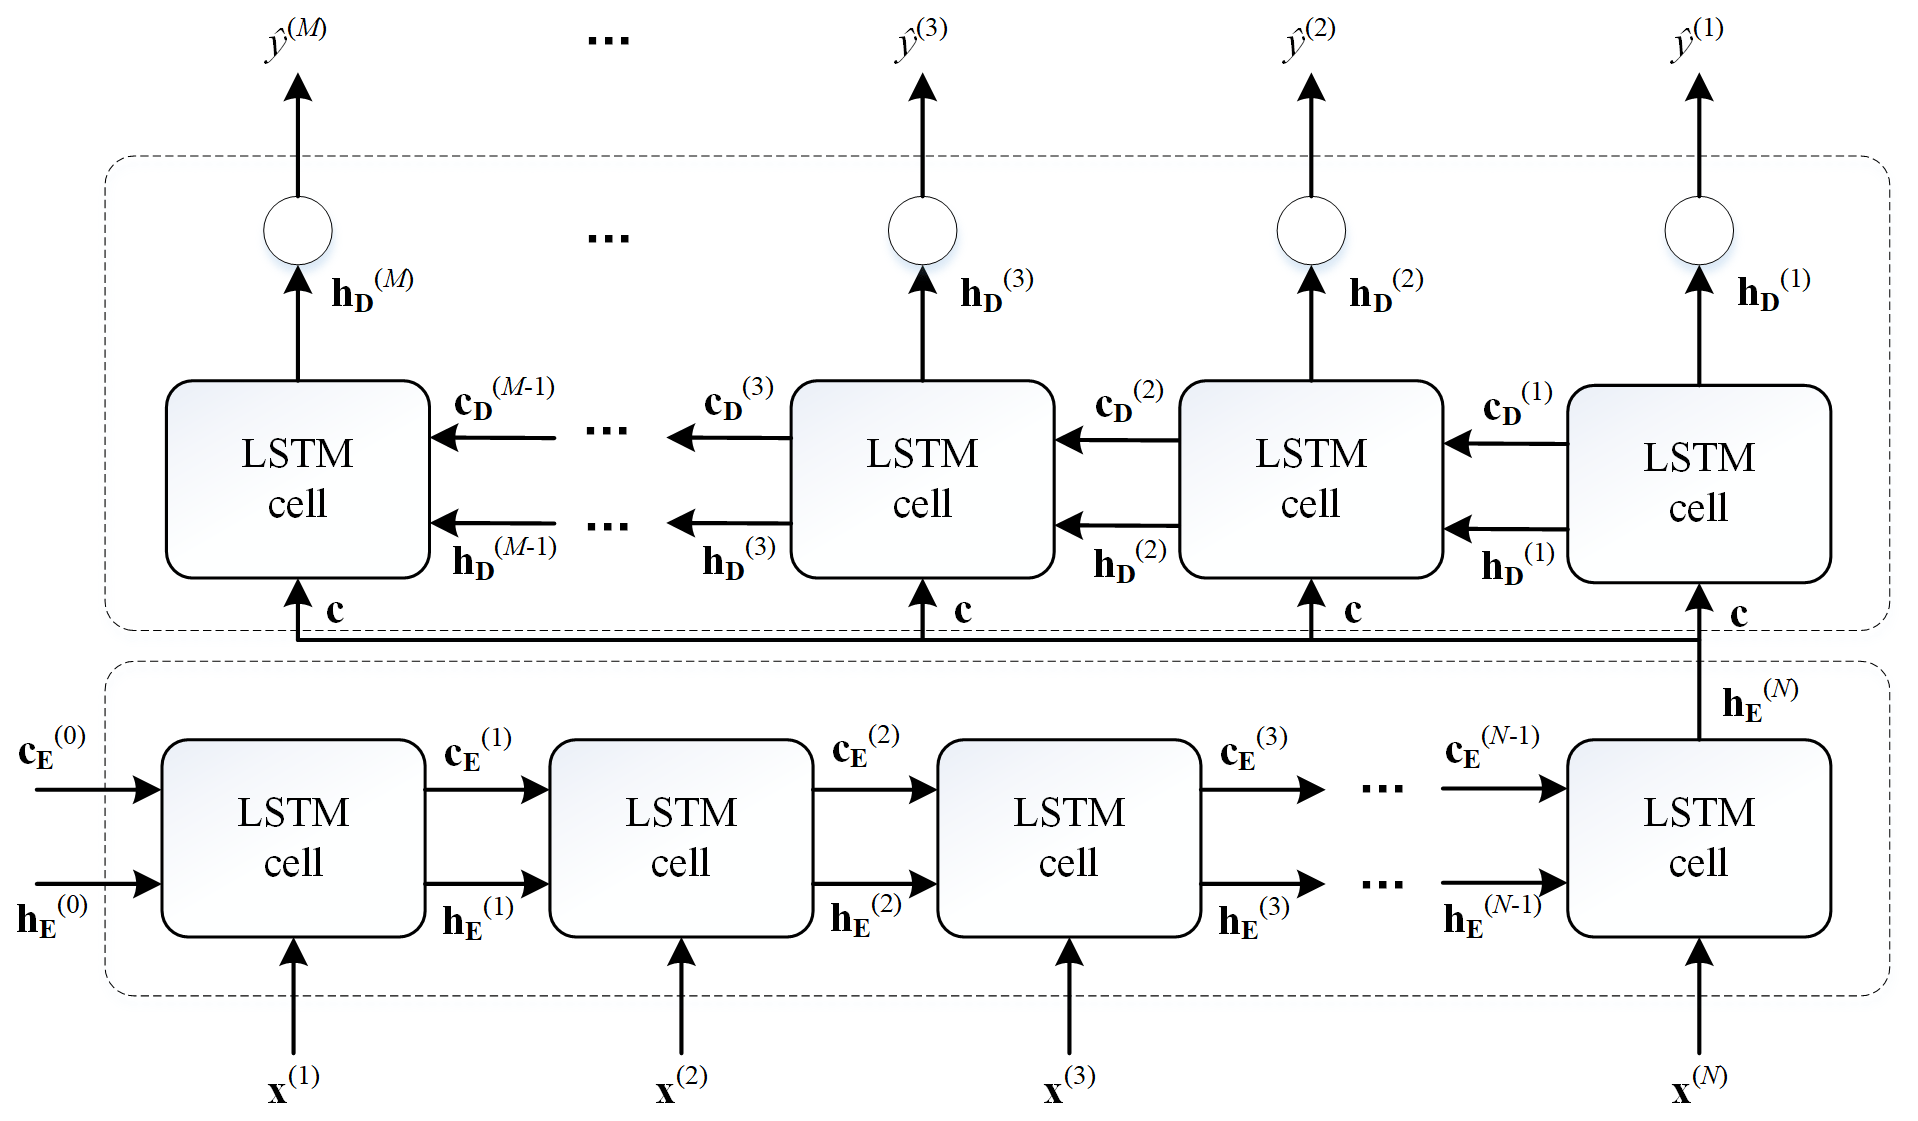
The forecasting model based on Encoder-Decoder framework proposed by Kao et al. (2020) is utilized as the benchmark model, named as LSTM-ED, whose architecture is illustrated in Fig. 3.
2.3 Evaluation metrics
The model performance is assessed based on the simulated peak value, peak occurrence time, and flood process. The evaluation metrics include the relative error of the peak, error in peak occurrence time, and Nash efficiency coefficient.
The relative error of the peak is calculated as follows:
In which, (m3 s−1) and (m3 s−1) are the peak value of the simulated and the observed sequence, respectively.
The computation of the peak time error is as follows:
Where, (h) is the peak occurrence time of the simulated sequence and (h) is the peak occurrence time of the observed sequence.
Equation (8) shows the computation of the Nash efficiency coefficient, which quantifies the overall discrepancy between the simulated and observed sequence.
In which, and represent the value of the observed and simulated sequence, respectively. is the mean value of the observed sequence.
In order to comprehensively assess the performance of the proposed model, we carefully select three watersheds as study areas, each characterized by distinct climatic and geomorphic features. The three watersheds are situated within Shaanxi Province, China, and boast well-maintained rain gauges and hydrological stations, along with an extensive collection of observational data. The basic information the study watersheds is shown in Table 1, and the locations are shown in Fig. 4.
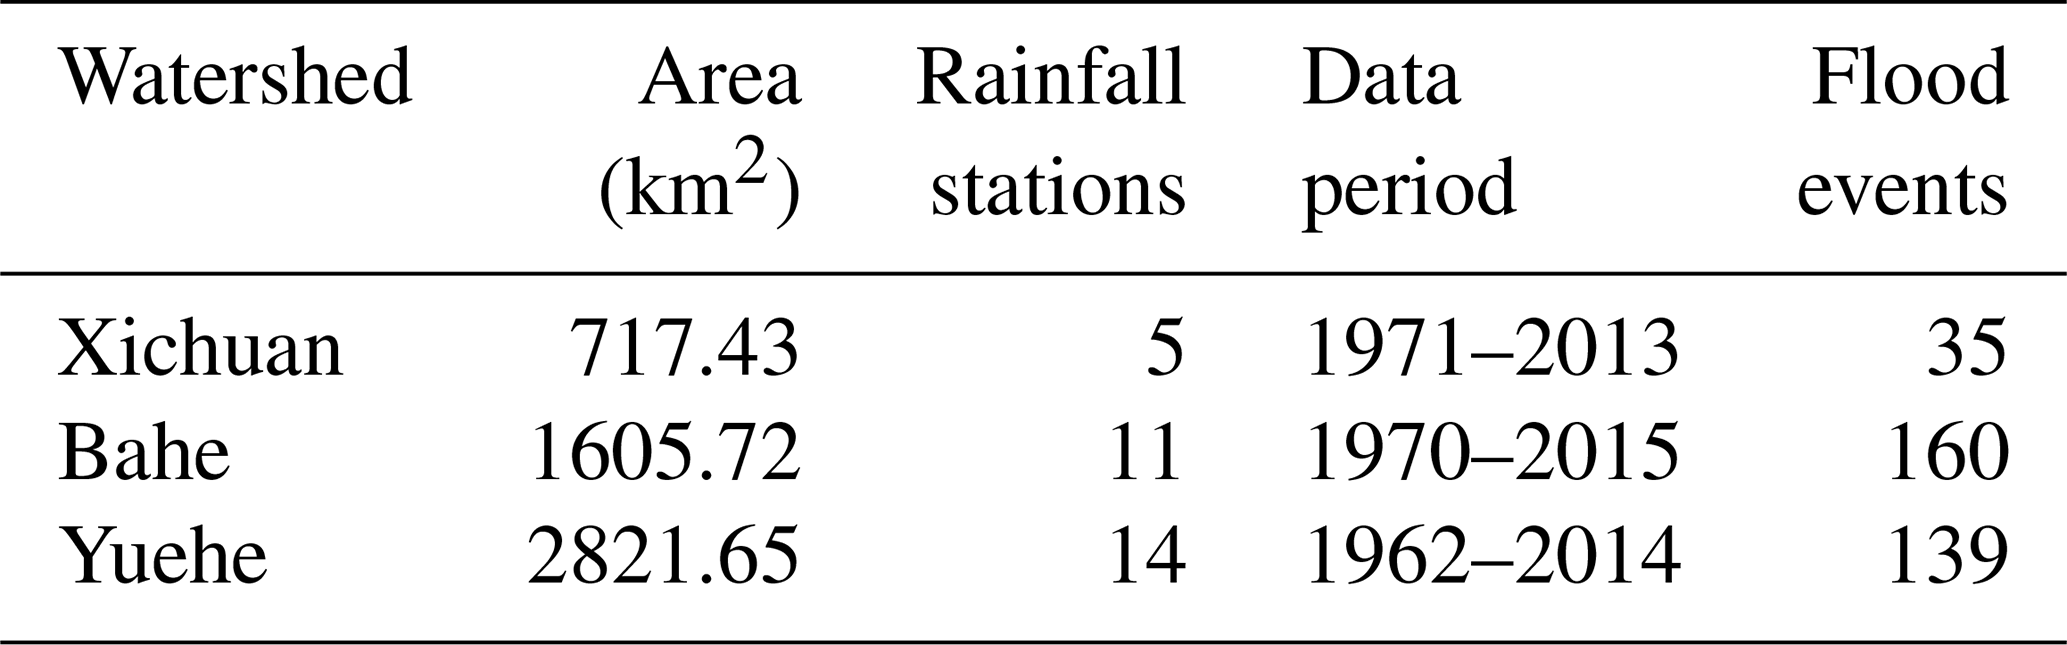
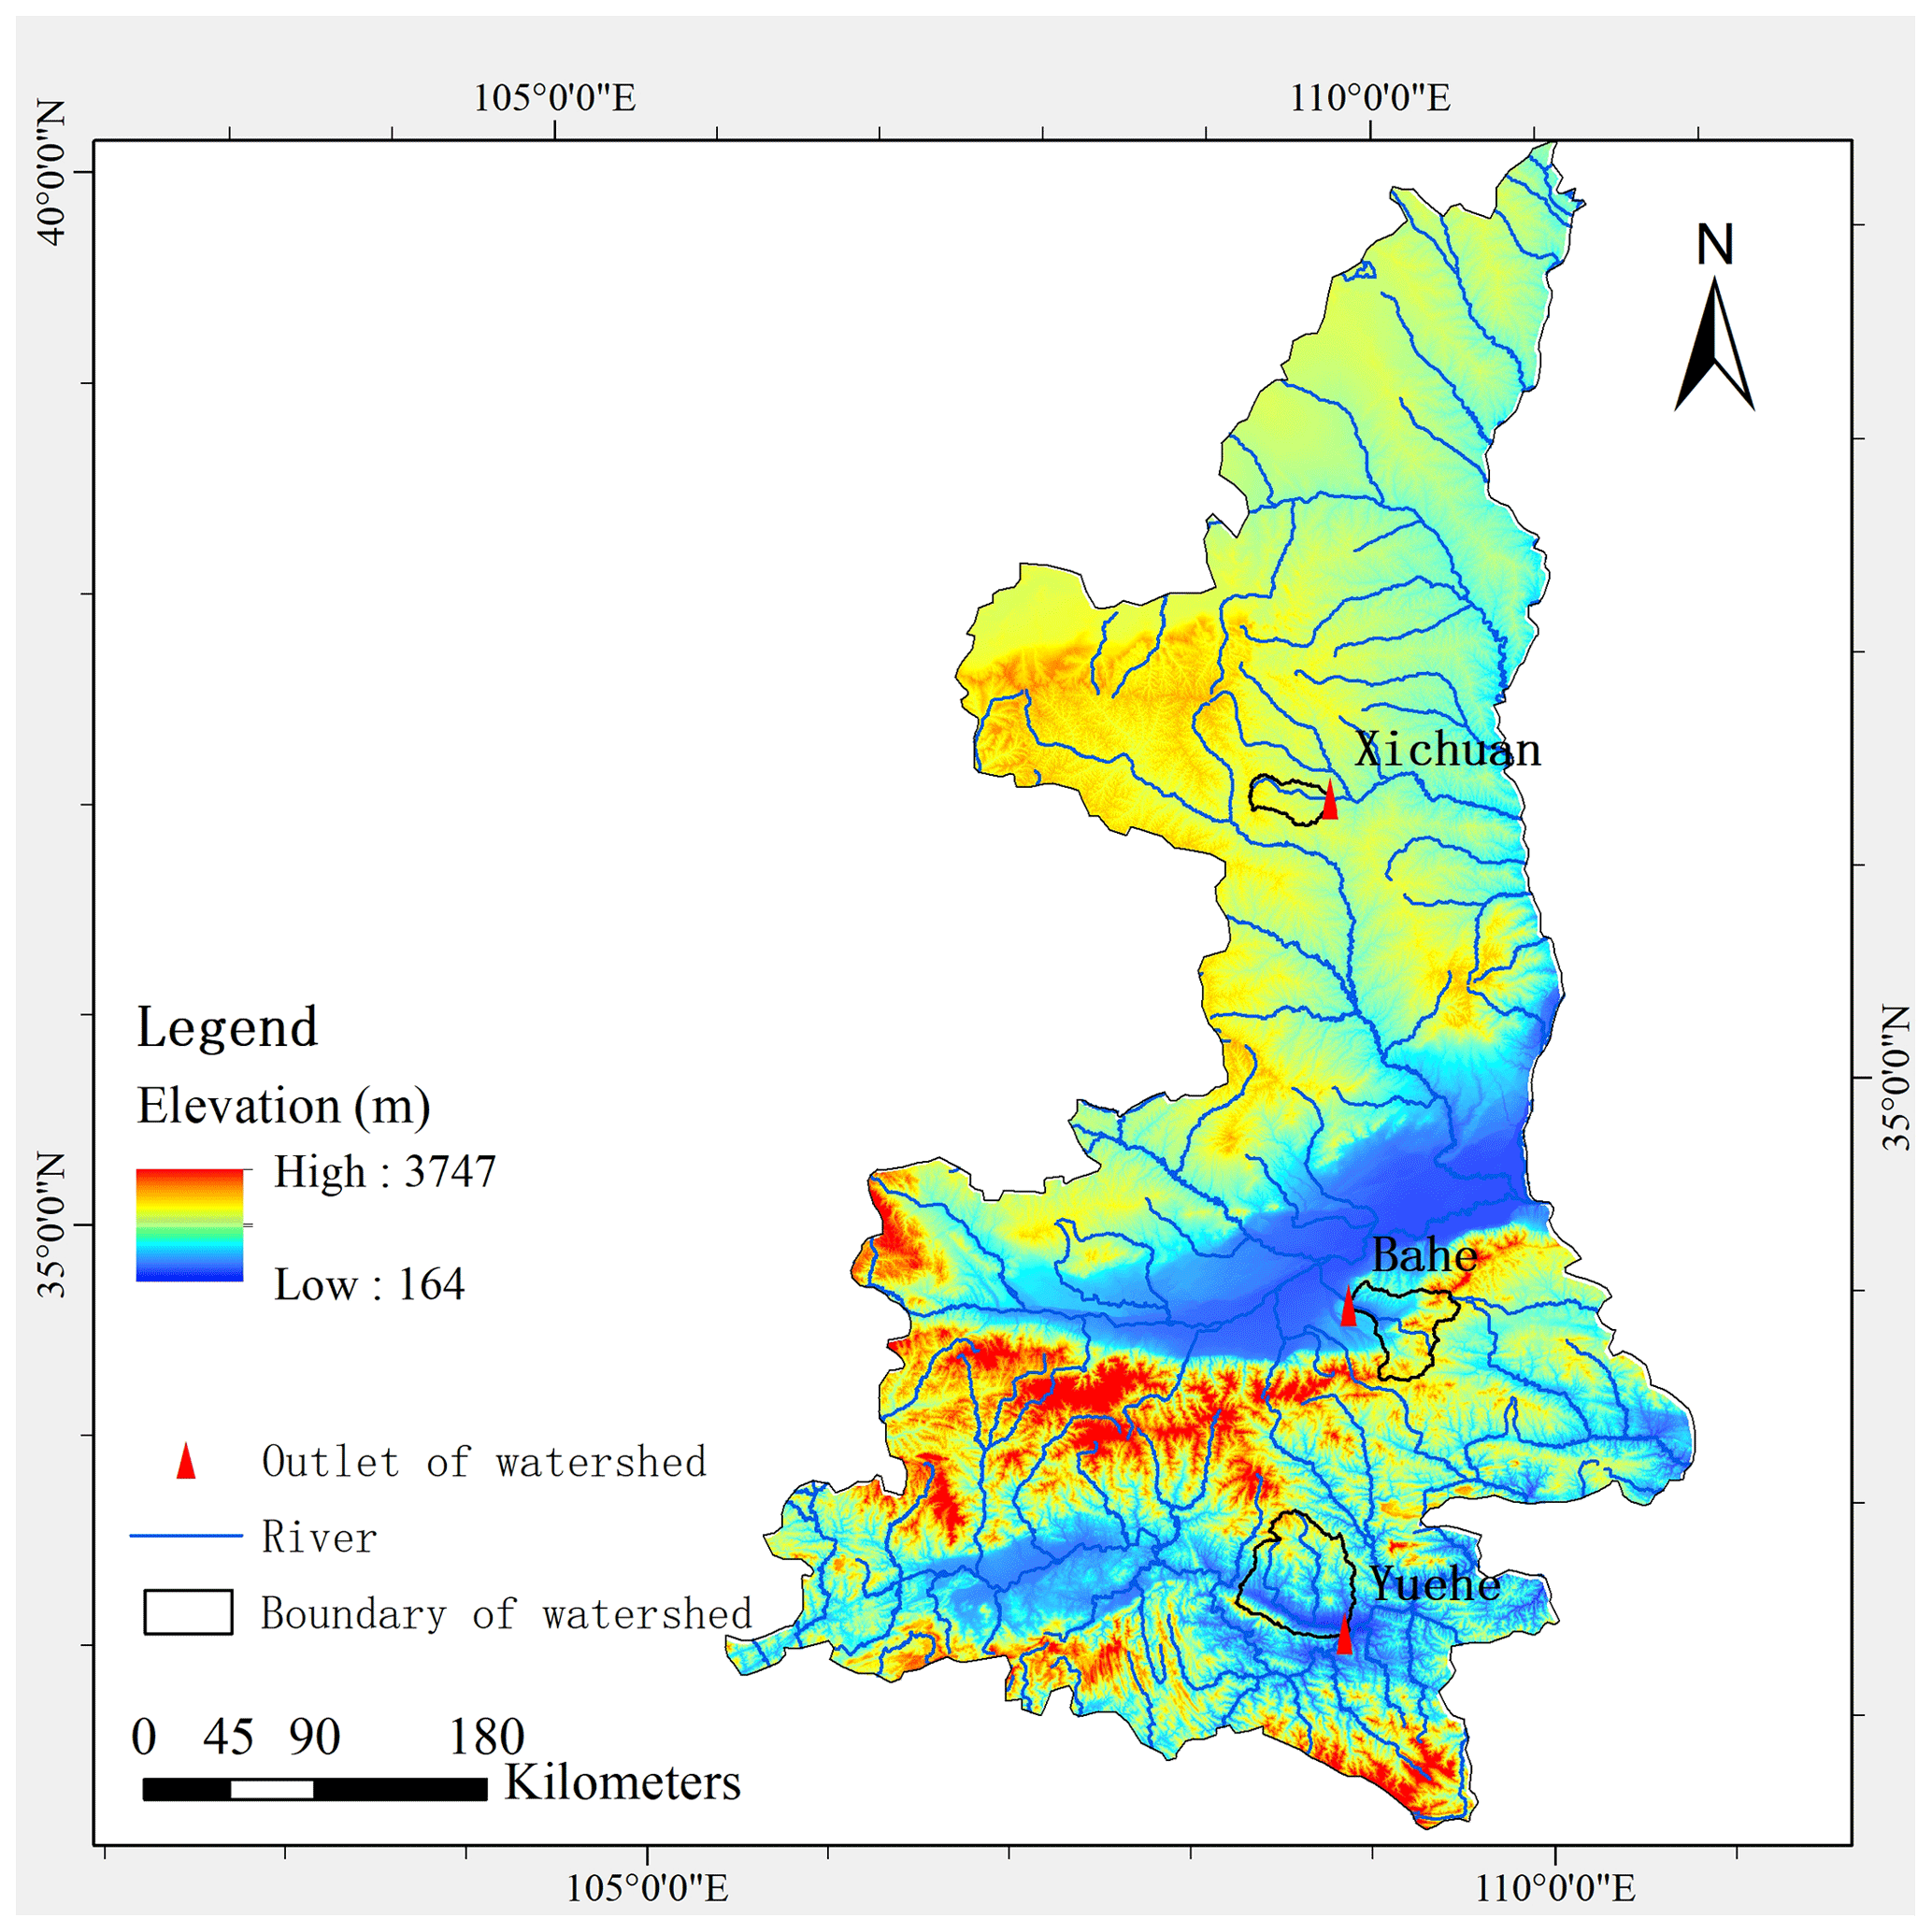
Figure 4Locations of the study watersheds.
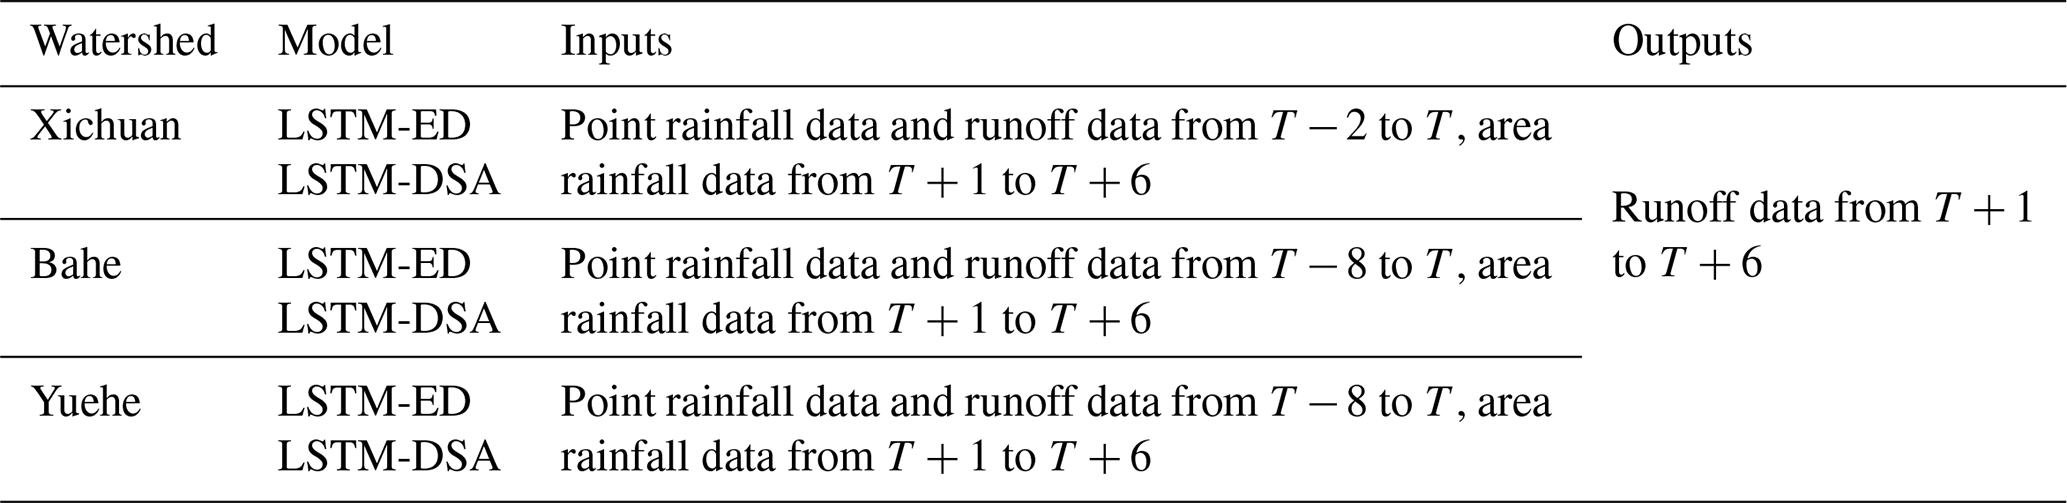
4.1 Model inputs and outputs
The input steps of the LSTM-based models for the three watersheds are determined as 3, 9 and 9 h by analysing the ACF and PACF of the rainfall and runoff data comprehensively as well as conducting preliminary modelling analysis. The inputs and outputs of each flood forecasting model are illustrated in Table 2.
4.2 Data pre-processing and sample division
The linear normalization method is employed for pre-processing, as indicated in Eq. (9), to account for the disparities in dimensions and scales between rainfall and runoff data. This approach ensures improved accuracy and convergence speed of the model.
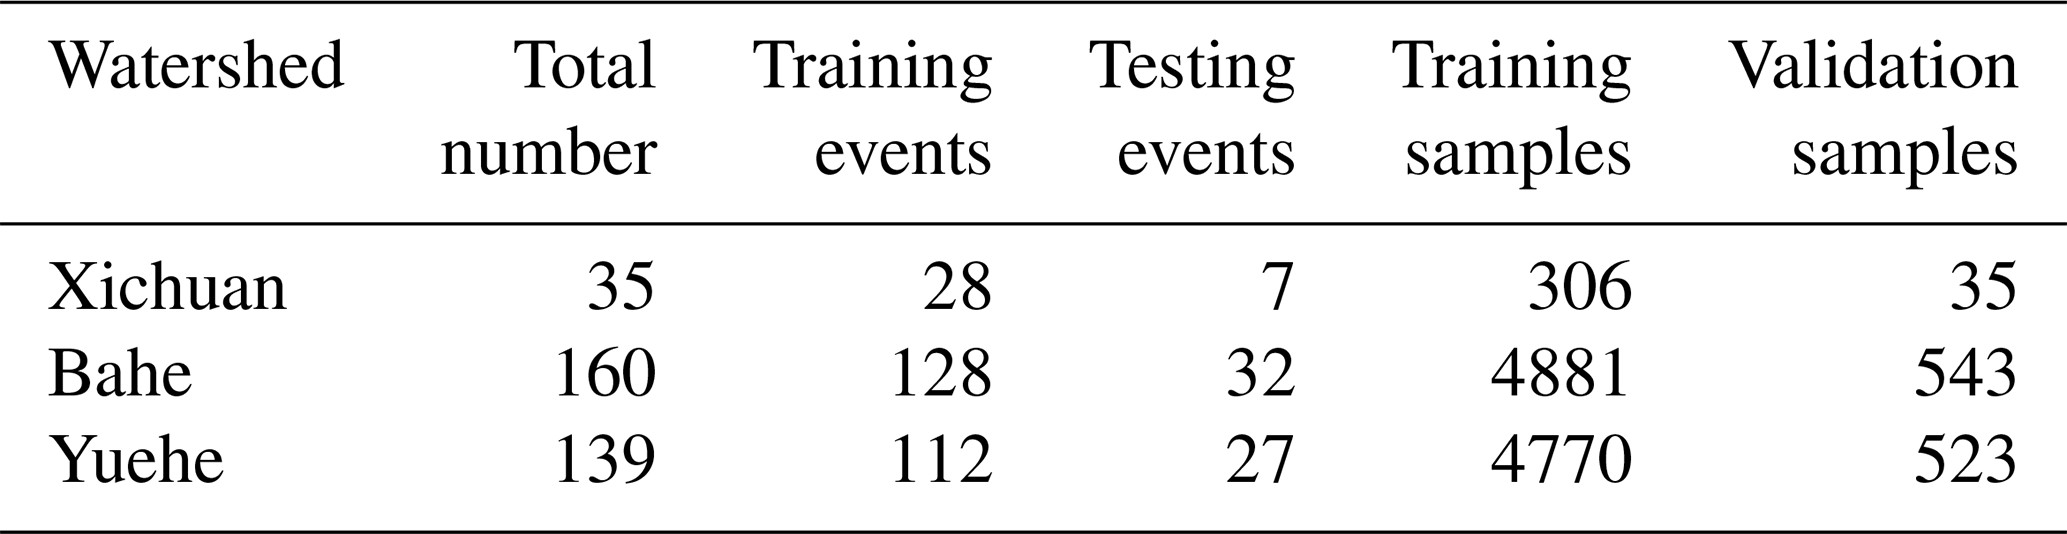
The sample set is constructed using normalized rainfall and runoff data. Firstly, 20 % of all flood events are randomly selected as testing events. Secondly, the remaining 80 % of the events are sliced according to input and output steps to generate samples, from which 10 % are randomly chosen as validation set. Finally, the remaining samples constitute the training set. Table 3 shows the number of samples in each set.
4.3 Settings and training
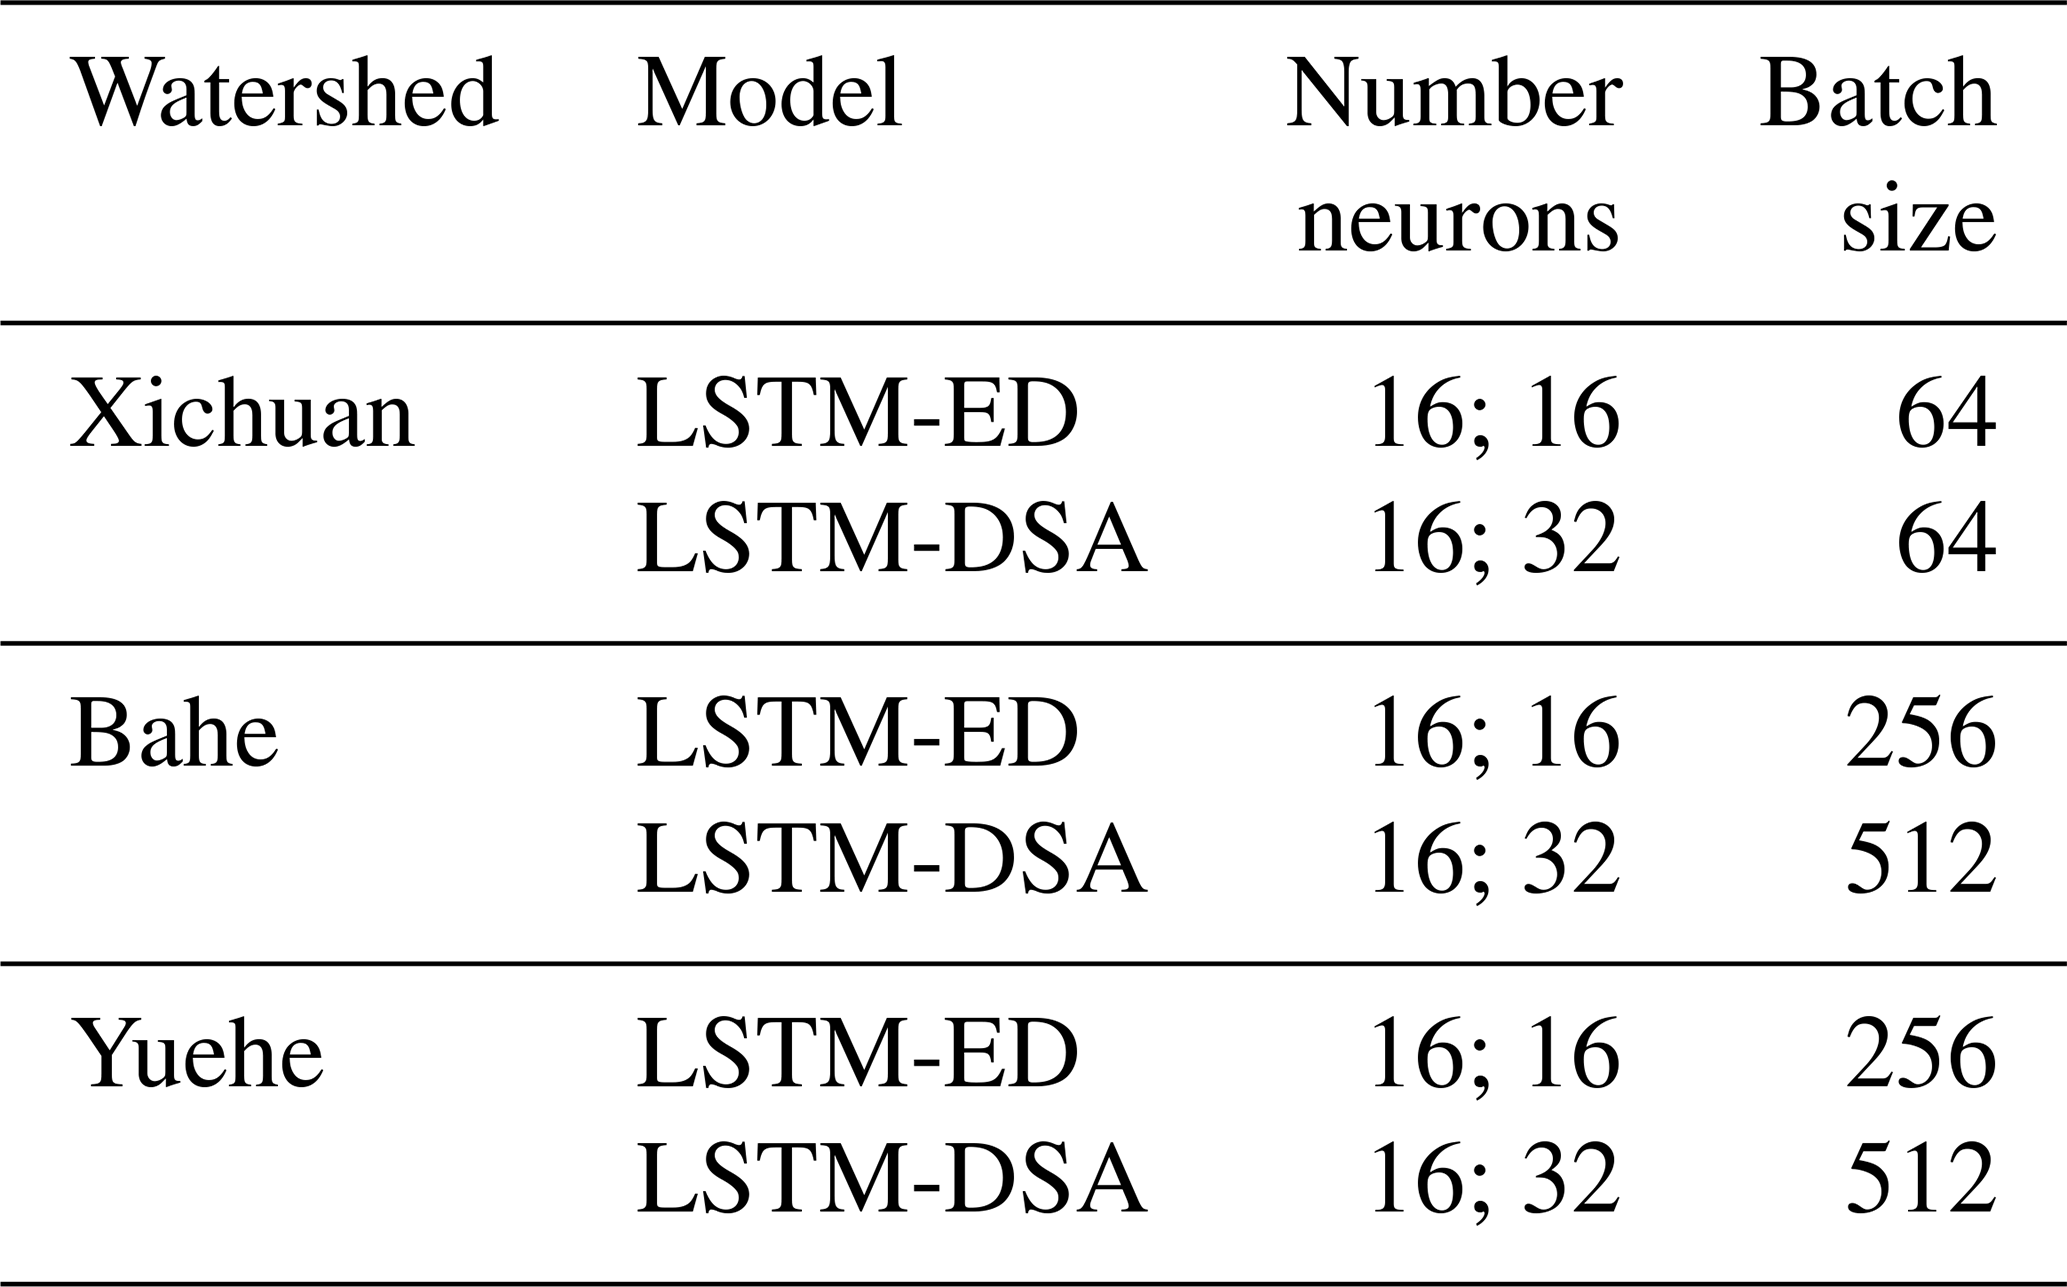
The forecasting model is constructed based on the Keras in Python, with a single-layer LSTM utilized for both the Encoder and Decoder layer, while a full connection layer serves as output layer. The “MSE”, “Adam” and “ReLU” are selected as loss function, optimizer and activation function, respectively. The other hyperparameters of the model are determined through trial calculations with the loss function as indicators, wherein the number of neurons and batch size are optimized using powers of 2, which are presented in Table 4.
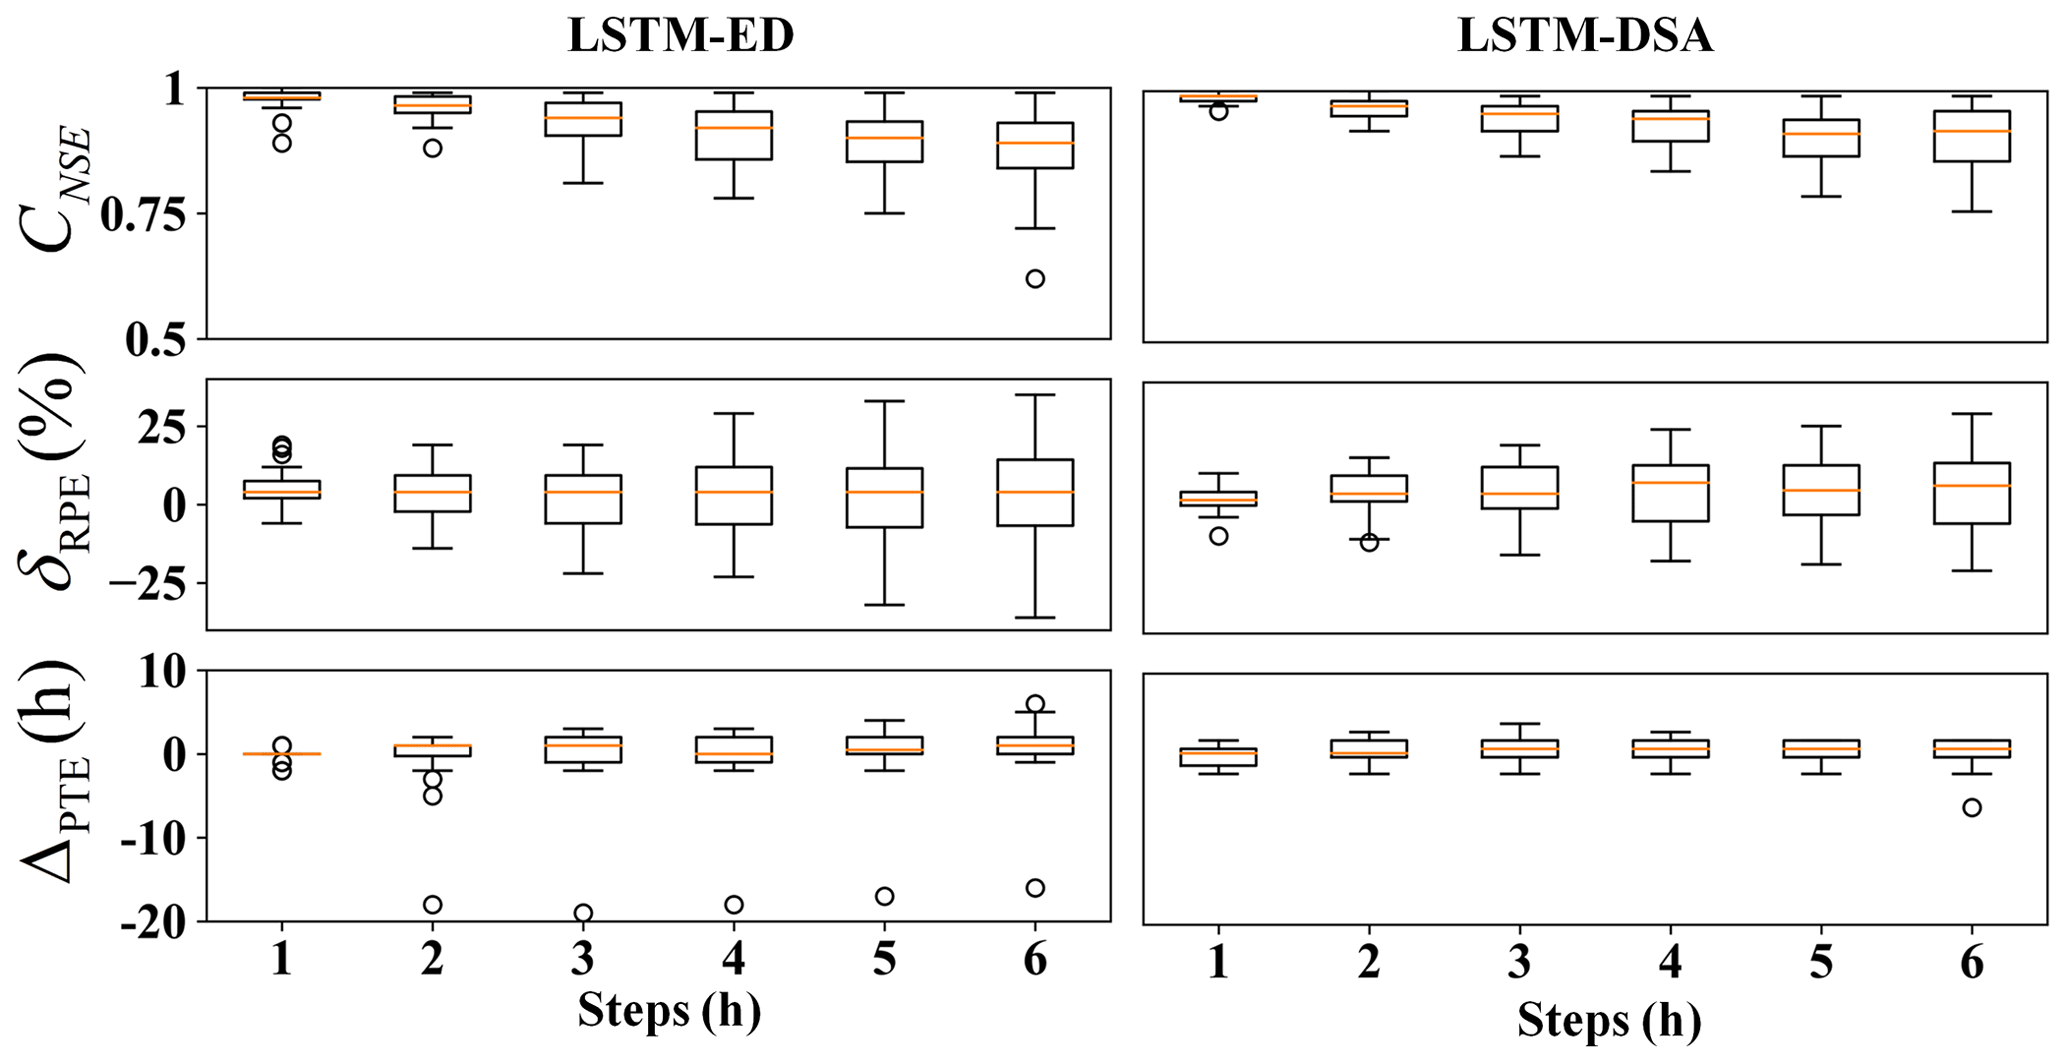
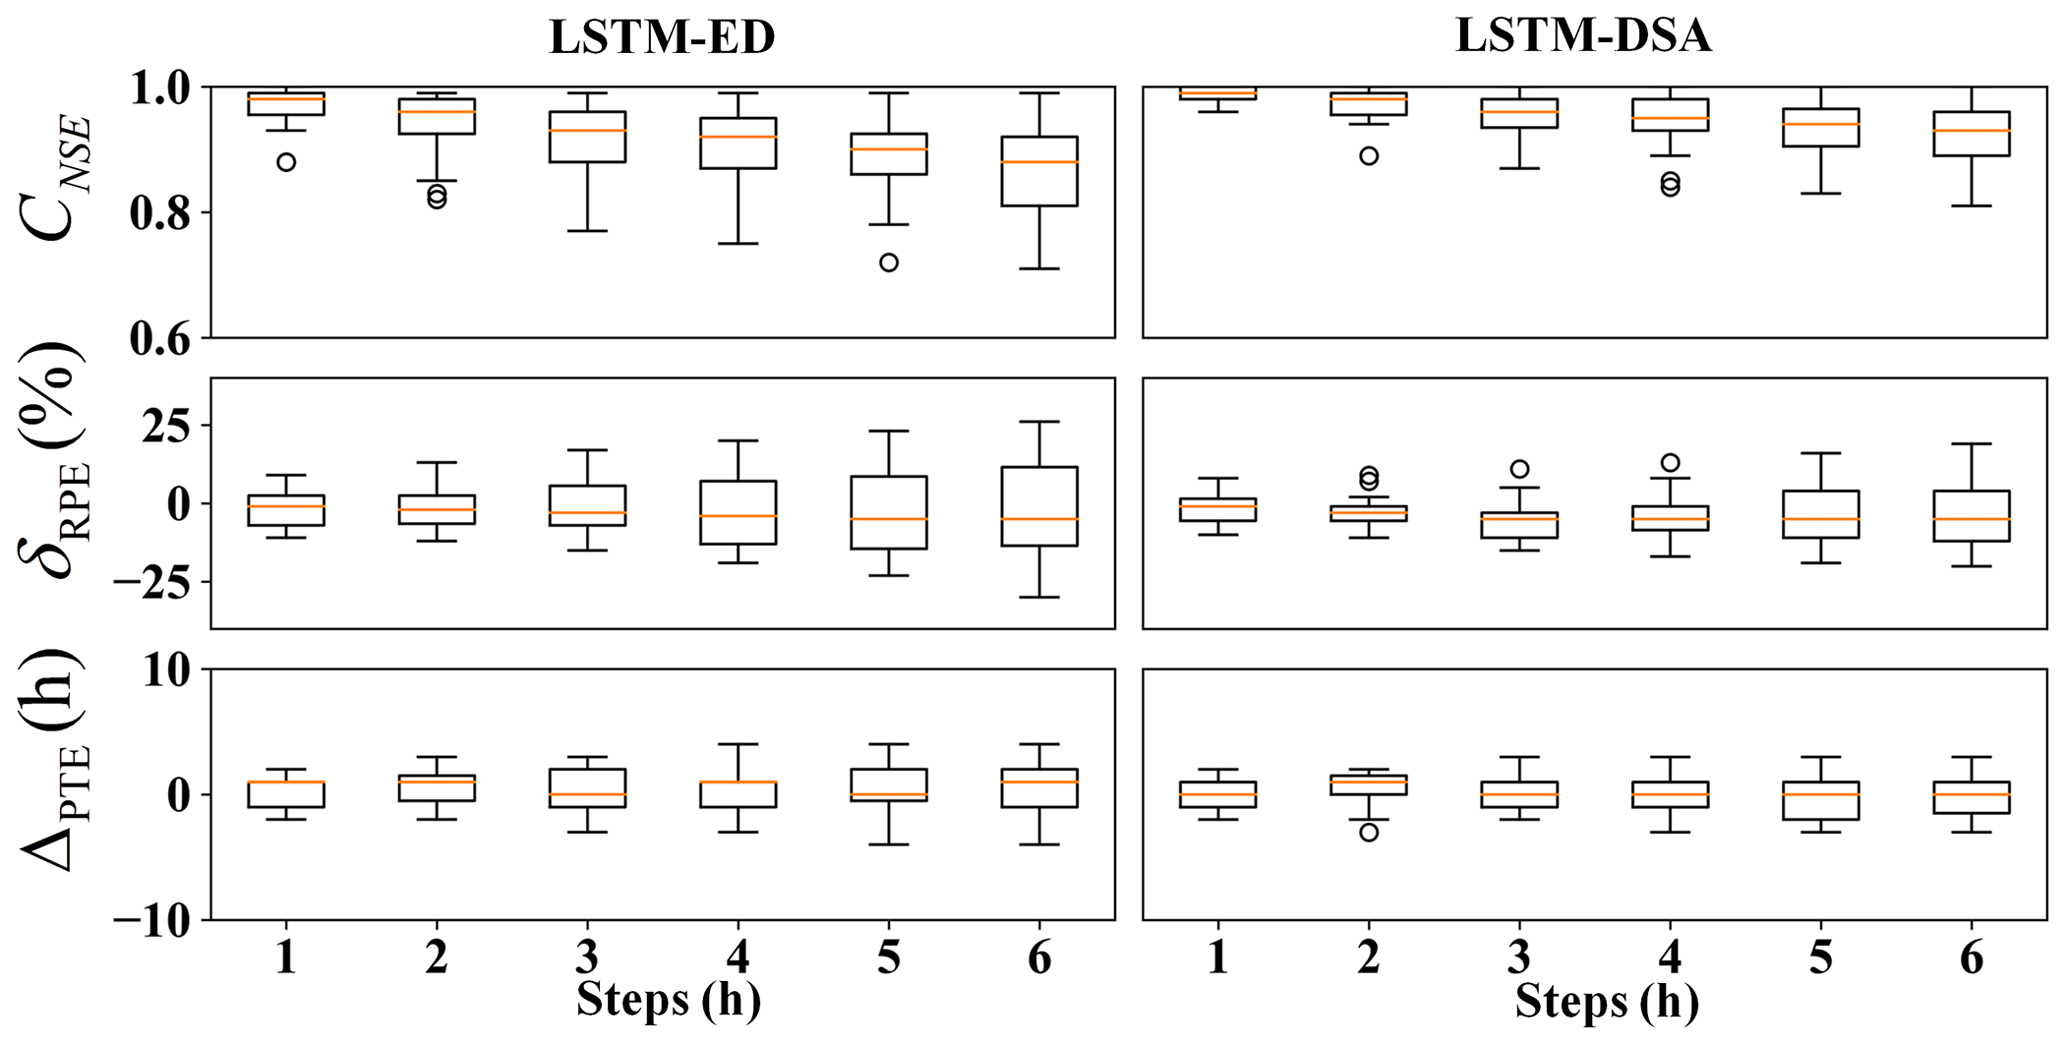
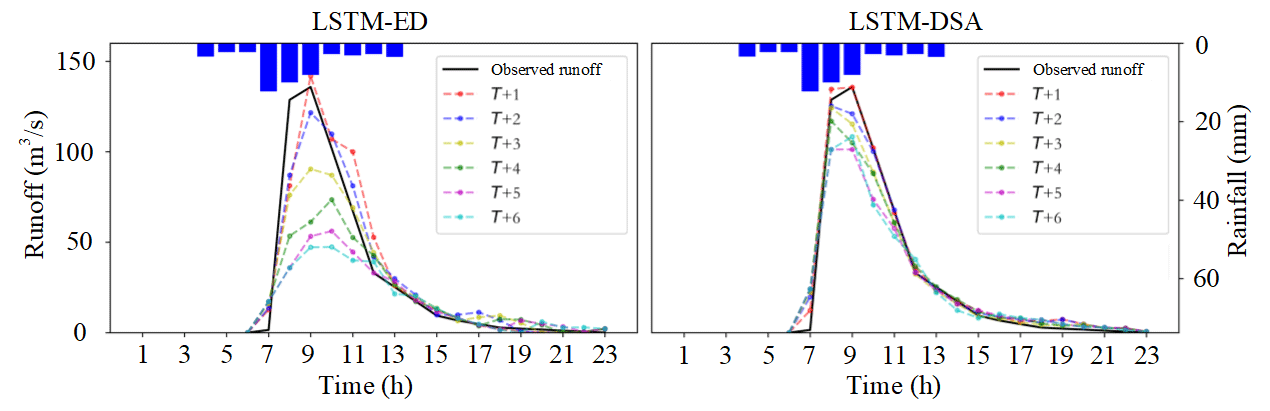
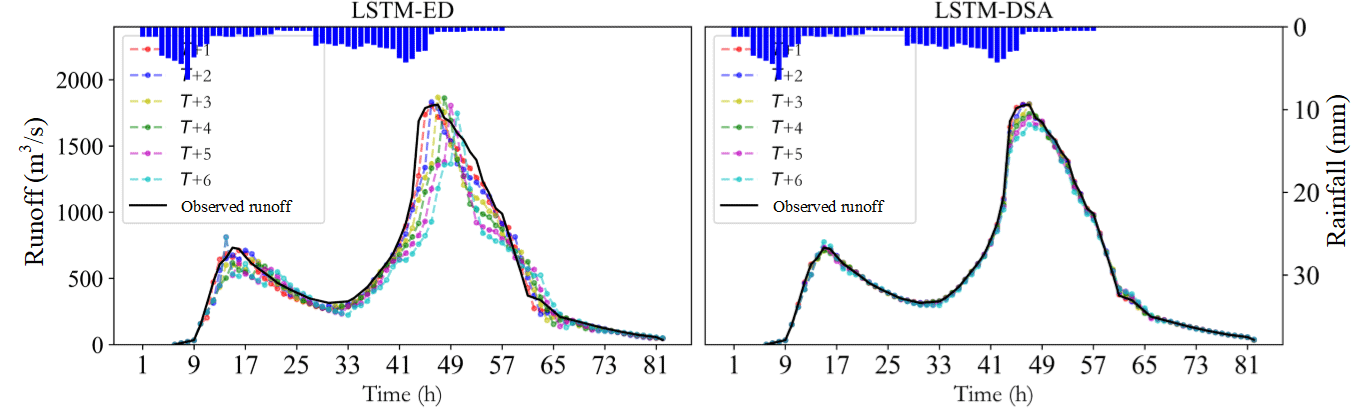
The evaluation metric distributions of the prediction results for each model are depicted in Figs. 5–7 respectively. The predicted hydrographs for typical flood events in each watershed are illustrated in Figs. 8–10.
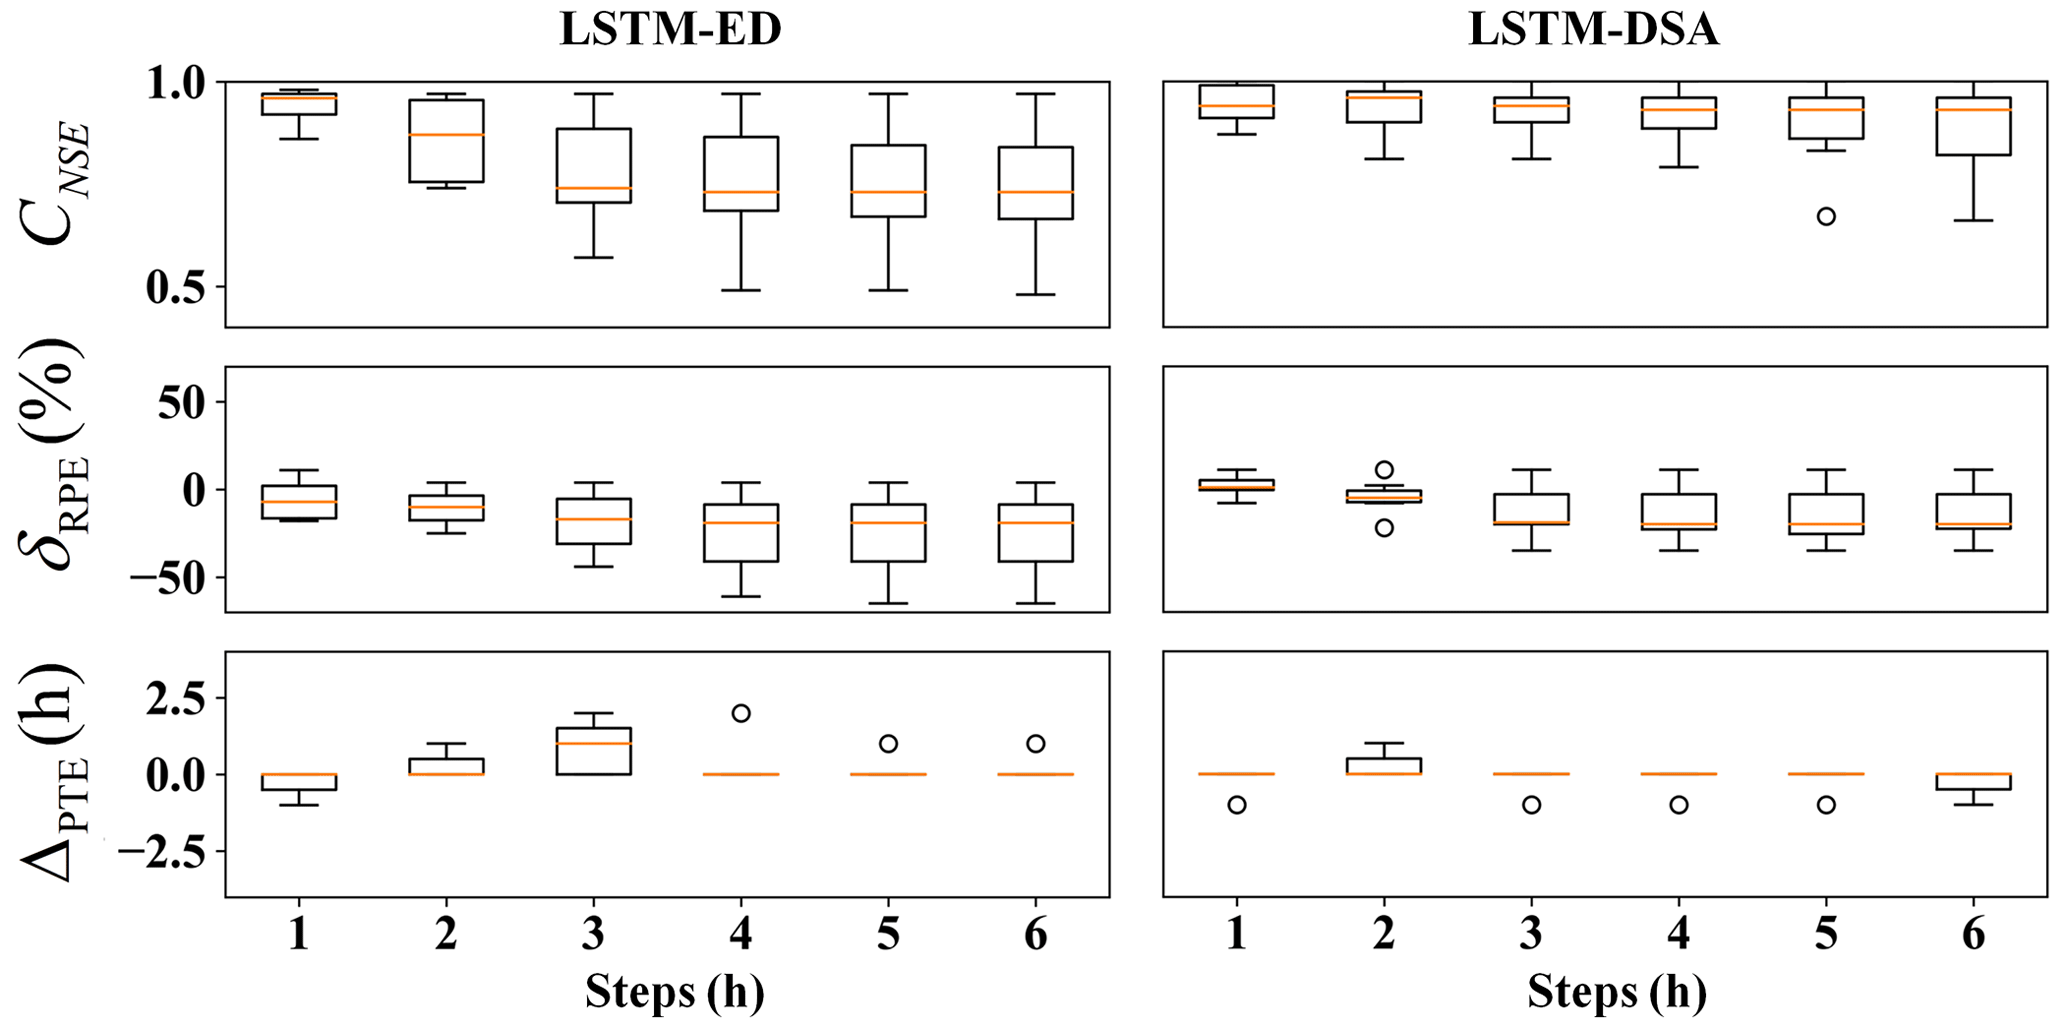
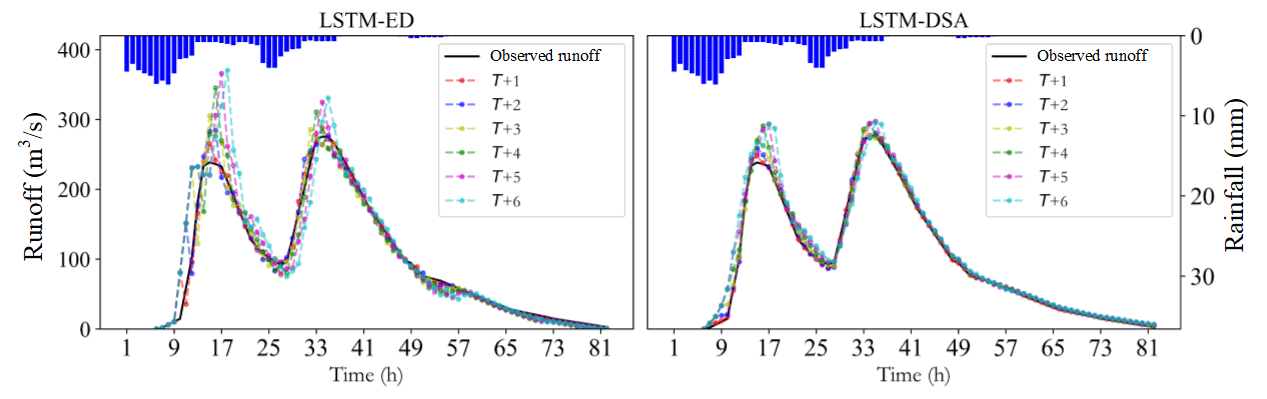
For Xichuan watershed, the Nash efficiency coefficient and relative error of flood peak significantly deteriorate when the prediction step exceeds 3 h. Overall, the estimations of flood peaks are slightly lower than the observed value. The performance of the LSTM-DSA model, meanwhile, surpasses that of the LSTM-ED model.
For Bahe watershed, the performances of both models decrease with the growing of prediction step. For flood peaks, the predicted values are higher than the observed one. The evaluation metrics show improvement with the inclusion of future rainfall data.
The metrics distributions in Yuehe watershed exhibit a comparable phenomenon. The prediction accuracy of both models decreases as the prediction step extends. The estimations of flood peaks are lower than the observed value. Incorporating feedback and a dual-stage attention mechanism enhances the model performance.
The experiments reveal that the performance of all models has exhibited varying degrees of decline as the prediction step extends. The attenuation of information in the input data is believed to contribute to this portion of the prediction error. This phenomenon has been effectively mitigated through the implementation of the feedback mechanism. Overall, the performance of the LSTM-DSA model is greatly enhanced by incorporating feedback and a dual-stage attention mechanism, surpassing that of the LSTM-ED model. The inclusion of the attention mechanism has significantly enhanced prediction accuracy for the Bahe and Yuehe watersheds, whereas its impact on the Xichuan watershed is less pronounced, suggesting that the attention mechanism proves more effective in larger-scale watersheds.
Although we employ a sophisticated model structure, accurate predicting certain floods remains challenging. We believe this error can be attributed to two factors. Firstly, the input of each model solely relies on rainfall and runoff data without considering other relevant variables. The information contained in the input data is insufficient for precise flood prediction. Secondly, there is still room for improvement in optimizing the model, refining the loss function, adjusting batch size, and fine-tuning the hyperparameters.
The paper introduces the LSTM-DSA, a dual-stage attention-based LSTM network for multiple time steps flood forecasting. Three representative watersheds are selected as study areas to access the model performance. The experiment results are evaluated, and the sources of prediction errors are analysed. In summary, the proposed model exhibits a significantly high level of accuracy in predicting floods within distinct prediction steps, demonstrating its exceptional predictive capability. The efficacy of both the feedback mechanism and attention mechanism has also been validated in the domain of flood prediction.
The code is available in Github (https://github.com/Vingttrois/Flood-foresting-model-based-on-LSTM.git, last access: 7 March 2024) and Zenodo (https://doi.org/10.5281/zenodo.10791419, Wang, 2024).
The data are available upon request (wangfan@iwhr.com).
FW established the forecasting model and wrote the text. WW, WB and WL took care of the data processing. DZ revised the results and the text.
The contact author has declared that none of the authors has any competing interests.
Publisher's note: Copernicus Publications remains neutral with regard to jurisdictional claims made in the text, published maps, institutional affiliations, or any other geographical representation in this paper. While Copernicus Publications makes every effort to include appropriate place names, the final responsibility lies with the authors.
This article is part of the special issue “ICFM9 – River Basin Disaster Resilience and Sustainability by All”. It is a result of The 9th International Conference on Flood Management, Tsukuba, Japan, 18–22 February 2023.
This work is supported by the Belt and Road Special Foundation of the National Key Laboratory of Water Disaster Prevention (Grant No. 2021491511).
This research has been supported by the State Key Laboratory of Hydrology-Water Resources and Hydraulic Engineering (grant no. 2021491511).
This paper was edited by Mamoru Miyamoto and reviewed by two anonymous referees.
Addor, N., Newman, A. J., Mizukami, N., and Clark, M. P.: The CAMELS data set: catchment attributes and meteorology for large-sample studies, Hydrol. Earth Syst. Sci., 21, 5293–5313, https://doi.org/10.5194/hess-21-5293-2017, 2017.
Dazzi, S., Vacondio, R., and Mignosa, P.: Flood Stage Forecasting Using Machine-Learning Methods: A Case Study on the Parma River (Italy), Water, 13, 1612, https://doi.org/10.3390/w13121612, 2021.
Hochreiter, S. and Schmidhuber, J.: Long short-term memory, Neural Comput., 9, 1735–1780, https://doi.org/10.1162/neco.1997.9.8.1735, 1997.
Kao, I. F., Zhou, Y. L., Chang, L. C., and Chang, F. J.: Exploring a Long Short-Term Memory based Encoder-Decoder framework for multi-step-ahead flood forecasting, J. Hydrol., 583, 124631, https://doi.org/10.1016/j.jhydrol.2020.124631, 2020.
Kratzert, F., Klotz, D., Brenner, C., Schulz, K., and Herrnegger, M.: Rainfall–runoff modelling using Long Short-Term Memory (LSTM) networks, Hydrol. Earth Syst. Sci., 22, 6005–6022, https://doi.org/10.5194/hess-22-6005-2018, 2018.
Newman, A. J., Clark, M. P., Sampson, K., Wood, A., Hay, L. E., Bock, A., Viger, R. J., Blodgett, D., Brekke, L., Arnold, J. R., Hopson, T., and Duan, Q.: Development of a large-sample watershed-scale hydrometeorological data set for the contiguous USA: data set characteristics and assessment of regional variability in hydrologic model performance, Hydrol. Earth Syst. Sci., 19, 209–223, https://doi.org/10.5194/hess-19-209-2015, 2015.
Thapa, S., Zhao, Z. B., Li, B., Lu, L., Fu, D. L., Shi, X. F., Tang, B., and Qi, H.: Snowmelt-Driven Streamflow Prediction Using Machine Learning Techniques (LSTM, NARX, GPR, and SVR), Water, 12, 1734, https://doi.org/10.3390/w12061734, 2020.
Wang, F.: Vingttrois/Flood-foresting-model-based-on-LSTM: V1.0.0 (V1.0.0), Zenodo [code], https://doi.org/10.5281/zenodo.10791419, 2024.
Xiang, Z. R., Yan, J., and Demir, I.: A Rainfall-Runoff Model With LSTM-Based Sequence-to-Sequence Learning, Water Resour. Res., 56, e2019WR025326, https://doi.org/10.1029/2019wr025326, 2020.