the Creative Commons Attribution 4.0 License.
the Creative Commons Attribution 4.0 License.
 | 19 Apr 2024
Evaluation of climate change impacts on urban flooding using high-resolution rainfall data
Hideo Amaguchi
Jonas Olsson
Akira Kawamura
Yoshiyuki Imamura
Evaluation of the effects of climate change on urban river flow has traditionally depended on design rainfall data due to the scarcity of other data sources. However, high-resolution precipitation data, both temporally and spatially, have become accessible from regional climate models. Despite this availability, few studies have tapped into such high-resolution data to analyze urban river flow systems. This study incorporates an event-based storm runoff and inundation simulation with data from a regional climate model. This model offers a spatial resolution of 5 km and a temporal resolution of 10 min for both current and projected future climate scenarios. Rainfall analysis reveals that the 20-year probability of an hourly rainfall of 75 mm, specific to Tokyo, decreases to around 13 years for the period 2016–2035 and further to approximately 8 years for 2076–2095. This trend indicates a growing frequency of heavy rainfall events. Moreover, flood discharge analysis shows an increased downstream flow during such rainfall events if reservoir capacities remain unchanged. Flood risk assessment underscores a significant threat: areas inundated to depths of 25 cm or more may increase by 1.25 times for 2016–2035 and by 1.55 times for the period 2076–2095 when compared to current conditions.
- Article
(4167 KB) - Full-text XML
- BibTeX
- EndNote


In small to medium-sized urban river watersheds, flood damage often results from pluvial and fluvial flooding, especially when the development of flood control facilities lags and heavy rainfall surpasses facility capacities. According to the Fifth Assessment Report of the Intergovernmental Panel on Climate Change (IPCC, 2013), Japan may experience a rise in the intensity and frequency of short-duration rainfall by the century's end due to an increase in the global average surface temperature.
Many studies have assessed the climate change impact on Class A river systems using the database for policy decision-making regarding future climate change, known as d4PDF (Mizuta et al., 2017). The d4PDF originates from the global model MRI-AGCM3.2, which is the global atmospheric model of the Meteorological Research Institute of Japan with a resolution of 60 km. This has been further refined to a 20 km resolution using a regional model, NHRCM, which covers the Japan area. Flood risk research utilizing the d4PDF includes investigations into future shifts in extreme river flow for the Arakawa, Shonai, and Yodo River watersheds (Tachikawa et al., 2017) and an evaluation of the correlation between cumulative rainfall and peak flood discharge in the Omono River watersheds (Abe et al., 2019). Flood risk assessments due to climate change traditionally target watersheds spanning thousands of square kilometers, constrained by the temporal and spatial resolution of precipitation data. Few assessments focus on urban river watersheds covering tens to hundreds of square kilometers. For urban rivers, the one-hour precipitation data from d4PDF proves inadequate. Accurate flood runoff and inundation risk assessment necessitate finer resolution, such as 10 min rainfall data, where, for instance, the maximum 10 min average rainfall intensity aligns with peak river water levels (Takakura et al., 2016). Climate forecasts suggest a 1.3-fold increase in short-duration heavy rainfall events in Tokyo by the century's end (Social Infrastructure Development Council, 2022). Evaluating runoff analyses based on these future rainfall projections becomes crucial for determining necessary flood control measures.
A suitable dataset for assessing urban watershed flood risks due to climate change is the NHRCM 5 km precipitation data, found in Global Warming Prediction Information Volume 8 (hereafter “Vol.8”). This data is computed by the non-hydrostatic regional climate model from the Japan Meteorological Agency Meteorological Research Institute (JMA/MRI). It offers a spatial resolution of 5 km and a temporal resolution of 10 min (Japan Meteorological Agency, 2013). This dataset encompasses three timeframes: the past (1980–1999), the near future (2016–2035), and the distant future (2076–2095). These values are experimental, based on the SRES A1B scenario (IPCC, 2007).
This study utilized design rainfall with a 20-year probability spanning three periods: 1980–1999 (P1980), 2016–2035 (P2016), and 2076–2095 (P2076). The data was sourced from the NHRCM 5 km precipitation in Vol. 8. Flood runoff and inundation risks in the upper Kanda River watershed due to climate change were assessed using the Tokyo Storm Runoff (TSR) model.
2.1 Comparison with forecast scenario RCP 8.5
Global Warming Projection Information Vol.9 (Japan Meteorological Agency, 2017) provides NHRCM 5 km precipitation data, computed under the RCP8.5 projection scenario. This data is accessible via DIAS with a daily temporal resolution for the P1980 members. Data from the four members of P2076 is also available. This study utilized daily precipitation data from Vol. 9 to assess the 10 min rainfall data in Vol. 8. Figure 1 illustrates the NHRCM 5 km analysis grid alongside the layout of the Automated Meteorological Data Acquisition System (AMeDAS) stations in the vicinity of Tokyo.
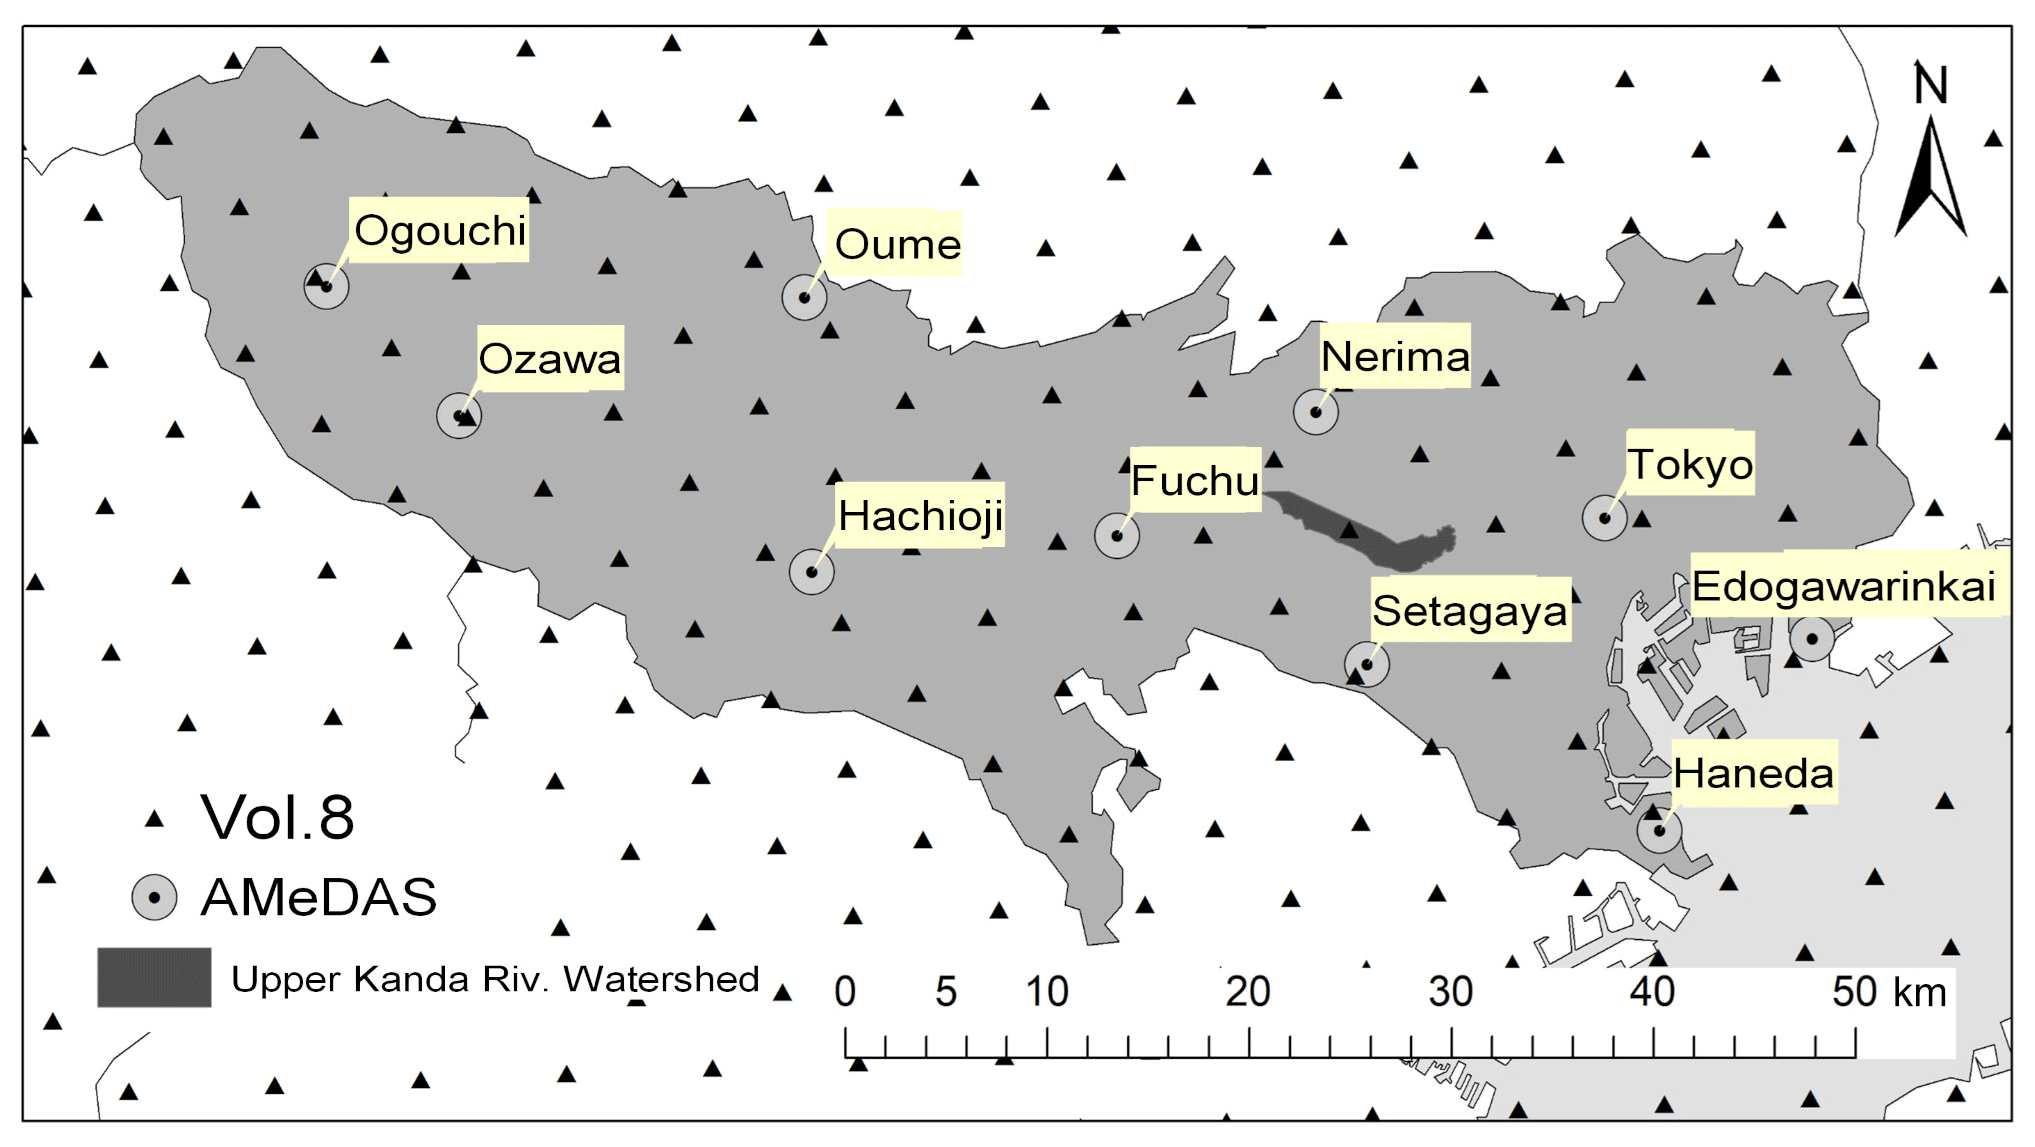
Figure 1NHRCM 5 km analysis grid and AMeDAS stations.
Figure 2 presents the rank statistics of annual maximum daily precipitation for five AMeDAS stations in Tokyo, compared with the analytical grid data from Vol. 8 and 9. The data for Vol. 8 was derived from the 10 min intervals, while bias-corrected data was used for Vol. 9. Figure 2a and b represent the P1980 period, whereas Fig. 2c and d depict the P2076 period. In comparison with the current climate data, the projected values from Vol. 8 surpass those from AMeDAS (Fig. 2a), while the estimates in Vol. 9 are generally lower than AMeDAS data (Fig. 2b). The predicted annual maximum daily precipitation for P1980 in Vol. 8 exceeded the values in Vol. 9 for stations St. Hachioji and St. Fuchu, both situated in western Tokyo. However, the predictions for St Tokyo remain largely consistent (Fig. 2c). For the P2076 timeframe, Vol. 8's predictions tend to be higher than those of Vol. 9 when the annual maximum daily precipitation surpasses approximately 100–150 mm d−1. The annual maximum daily precipitation of A1B scenario's annual maximum daily precipitation was consistently higher than that of the RCP8.5 climate scenario.
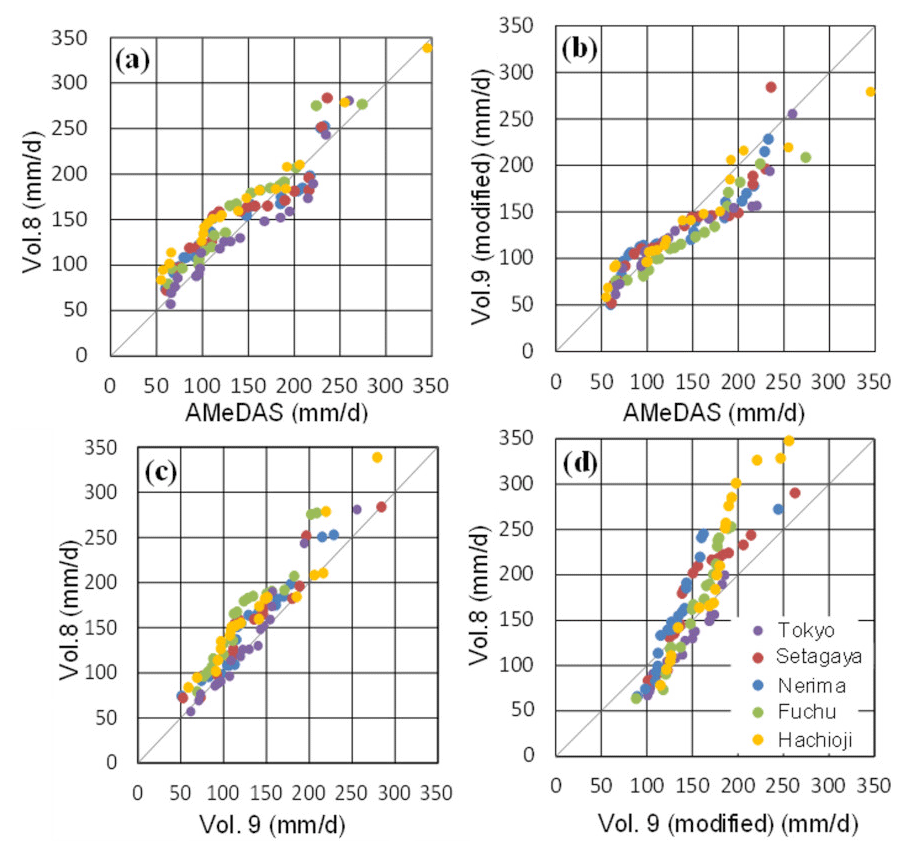
Figure 2Comparison of annual maximum daily rainfall: (a) and (b) cover the P1980 period, (c) and (d) cover the P2076 period.
2.2 Preparation of design rainfall
For flood runoff analyses in urban watersheds, the integration of short-duration rainfall intensity proves crucial. Several methods have been proposed for this objective. However, no singular approach has achieved broad consensus as the most effective (Ioannis, 2022). In Japan, a prevalent strategy when factoring in climate change impacts for flood runoff analysis involves applying a multiplier (a.k.a. climate factor) to the projected rainfall values based on current design rainfall (Arnbjerg-Nielsen et al., 2013; Toda et al., 2020; National Institute for Land and Infrastructure Management, 2017). Given that the 10 min data in Vol. 8 is not bias-corrected, the study emphasizes the need to evaluate the reproducibility of short-term rainfall. To address potential underestimations crucial to urban flood runoff analysis, this research adopted a method to adjust rainfall intensity, utilizing climate factors influenced by climate change-induced precipitation changes. A coefficient (αt) was obtained by assuming a linear relationship between the probability of rainfall in the ground rain gauge (), the probability of rainfall in the present climate (), and by the following formula (Kojima et al., 2018).
where t denotes the rainfall duration(min); and T denotes return period (year). Specifically, grid data at 69 locations were extracted from the NHRCM 5 km time-series precipitation data of P1980 for Tokyo, and annual maxima of 10, 20, 30, 60, 120, and 180 min were generated for each grid (Fig. 1). Time series of precipitation data were generated, and 20-year rainfall probabilities were calculated using a generalized extreme value distribution. Similar processing was applied to ground-based rainfall observation data, and the coefficient α, determined as the average value of all grid data, yielded a value of 1.71, 1.34, 1.27, 0.97, 0.85 and 0.80 respectively. Despite having a temporal resolution of 10 min intervals, the rainfall intensity multiplier α displays pronounced bias for short-duration rainfall, with values of 1.27 for 30 min, 1.34 for 20 min, and 1.71 for 10 min. Given the absence of ground-based rainfall data for P2016 and P2076, the coefficients αt for these periods were adjusted using the coefficients derived from P1980.
The Cleveland type adopted in the Tokyo Metropolitan Government's (TMG) River Plan (Tokyo Metropolitan Government Bureau of Construction, 2012) was used to develop a rainfall intensity equation. The constants were set to 10, 20, 30, 60, 120, and 180 min for the corrected 20-year rainfall probabilities of P1980, P2016, and P2076.
where I denotes the rainfall intensity (mm h−1); t denotes the rainfall duration (min); and a, b, and n denote constants.
Figure 3 shows the rainfall intensity curve with 20-year return period, (a) before and (b) after correction. The NHRCM 5 km rainfall tended to underestimate rainfall shorter than 60 min and overestimate rainfall longer than 60 min. For the annual maximum 60 min rainfall, the climate factor is 1.10 for P2016 and 1.22 for P2076. This factor is less than the change factor of 1.3 for RCP8.5 as determined by d4PDF but exceeds the change factor of 1.1 for RCP2.6.
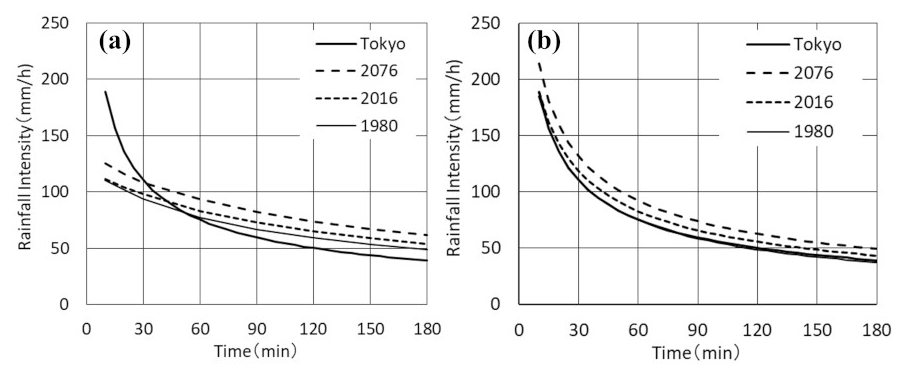
Figure 3Rainfall intensity curve with 20-year return period, (a) before modification, (b) after modification.
A 60 min probability rainfall intensity curve was developed for the 60 min rainfall to assess the future return period of a 20-year 60 min rainfall of 75 mm in a present climate, which is the target of the Tokyo Metropolitan Government's river plan (Tokyo Metropolitan Government Bureau of Construction, 2012) (Fig. 4). The reproducibility of the annual maximum 60 min rainfall in the present climate was very high as the 60 min probability intensity curves for the Tokyo District Meteorological Observatory and NHRCM 5 km almost overlapped. Therefore, no corrections were made to the rainfall probabilities of P2016 and P2076. The return period of 75 mm hourly rainfall will decrease to 13 years in the near future (P2016) and 8 years in the future (P2076), suggesting an increasing trend in heavy rainfall frequency.
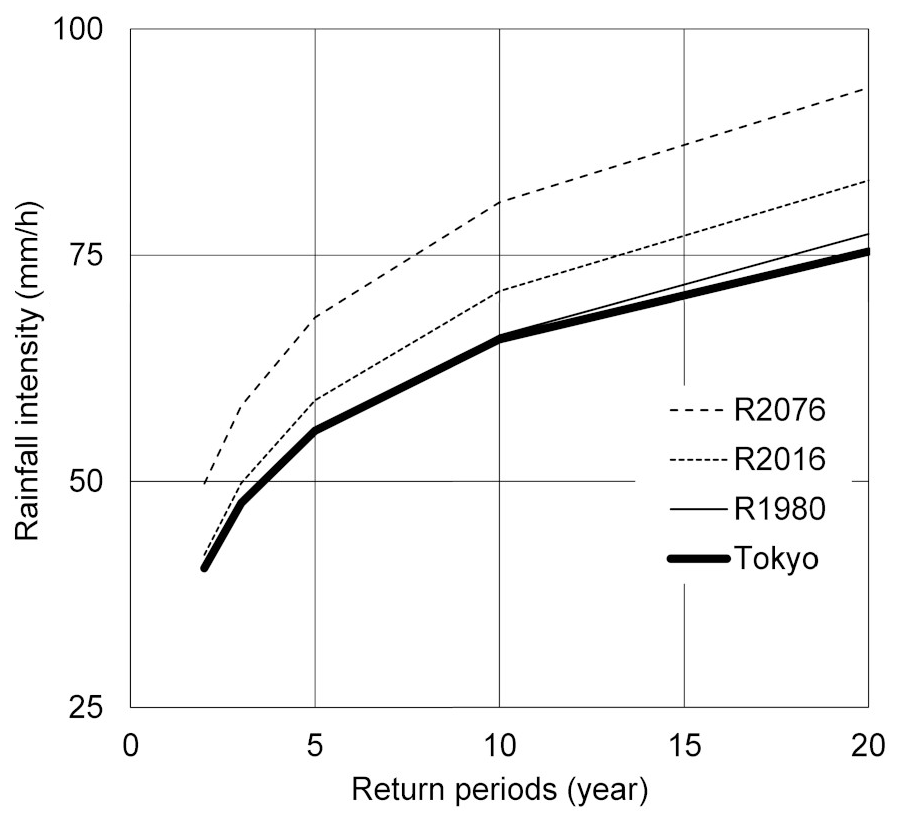
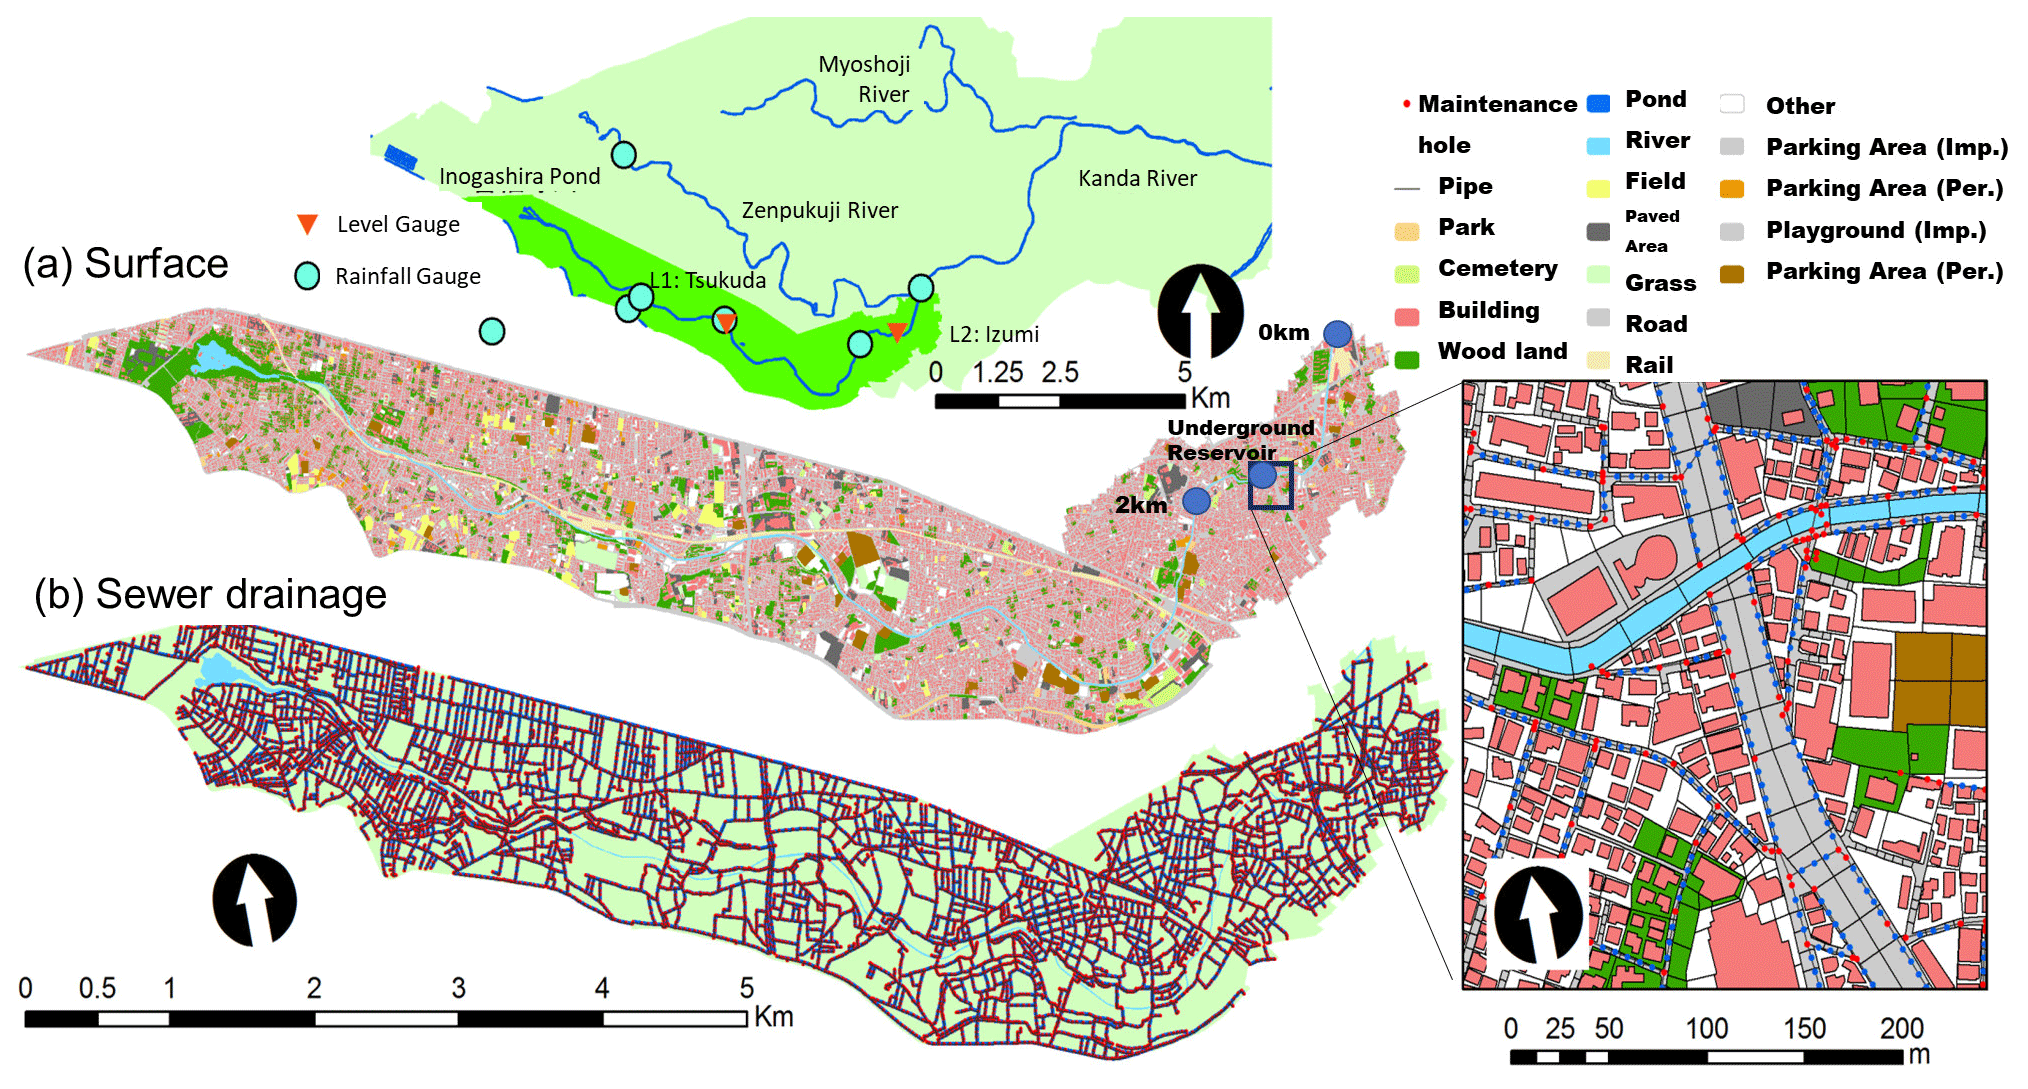
Figure 5Urban landscape GIS delineation of the Upper Kanda River watershed, (a) overland, (b) sewer.
3.1 Outline of the study area
The Kanda River, a quintessential urban river in Tokyo, starts its journey at Inogashira Pond and merges into the Sumida River via the confluence with the Zenpukuji and Myoshoji Rivers. This study focuses on the upper Kanda River segment, spanning from Inogashira Pond to the Zenpukuji River confluence (with a watershed area of 11.8 km2 and a channel length of 9 km). Within this watershed, sewage systems are integrated, channeling waste to the sewage treatment facility through a primary sewer line. Figure 5 illustrates the upper Kanda River watershed's urban landscape GIS, as detailed by Koga et al. (2016), derived from a 1:2500 scale topographic map of Tokyo. The GIS revealed a total of 104 342 surface polygons, with area distribution percentages as follows: buildings (29 %), roads (16 %), green spaces (9 %), paved areas (3 %), private premises excluding buildings (30 %), and other zones (13 %). As for the stormwater pipe network GIS data, it identified manholes with points and pipelines with polylines, recording 9632 manholes and 9904 pipelines.
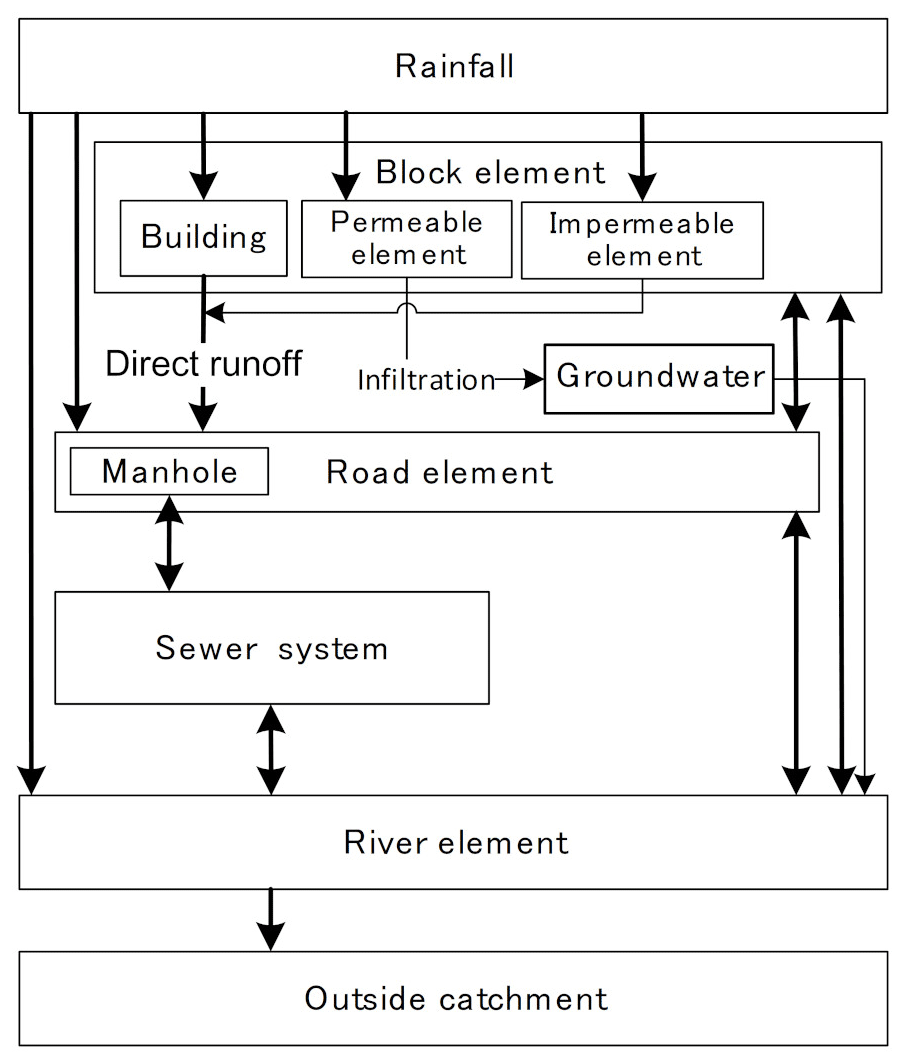
3.2 Overview of the TSR model
The Tokyo Storm Runoff (TSR) model (Amaguchi et al., 2012) served as the primary tool for flood runoff and inundation analysis in urban watersheds for this study. Figure 6 illustrates a conventional rainfall-runoff process captured by the model. Rainfall distribution within the watershed corresponded to each land use element, derived from the urban landscape GIS. Within each urban block, direct runoff from impervious zones and rainfall surpassing the permeability of infiltrating zones was computed based on land use characteristics for infiltration and impermeability. Rainwater from structures was directed to adjacent road sections. In road elements, rainwater either entered storm and sewer pipelines, where manholes existed or continued its surface flow in their absence. Consequently, water entering storm and sewer lines navigated through the pipeline network, ultimately discharging into the river and exiting the watershed.
Parameters in the TSR model, such as initial loss, initial infiltration capacity, final infiltration capacity, infiltration capacity attenuation coefficient, and equivalent roughness coefficient of land-use elements, were set according to values from an earlier study (Amaguchi et al., 2013). The model addressed the significant flood event on 4 September 2000, within the Kanda watershed. Despite no flood damage in the target watershed, largely due to effective underground control basins, the model simulated the event as if these control basins were non-operational. Model validation occurred by contrasting its outputs with river water levels measured at upstream sites, unaffected by underground control basins. This validation confirmed the model's ability to accurately reproduce the observed river water levels across the board.
3.3 Conditions of application
The underground control reservoir of Loop Route 7, currently connected to the northern part of the Zempukuji River, has a total storage capacity of 540 000 m3. In this study, the storage capacity was set at 240 000 m3, which corresponds to the section between the Kanda Rivers. To model the underground reservoirs, the stormwater and sewerage pipeline modelling method in the TSR model was applied, and the overflow height and width were used as connection information between the river channel and reservoirs.
Three types of watershed measures in the river plan were covered: rainwater penetration, infiltration trenches, and permeable pavements installed by the year 2000 (Araki et al., 2012). Tabulated data enabled the attribution of the quantity of rainwater infiltration facilities per building, infiltration trench length per building (in meters), and paved area (in square meters) to the Kanda River Watershed's land-use GIS data based on provided addresses and additional details. The watershed contained approximately 10 000 rainwater penetration inlets, an infiltration trench length totaling 40 km, and permeable pavement covering 220 000 m2.
The unit infiltration capacities of rainwater penetration and trenches were 0.234 m3 pcs−1 h−1 and 0.220 m3 m−1 h−1, respectively (Tokyo Metropolitan Council for Comprehensive Flood Control Measures, 2019). For the permeable pavement, a thickness of 0.20 m and porosity of 0.1 was used for the permeable pavement with a storage volume of 20 mm (Tokyo Metropolitan Council for Comprehensive Flood Control Measures, 2019). The TSR model was calculated using different building infiltration capacities and storage volumes for each road.
4.1 Flooding risk assessment using design rainfall
Employing design rainfall based on a future 20-year return period, variations in channel flow and peak inundated areas within the study region were compared across periods to assess flood risk. Channel flow changes are examined at the confluence depicted in Fig. 7 and at a location 2 km away from the confluence. An underground control reservoir is located 1.3 km from this confluence.
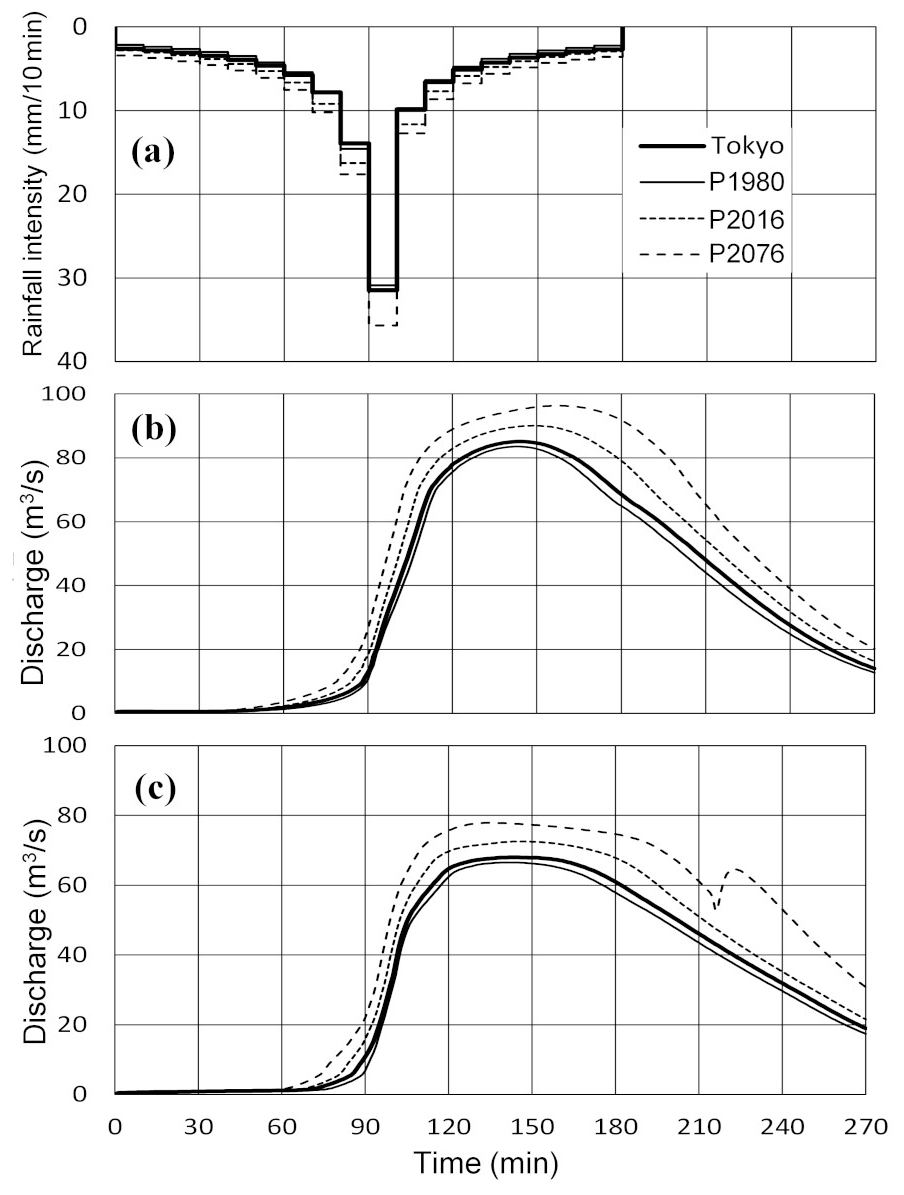
Figure 7Results of flood discharge analysis, (a) rainfall intensity, (b) discharge at 2 km, and (c) discharge at confluence point flow rate at the confluence.
Due to the elongated shape of the watershed in the downstream direction, the peak flow from the 2 km point is already in a downstream state. Therefore, the maximum flow is larger at the 2 km point for all periods, and the flow decreases as it reaches the confluence point. In the case of P2076, a swift rise in discharge occurred post the peak rainfall at the confluence location. This surge results from the reservoir hitting its capacity, preventing water transfer to the underground reservoir. The peak flow variation was more pronounced 2 km away than at the confluence for all durations. When comparing peak flow multipliers relative to P1980, P2016 increased by 1.08 times and P2076 by 1.15 times at the 2 km location. Meanwhile, for the confluence location, P2016 increased by 1.09 times and P2076 by 1.17 times. This suggests that the risk of flooding seemed to amplify further downstream from the control reservoir.
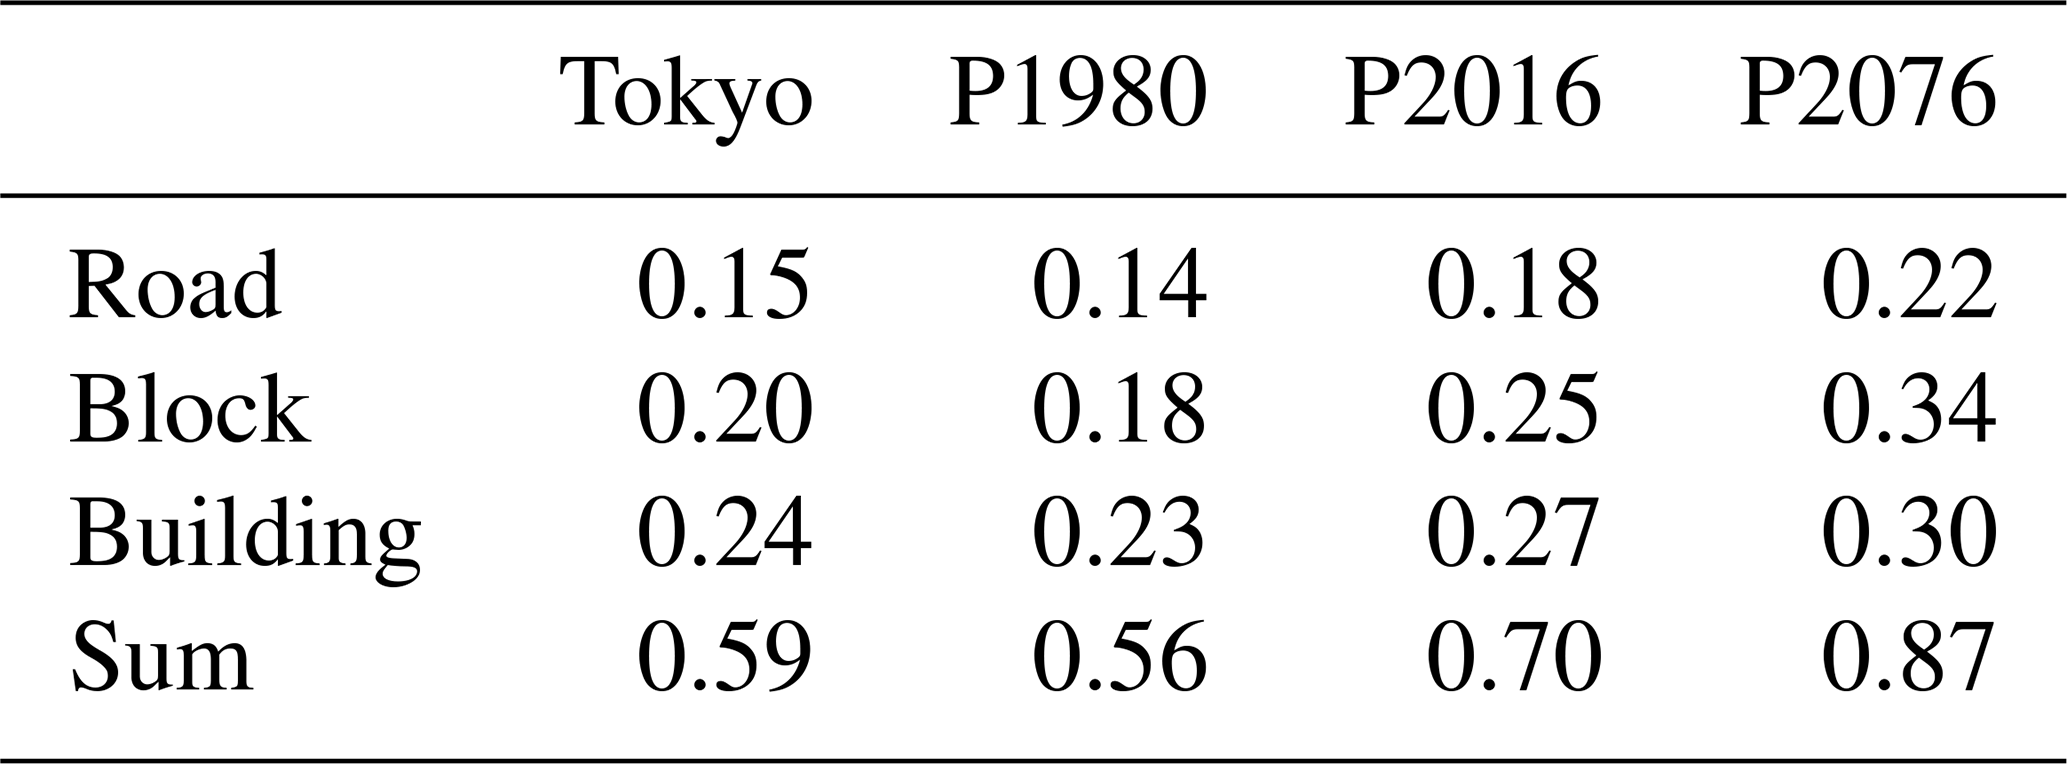
Figure 8 shows the maximum inundation map for depths of 25 cm or greater, and Table 1 lists the corresponding inundation areas for roads, city blocks, and houses. The maximum inundation area with a depth exceeding 25 cm is approximately 0.56 km2 in the present climate (P1980), approximately 0.70 km2 in the P2016 period, and around 0.87 km2 in the future P2076. When compared to the present climate, the inundated area was approximately 1.25 times larger in P2016 and approximately 1.55 times larger in the future (P2076).
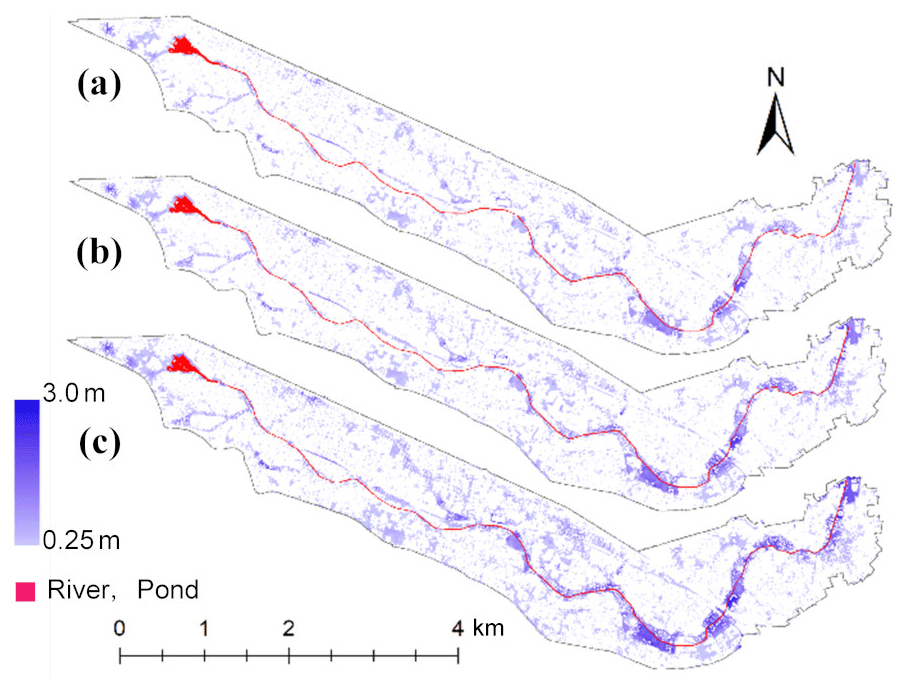
Figure 8Maximum inundated area above 25 cm depth, (a) P1980, (b) P2016, and (c) P2076.
4.2 Flood risk assessment using rainstorm events
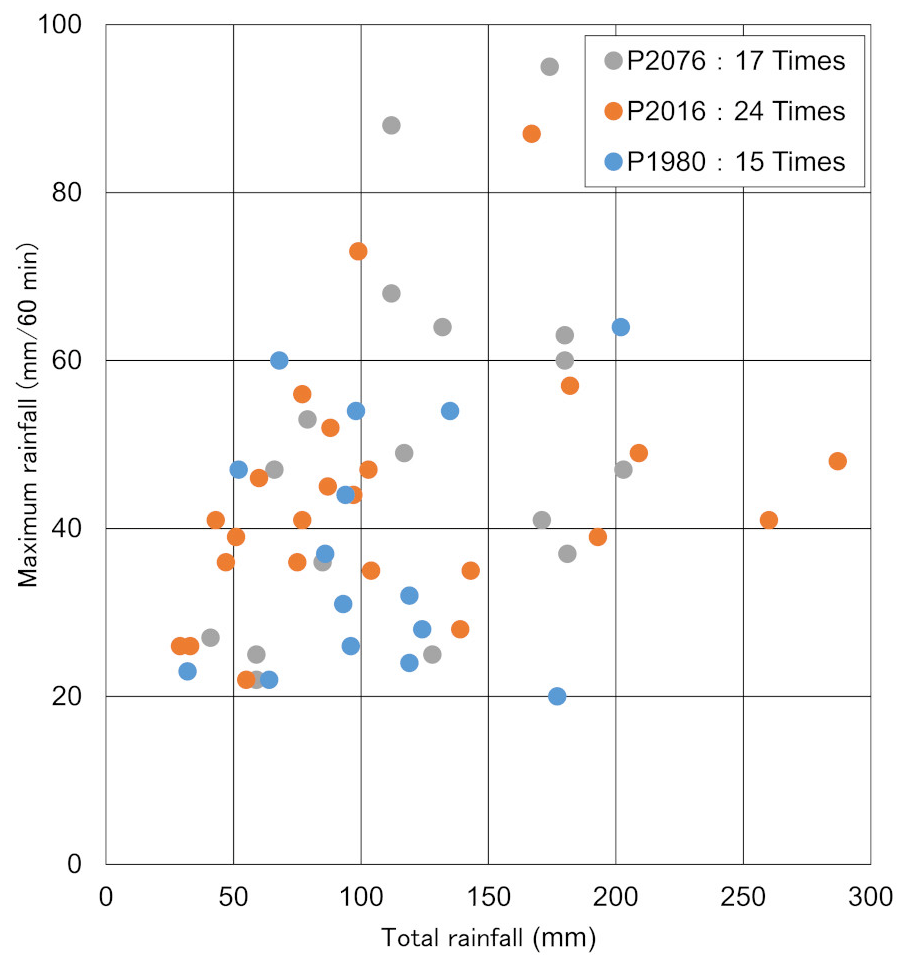
In flood runoff analyses based on projected rainfall, assessing river flow variations due to rainfall events, including factors, such as rainfall magnitude and duration, is difficult. To evaluate the effects of rainfall patterns on the NHRCM 5 km, flood runoff characteristics due to rainstorm events were estimated with a maximum hourly rainfall exceeding 20 mm. As mentioned above, rainfall with a duration of more than 60 min can be overestimated. However, it is important to consider rainstorm events in terms of flood frequency, which cannot be captured by analyzing the designed rainfall. Figure 9 shows the selected heavy rainfall events, where the vertical axis represents the 60 min maximum rainfall and horizontal axis represents the total rainfall. In the near future, P2016 will have a high frequency, and P2076 will have many events with a 60 min maximum rainfall exceeding 60 mm.
Using the selected rainstorm events, changes in river water levels accumulated over time, and the risk of river channel flooding were assessed. For the upstream and downstream sides of the regulating reservoir, the cumulative time at which the river water levels exceeded the bank height and bank height −1 m was calculated.
Figure 10 displays the accumulated time of exceedance based on the criteria previously mentioned. When comparing the accumulated time beyond both bank elevation and bank elevation −1 m between the two sites for all periods, the upstream river is found to be flooded more than the downstream river. This suggests that the flooding risk in terms of flood frequency is higher on the upstream side of the underground reservoir. During the P2016 period, although 24 events registered rainfall surpassing 20 mm h−1, the peak was around 60 mm, leading to more time at bank elevation −1 m. In the P2076 period, the number of events, 17, mirrored that of the P1980 period. However, six of these events had a maximum hourly rainfall exceeding 60 mm, resulting in the water level surpassing the bank height for approximately three times the hours observed in P1980.
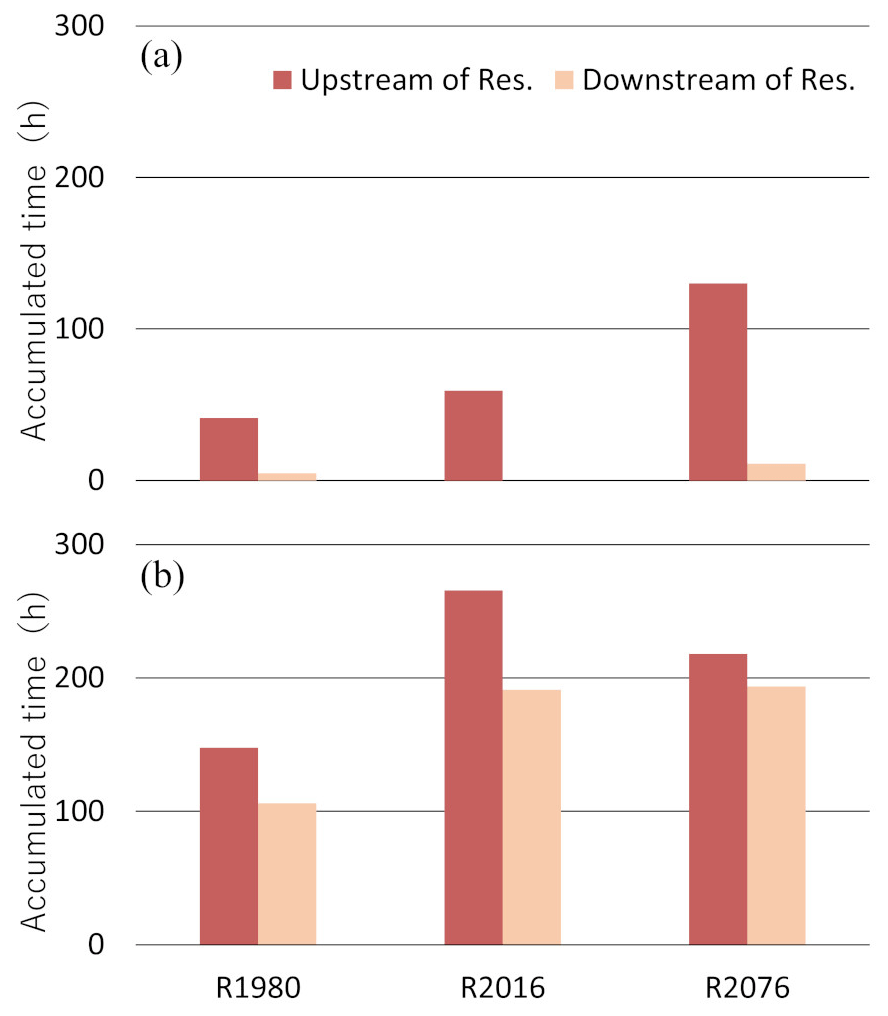
Figure 10Accumulated time of exceedance of the reference level at points upstream and downstream of the underground reservoir: (a) bank-level and (b) bank-level –1 m.
In this study, the NHRCM 5 km 10 min precipitation data were used to generate a design rainfall with a 20-year return period for 1980–1999, 2016–2035, and 2076–2095. Furthermore, flood runoff and inundation analyses were conducted for the upper Kanda River watershed using the Tokyo Storm Runoff (TSR) model to examine the risk of inundation due to climate change.
The rainfall analysis indicated that the future return period of today's 1 h 20-year rainfall (75 mm), which is the river plan for the Tokyo metropolitan area, is about 13 years for 2016–2035 and about 8 years for 2076–2095, suggesting an increasing trend in the frequency of heavy rainfalls. It was confirmed by the flood discharge analysis that the flow rate during rainfall increased, and a more pronounced flow rate was observed downstream than in the middle part of the river when the reservoir's capacity was assumed to remain unchanged from its current state. Through the flood risk assessment, it was determined that the maximum inundated area with depths of 25 cm or greater would experience an increase of approximately 1.25 times for the 2016–2035 period and approximately 1.55 times for the 2076–2095 period when compared to the present conditions.
To conclude, we have shown how historical rainfall statistics and future high-resolution climate projections can be combined in order to estimate future short-duration rainfall extremes. These data may then be used for detailed evaluation of climate adaptation measures to reduce urban flood risk, as demonstrated here. The development of high-resolution convection-permitting RCMs that well represent observed small-scale rainfall extremes is highly encouraging (e.g. Olsson et al., 2021). Still only a limited amount of future projections are available because of the high computational demand, but much research and development is currently devoted to this field. It is our hope that this will improve the accuracy and reliability of urban flood risk assessment and, in turn, lead to better-informed adaptation measures being taken.
The rainfall datasets used were collected and provided under the Data Integration and Analysis System (DIAS), which was developed and operated by the Ministry of Education, Culture, Sports, Science and Technology of Japan, available at: https://search.diasjp.net/ja/dataset/JMA_GWP (last access: 10 March 2023).
All the authors HA, JO, AK, and YI participated in conceptualizing the study, collecting data, analyzing data, and drafting the manuscript.
The contact author has declared that none of the authors has any competing interests.
Publisher’s note: Copernicus Publications remains neutral with regard to jurisdictional claims made in the text, published maps, institutional affiliations, or any other geographical representation in this paper. While Copernicus Publications makes every effort to include appropriate place names, the final responsibility lies with the authors.
This article is part of the special issue “ICFM9 – River Basin Disaster Resilience and Sustainability by All”. It is a result of The 9th International Conference on Flood Management, Tsukuba, Japan, 18–22 February 2023.
This study used data produced with the Earth Simulator by the Program for Risk Information on Climate Change (SOUSEI) and Integrated Research Program for Advancing Climate Models (TOUGOU) from the Ministry of Education, Culture, Sports, Science and Technology (MEXT), Japan. We thank the reviewers for constructive comments on the original manuscript.
This research has been supported by the Tokyo Metropolitan Advanced Research (gran no. R4-2).
This paper was edited by Daisuke HARADA and reviewed by two anonymous referees.
Abe, S., Watanabe, S., Yamada, M., Kotsuki, S., and Watanuki, A.: Effects of observed precipitation and sea surface temperature patterns on inundation analysis using large-scale climate prediction information, J. Jpn. Soc. Civ. Eng. Ser. B1, 75, I_1081–I_1086, https://doi.org/10.2208/jscejhe.75.2_I_1081, 2019 (in Japanese with English abstract).
Amaguchi, H., Kawamura, A., Olsson, J., and Takasaki, T.: Development and testing of a distributed urban storm runoff event model with a vector-based catchment delineation, J. Hydrol., 420/421, 205–215. https://doi.org/10.1016/j.jhydrol.2011.12.003, 2012.
Amaguchi, H., Nagasaka, T., Kawamura, A., Takasaki, T., and Nakagawa, N.: A proposal of storm runoff model considering process of building inundation for an urban catchment, Adv. River Eng., 19, 211–216, 2013 (in Japanese with English abstract).
Araki, T., Amaguchi, H., Kawamura, A., and Takasaki, T.: Development of a groundwater recharge model for an urban catchment using urban landscape GIS delineation and its simulation for actual catchment, J. Jpn. Soc. Civ. Eng. Ser. B1, 68, 109–124, 2012 (in Japanese with English abstract).
Arnbjerg-Nielsen, K., Willems, P., Olsson, J., Beecham, S., Pathirana, I., Bülow Gregersen, I., Madsen, H., and Nguyen, V.-T.-V.: Impacts of Climate Change on Rainfall Extremes and Urban Drainage Systems: a review, Water Sci. Technol., 68, 16–28, https://doi.org/10.2166/wst.2013.251, 2013.
Social Infrastructure Development Council (SIDC): Countermeasures of Water-related Disasters due to Global Warming, available at: https://www.mlit.go.jp/river/shinngikai_blog/chisui_kentoukai/index.html (last access: 10 November 2022), 2020 (in Japanese).
Ioannis, M. K. and Vassilios, A. T.: Update of intensity-duration-frequency (IDF) curves under climate change: a review, Water Supply, 22, 4951–4974, https://doi.org/10.2166/ws.2022.152, 2022.
IPCC (Intergovernmental Panel on Climate Change): Climate change 2007: The Physical Science Basis, Contribution of Working Group I to the Fourth Assessment Report of the Intergovernmental Panel on Climate Change, edited by: Solomon, S., Qin, D., Manning, M., Chen, Z., Marquis, M., Averyt, K. B., Tignor, M., and Miller, H. L., Cambridge University Press, Cambridge, United Kingdom and New York, NY, USA, 996 pp., ISBN: 978-0521-88009-1, 2007.
IPCC (Intergovernmental Panel on Climate Change): Climate change 2013: The Physical Science Basis, Contribution of Working Group I to the Fifth Assessment Report of the Intergovernmental Panel on Climate Change, edited by: Stocker, T. F., Qin, D., Plattner, G. K., Tignor, M., Allen, S. K., Boschung, J., Nauels, A., Xia, Y., Vex, V., and Midgley, P. M., Cambridge University Press, Cambridge, UK, and New York, USA, 1535 pp., ISBN: 9781107415324, 2013.
Japan Meteorological Agency (JMA): Global Warming Prediction Information, Vol. 8, https://www.data.jma.go.jp/cpdinfo/GWP/Vol8/index.html (last access: 10 March 2023) 2013 (in Japanese).
Japan Meteorological Agency (JMA): Global Warming Prediction Information, Vol. 9, https://www.data.jma.go.jp/cpdinfo/GWP/Vol9/index.html (last access: 10 March 2023) 2017 (in Japanese).
Koga, T., Kawamura, A., Amaguchi, H., and Tanouchi, H.: Assessing impervious area ratios of grid-based land-use classifications on an example of an urban watershed, Hydrol. Sci. J., 61, 1728–1739, https://doi.org/10.1080/02626667.2015.1133909, 2016.
Kojima, T., Maruya, Y., and Harada, M.: Proposal of the correction formula of probability rainfall produced by 20 km d4PDF for Gifu Prefecture, J. Jpn. Soc. Civ. Eng. Ser. B1, 74, I_133–I_138, https://doi.org/10.2208/jscejhe.74.5_I_133, 2018 (in Japanese with English abstract).
Mizuta, R., Murata, A., Ishii, M., Shiogama, H., Hibino, K., Mori, N., Arakawa, O., Imada, Y., Yoshida, K., Aoyagi, T., Kawase, H., Mori, M., Okada, Y., Shimura, T., Nagatomo, T., Ikeda, M., Endo, H., Nosaka, M., Arai, M., and Kimoto, M.: Over 5,000 Years of Ensemble Future Climate Simulations by 60 km Global and 20 km Regional Atmospheric Models, Bull. Am. Meteorol. Soc., 98, 1383–1398, https://doi.org/10.1175/BAMS-D-16-0099.1, 2017.
National Institute for Land and Infrastructure Management (NILIM): Research on Climate Change Adaptation in River and Coastal Management – With focusing on the results of Project Research titled “Development of base technology to support forming a portfolio of management alternatives for large-scale water-related disasters under climate change”, Project research report, NILIM, 56, ISSN 1880-0114, 2017 (in Japanese).
Olsson, J., Du, Y., An, D., Uvo, C.B., Sörensen, J., Toivonen, E., Belušić, D., and Dobler, A.: An Analysis of (Sub-)Hourly Rainfall in Convection-Permitting Climate Simulations Over Southern Sweden From a User's Perspective, Front. Earth Sci., 9, 681312, https://doi.org/10.3389/feart.2021.681312, 2021.
Tachikawa, Y., Miyawaki, K., Tanaka, T., Yorozu, K., Kato, M., Ichikawa, Y., and Kim S.: Analysis of future changes in extreme river flows using super multiple ensemble climate prediction experimental data, J. Jpn. Soc. Civ. Eng. Ser. B1, 73, 77–90, https://doi.org/10.2208/jscejhe.73.77, 2017 (in Japanese with English abstract).
Takakura, N. and Ikeda, N.: Prediction analysis of water level change of the city river caused by local torrential Rain, Tokyu Constr. Tech. Inst. Bull., 42, 75–80, 2016 (in Japanese with English abstract).
Toda, A., Ozaki, T., Hashimoto, A., and Toda, K. : Estimation of future probable precipitation using d4PDF and its impact on water drainage planning – case study on Kinki region, J. Jpn. Soc. Civ. Eng. Ser. G, 76, II_227–II_235, https://doi.org/10.2208/jscejer.76.6_II_227, 2020 (in Japanese with English abstract).
Tokyo Metropolitan Government Bureau of Construction: Future Maintenance of Small and Medium-sized Rivers in Tokyo, https://www.kensetsu.metro.tokyo.lg.jp/jigyo/river/chusho_seibi/chusho_arikata/index_chusho_arikata.html (last access: 31 March 2020) 2012 (in Japanese).
Tokyo Metropolitan Council for Comprehensive Flood Control Measures: Tokyo Metropolitan Government Technical Guidelines for Rainwater Storage and Infiltration Facilities, http://www.tokyo-sougou-chisui.jp/shishin/index.html (last access: 10 March 2023) 2019 (in Japanese).
- Abstract
- Introduction
- Design rainfall based on NHRCM 5 km rainfall data
- Study area and flood modelling
- Results and discussion
- Summary and conclusion
- Data availability
- Author contributions
- Competing interests
- Disclaimer
- Special issue statement
- Acknowledgements
- Financial support
- Review statement
- References