| 18 Apr 2024
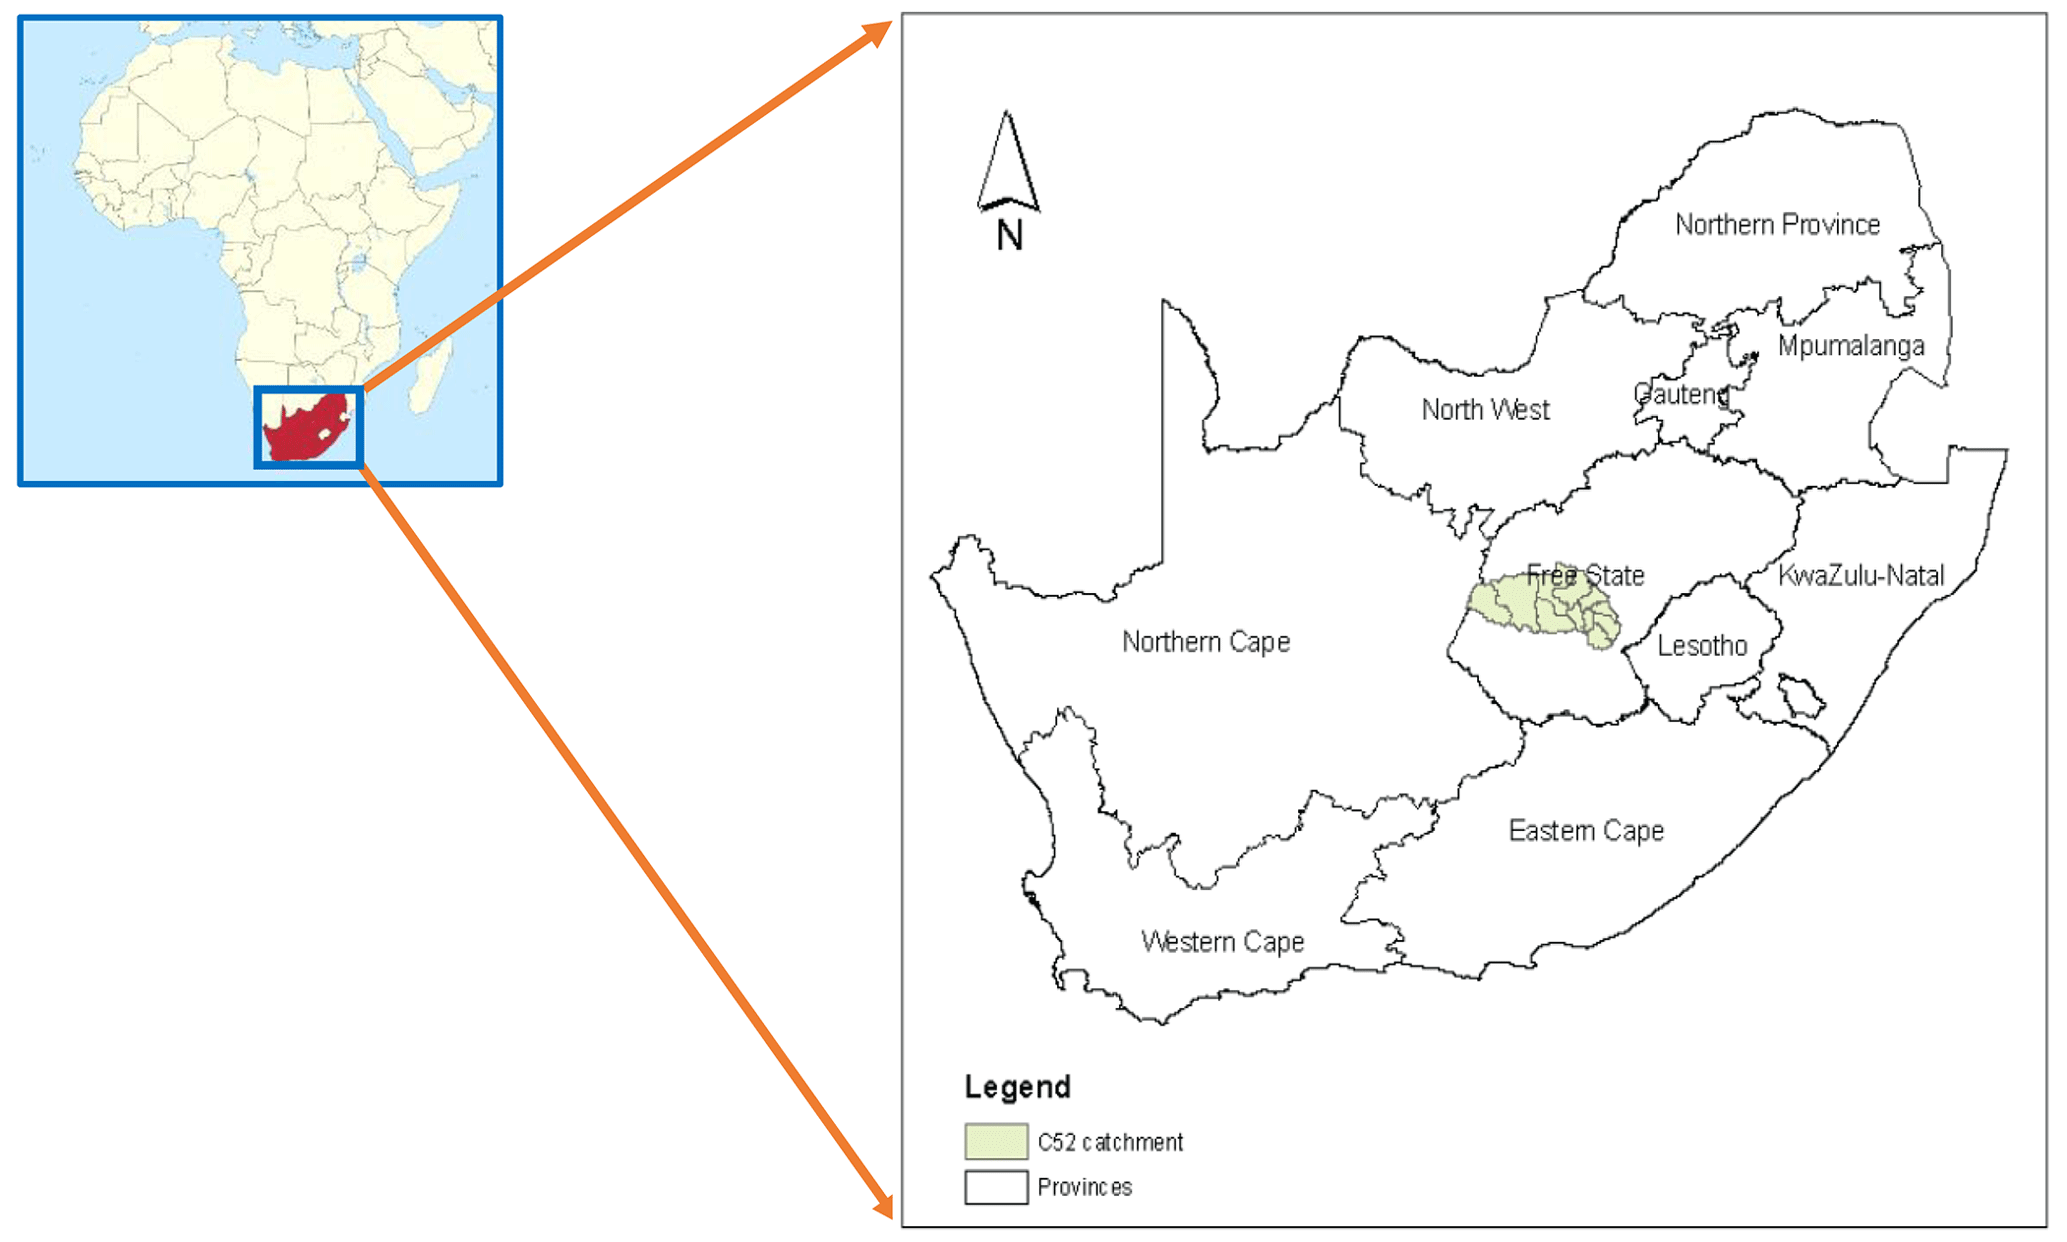
Assessment of climate change impact and comparison of downscaling approaches: a case study in a semi-arid river basin
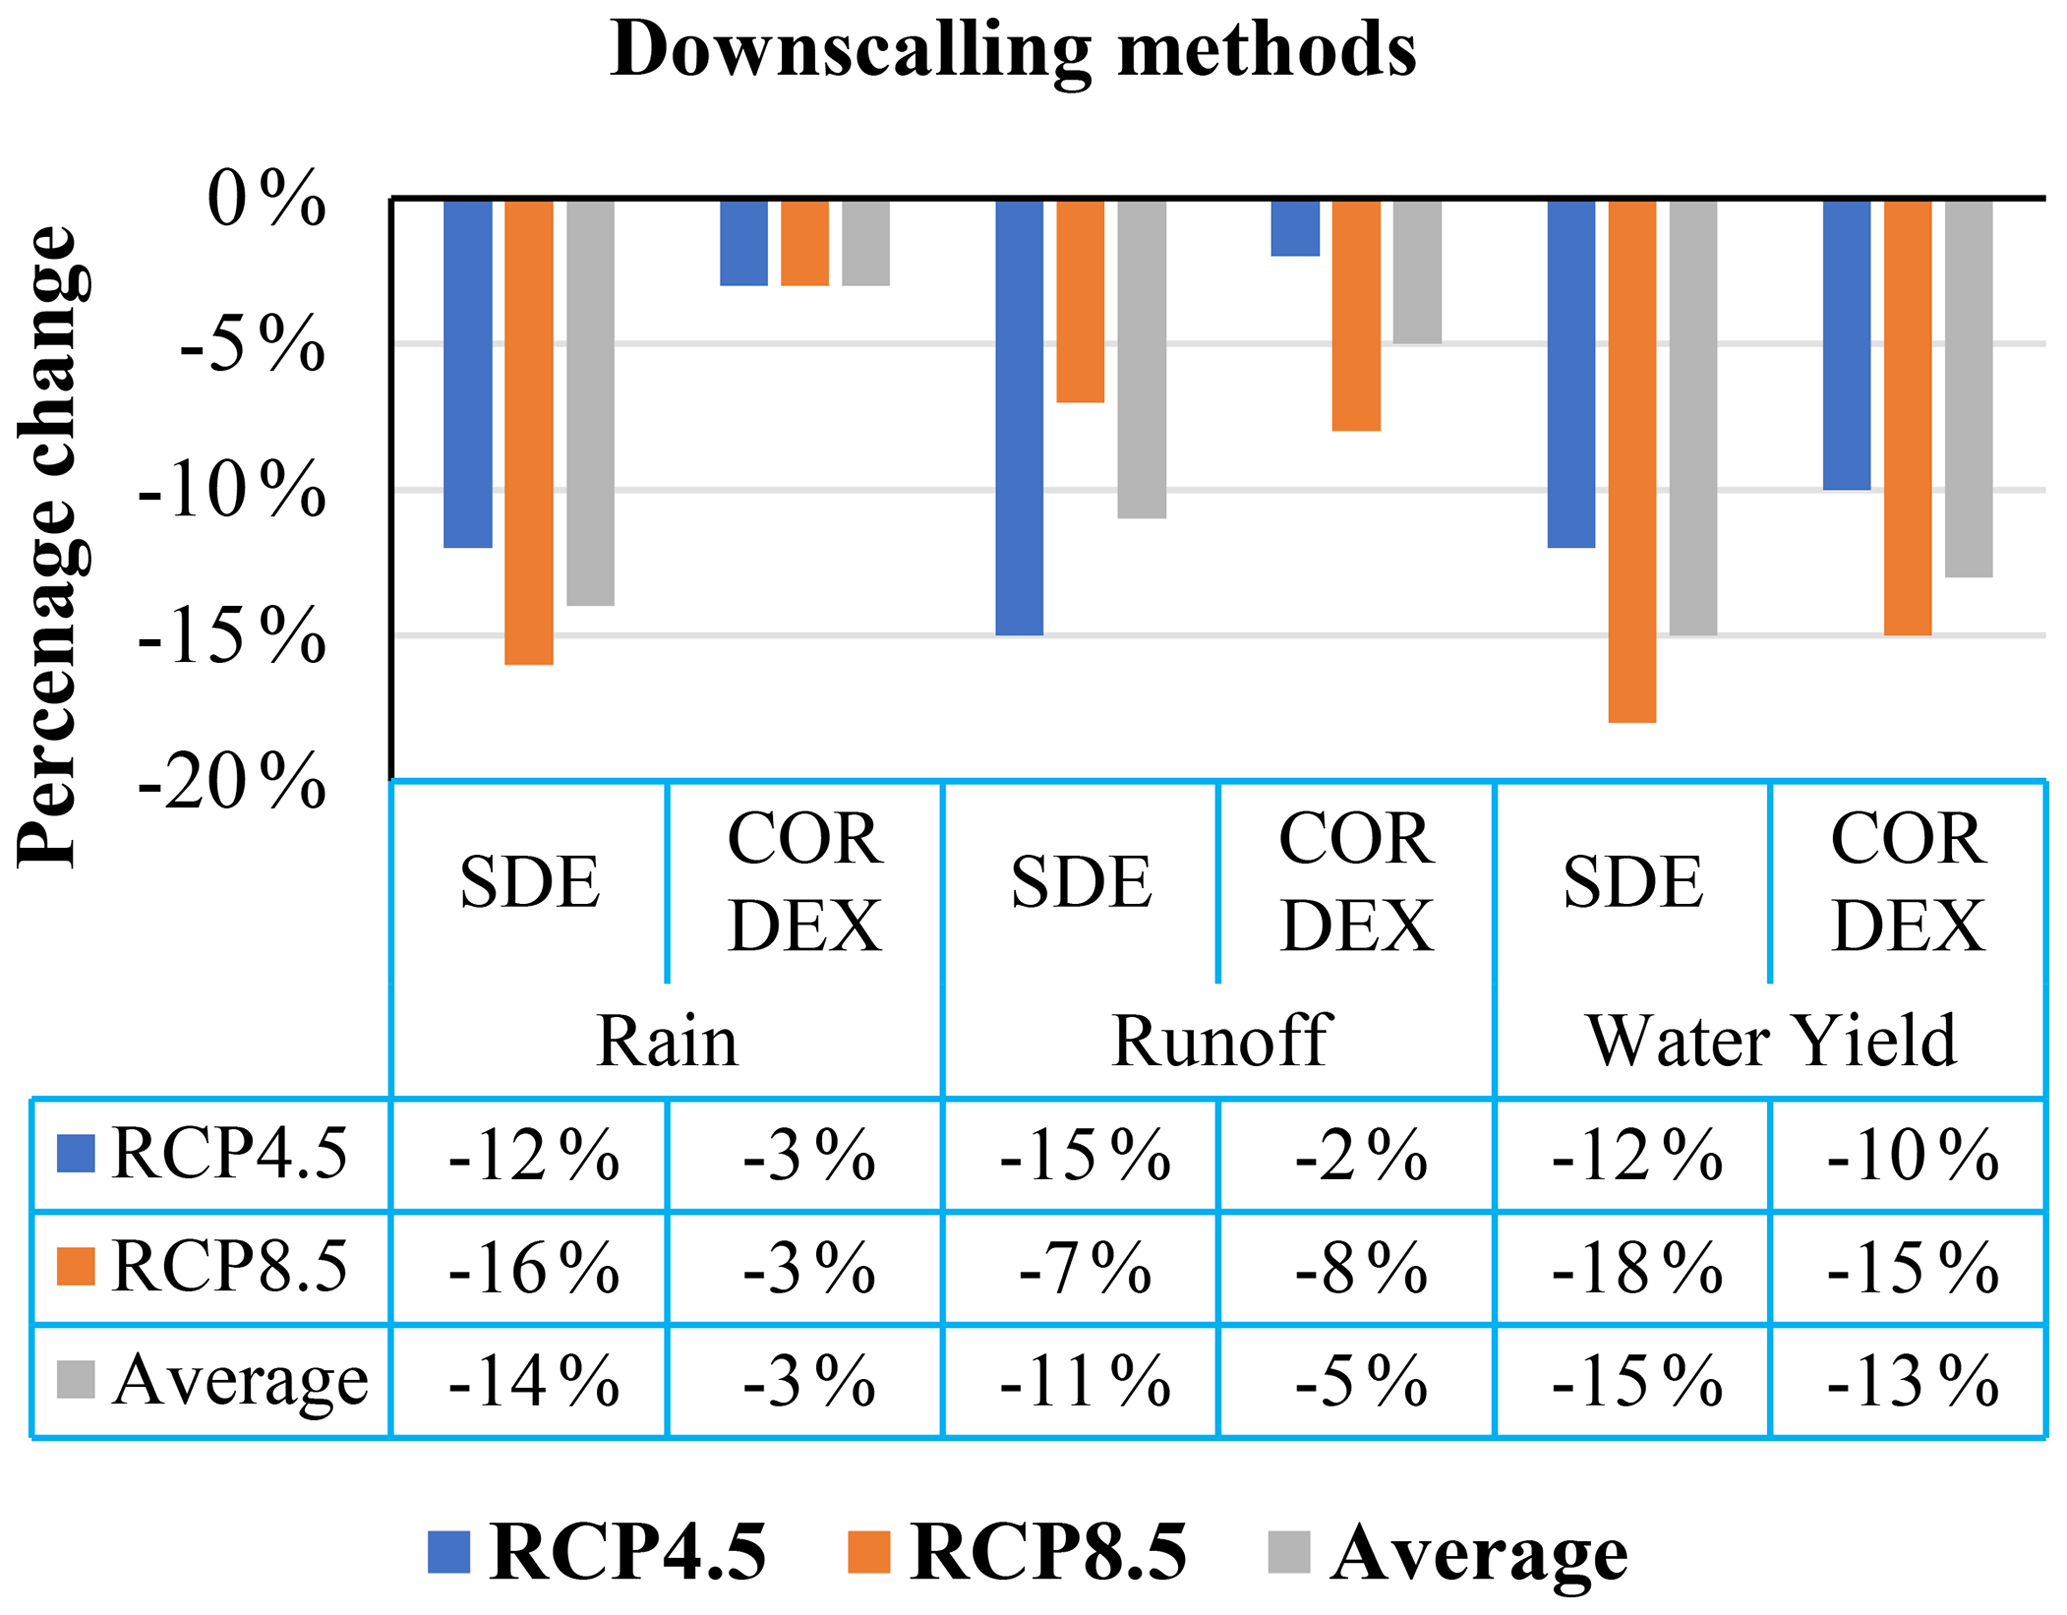
Rapid population increase, industrialization and pollution are putting a strain on available and diminishing freshwater resources. Recent climate projections suggest a drop of up to 10 % in precipitation in most of Southern Africa by 2050. The main aim of this paper is to assess the impact of climate change on water resources in a semi-arid river basin in South Africa using two downscaling approaches: statistical downscaling (SDE) and dynamic downscaling (CORDEX) approaches. Both SDE and CORDEX data were derived from the GCM simulations of the Coupled Model Inter-comparison Project Phase-5 (CMIP5) and across two greenhouse gas emission scenarios known as Representative Concentration Pathways (RCP) 4.5 and 8.5 with a spatial resolution 25 km × 25 km for SDE and 50 km × 50 km for CORDEX. Four GCM models were used for both approaches. SWAT hydrological model was run using these data for a period of 2020 to 2050. Varied results were obtained depending on the type of climate model used, but generally, the trends were similar in most cases. For SDE approach, the multi-model average showed a possible decrease in precipitation (by 14 %), a decrease in water yield (by 15 %) and an increase in potential evapotranspiration (by 10 %). For CORDEX data, the multi-model average showed a possible decrease in precipitation (up to −3 %), a decrease in water yield (up to −13 %) and an increase in potential evapotranspiration (ET) (up to +22 %). The latter is indicative of possible drought spells between rainy events. The SDE approach showed much more pronounced decrease of precipitation and water yield compared to the CORDEX approach. This difference could be attributed to the difference in spatial resolution of the two downscaling approaches. However, it is expected that the results of this study could assist in policy formulation to mitigate the negative impact of climate change in the region.