the Creative Commons Attribution 4.0 License.
the Creative Commons Attribution 4.0 License.
 | 18 Apr 2024
Regional multi-objective calibration for distributed hydrological modelling: a decision tree based approach
Alberto Viglione
Jost von Hardenberg
Larisa Tarasova
Stefano Basso
Ralf Merz
Juraj Parajka
Large scale modelling is becoming increasingly important in hydrology, particularly to characterize and quantify changes in the hydrological regime, whose drivers are typically large-scale phenomena, up to the global scale (e.g., climate change). This can be done with distributed models by estimating spatially consistent model parameters i.e. parameters having a functional relationship with catchment characteristics. In this study we adopt the newly developed PArameter Set Shuffling (PASS) approach, based on a machine learning decision tree algorithm, for the regional calibration of the TUWmodel over North-Western Italy. The method exploits observed patterns of locally calibrated parameters and catchment (climatic and geomorphological) descriptors, to derive functional relationships between the variables. The calibration procedure is performed by including snow cover information, as captured by MODIS datasets, in the model efficiency function. The results show that the PASS regionalization procedure allows to obtain very good regional model efficiencies, without significant loss of performance when moving from training to test catchments and from calibration to verification period, confirming the robustness of the methodology. We also highlight that using snow information in the calibration procedure is helpful to obtain spatially consistent model parameters for this study area. In the spirit of “obtaining good results for the right reasons”, this should be a preferred approach when performing the regional calibration of distributed hydrologic models over mountainous regions.
- Article
(6038 KB) - Full-text XML
- BibTeX
- EndNote


UPH 19; distributed hydrological modelling; parameter regionalization
One of the main challenges of hydrological modelling at the large scale is the estimation of spatially distributed model parameters, which are consistent with climatic and geomorphologic features of the territory, according to a process-based approach (Archfield et al., 2015; Clark et al., 2016; Gupta et al., 2014; Mizukami et al., 2017; Paniconi and Putti, 2015). The goal is to obtain parameter sets for each gridded element or hydrologic unit having the same functional relationship with climatic and geomorphological variables. Many studies dealt with parameters regionalization techniques, in particular within the context of runoff prediction in ungauged basins (e.g., Blöschl et al., 2013; Merz and Blöschl, 2004; Parajka et al., 2013; Seibert, 1999; Troch et al., 2003). An innovative approach was introduced by Merz et al. (2020), with the idea of using machine learning based algorithms to derive relationships between locally calibrated parameters and catchment descriptors, in order to predict parameters in a spatially distributed mode. The procedure, called PArameter Set Shuffling (PASS), provides good results for plain areas like Germany but, so far, it has not found application in other regions. This work presents the PASS approach in a more complex environment like the Alpine Region, by integrating snow information in the regionalization procedure.
Data from the stream gauge network managed by the environmental protection agency of the Piemonte Region, in North-Western Italy, are used (Streamflow data, https://www.arpa.piemonte.it/rischinaturali/accesso-ai-dati/annali_meteoidrologici/annali-meteo-idro/banca-dati-idrologica.html, last access: 31 January 2023). The study area is characterized by a range of topographical elevations and a temperate continental climate, but conditions are not uniform in space. In the Alps, a tendency towards more humid conditions prevails, while the central area is characterized by lower annual precipitation and higher temperatures.
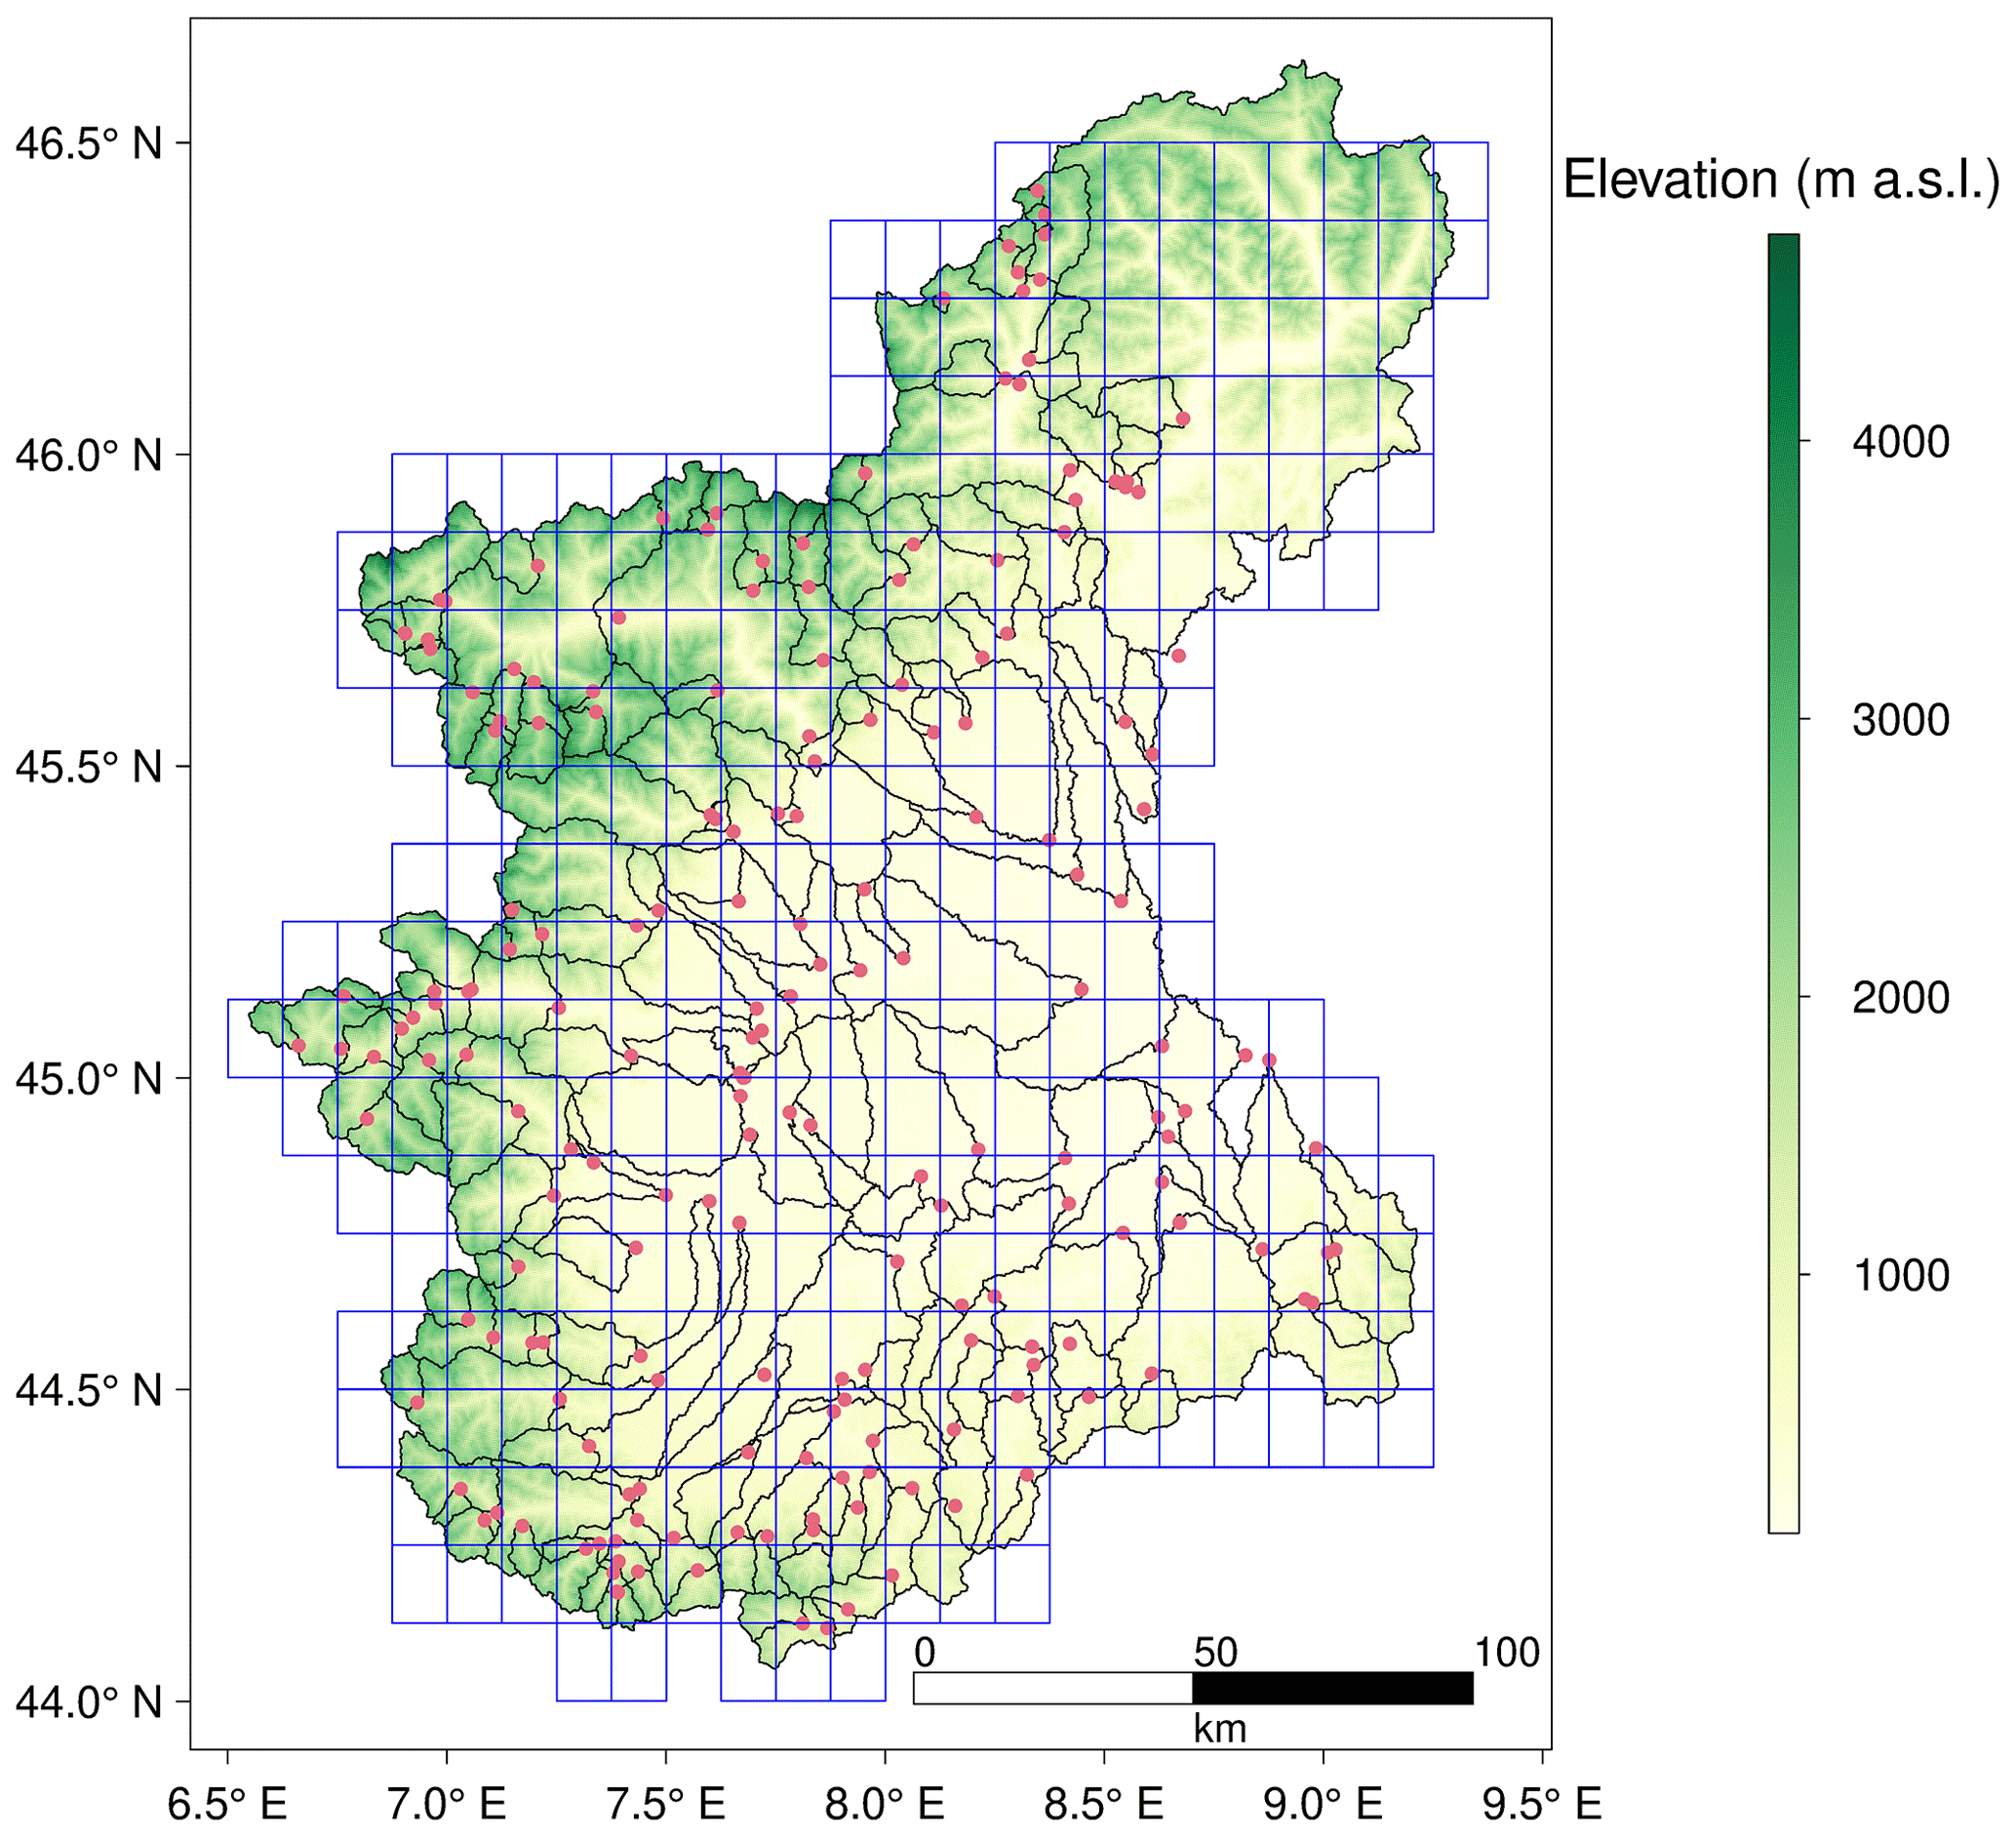
Figure 1Stream gauges (red points), catchments boundaries (black lines) and pixels with meteorological inputs (blue cells) over Piemonte and Valle d'Aosta. The background represents mean elevation (m a.s.l.).
Precipitation [mm] and mean air temperature [°C] data are provided by a gridded dataset, obtained by interpolation of daily observations. These observations are taken from a dense network of meteorological stations and cover the period from 1957 up to the present day (Optimal Interpolation (OI) Dataset, http://www.arpa.piemonte.it/rischinaturali/tematismi/clima/confronti-storici/dati/dati.html, last access: 31 January 2023; Arpa Piemonte). The study domain consists in total of 305 pixels of size 0.125° × 0.125° (Fig. 1). Temperature data are used for the calculation of the potential evapotranspiration, by using the Blaney-Criddle equation based on the FAO procedure. A digital elevation model (DEM) at 90 m resolution (Digital elevation model, http://www.earthenv.org/, last access: 31 January 2023) and catchment boundaries for 197 catchments are also considered. Snow cover is mapped by combining MODIS products from Terra (MOD10A1) and Aqua (MYD10AQ) satellites, and in particular daily maps of the Normalized Difference Snow Index (NDSI) at 500 m spatial resolution. NDSI values larger than 40 are identified as snow. The combination is performed to reduce the effect of clouds; pixels which are classified as clouds or missing in Terra (NDSI > 100), are replaced by pixels from Aqua if these are classified as snow covered or snow free. The percentage of snow pixels in each grid cell of Fig. 1 is counted and the value is retained if the percentage of clouds is lower than 60 %. In this study, 79 catchment descriptors are used to infer regionalization rules, divided into 5 categories: climate (precipitation and temperature) statistics, calculated from the OI dataset; the 27 ETCCDI indices (http://etccdi.pacificclimate.org/list_27_indices.shtml, last access: 31 January 2023); morphological descriptors obtained from the digital elevation model (referred to elevation, slope and aspect); land-use classes derived from the Corine Land Cover dataset (2018) and a series of soil characteristics, obtained from the Harmonized World Soil Database.
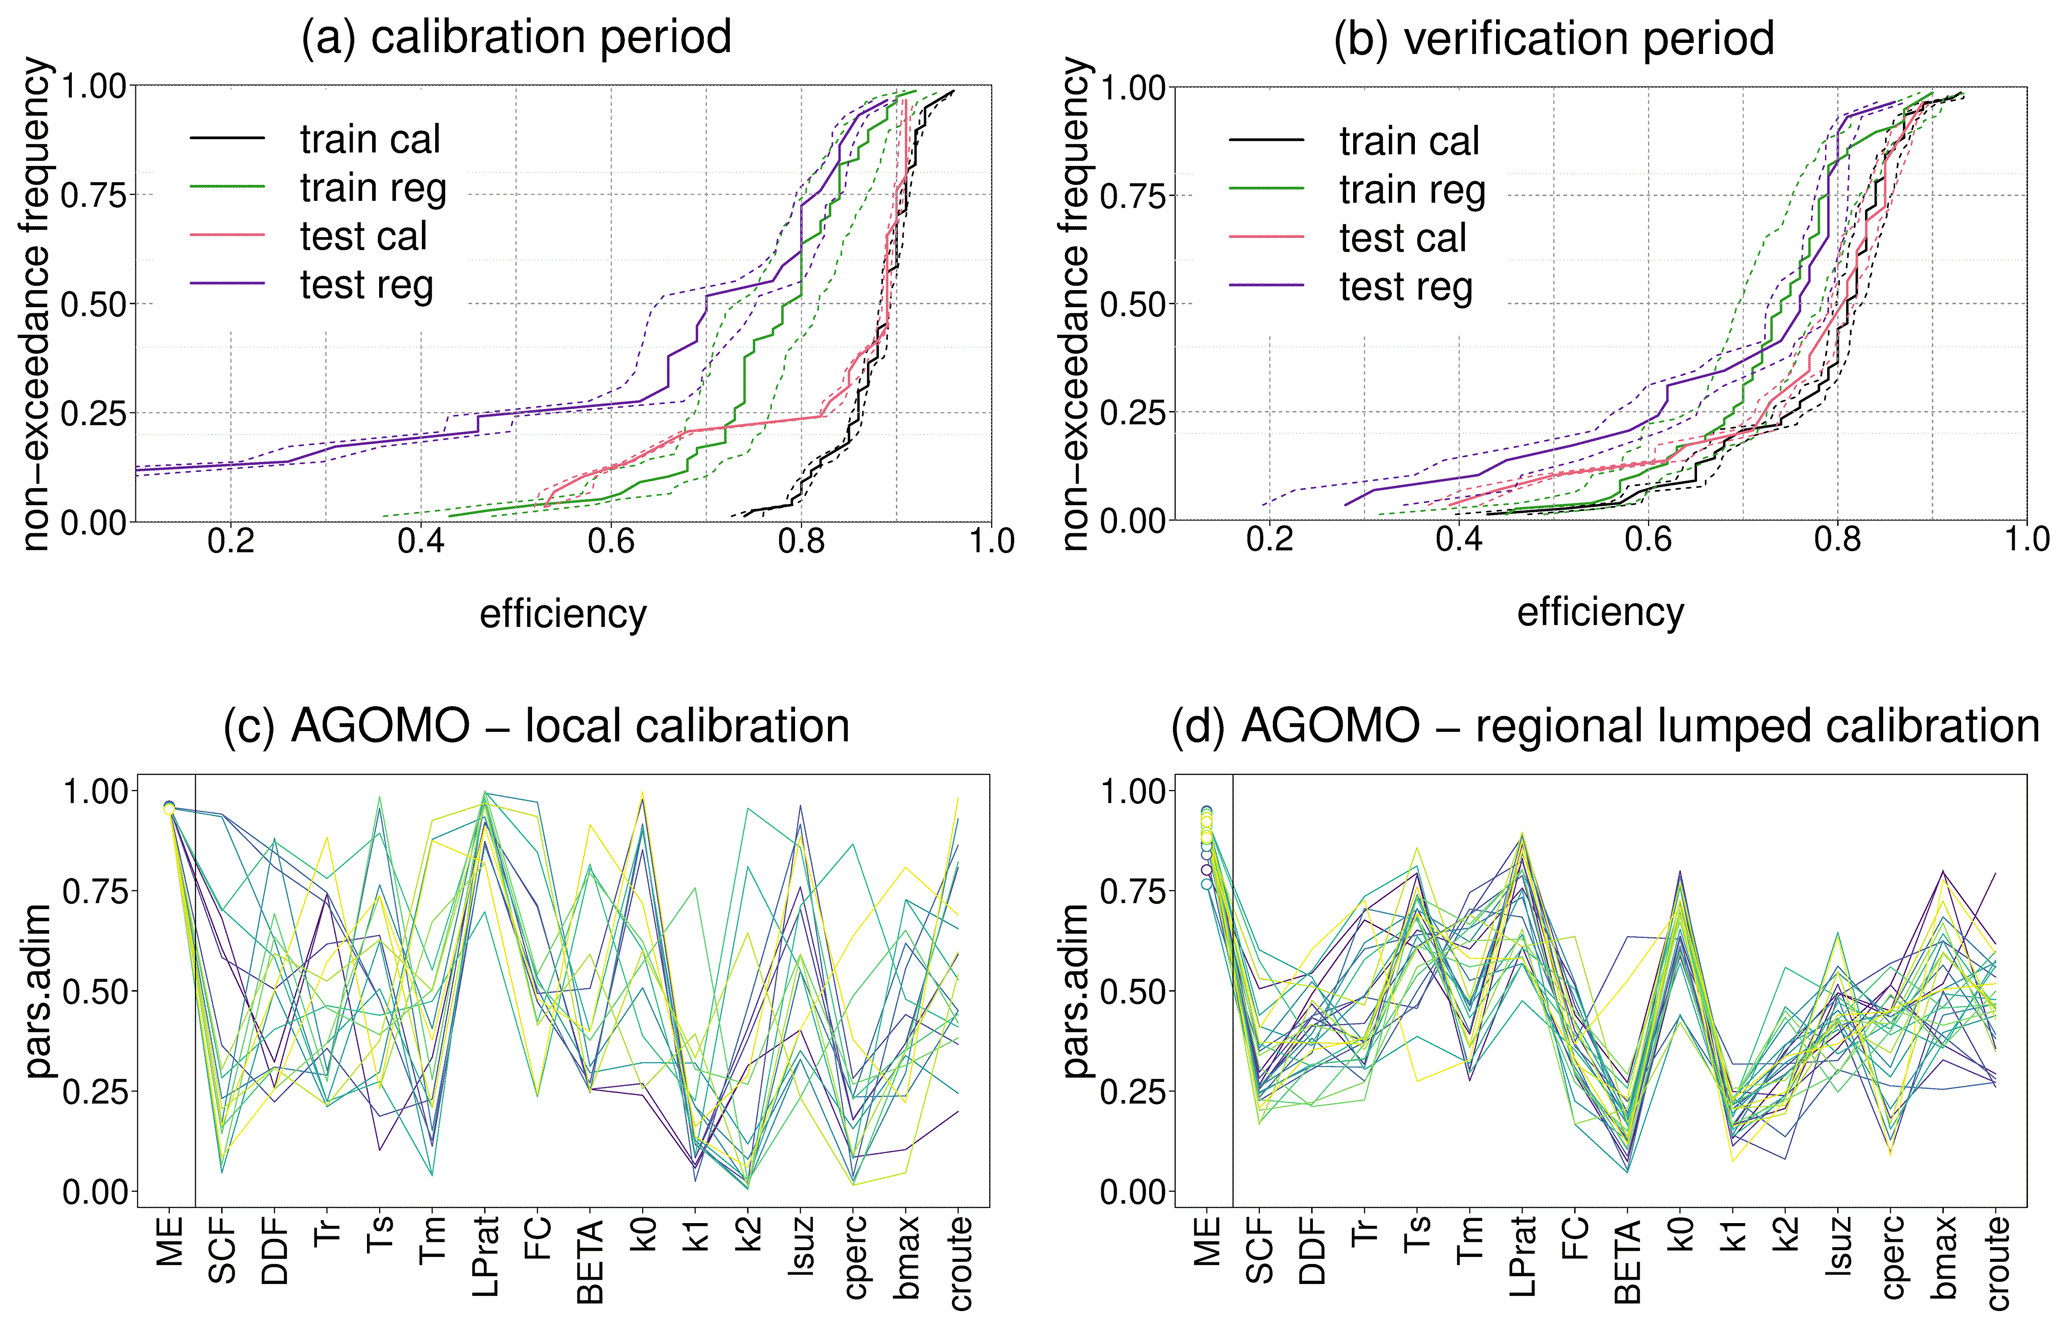
Figure 2(a) Non exceedance cumulative distribution function of model efficiencies (ME = 0.5 ⋅ KGE + 0.5 ⋅ SC) during the calibration period: “train_cal” shows MEs obtained by using locally calibrated lumped parameters for 76 training catchments, “test_cal” shows MEs obtained by using locally calibrated lumped parameters for 28 test catchments, “train_reg” shows MEs obtained by running the model with predicted distributed parameters for 76 training catchments, “test_reg” shows MEs obtained by running the model with predicted distributed parameters for 28 test catchments. (b) Non exceedance cumulative distribution function of model efficiencies (ME = 0.5 ⋅ KGE + 0.5 ⋅ SC) during the verification period. The continuous lines represent the mean model efficiency, while the dashed lines represent the 10th and 90th percentiles of model efficiencies for 30 parameter sets. (c) 30 normalized parameter sets found by local calibration for the Agogna river catchment at Momo, North-Western Italy. (d) 30 normalized parameter sets found by regional calibration for the Agogna river catchment at Momo, North-Western Italy.
The relationship between catchment descriptors and model parameters is established using decision trees (rpart R function). The PASS procedure is applied together with the TUWmodel (Appendix of Parajka et al., 2007), which follows the structure of the HBV model (Bergström, 1995). The algorithm used for local calibration is the differential evolution (DEoptim R package), which implements the global optimization of a real-valued function of a real-valued parameter vector (Mullen et al., 2011). We consider as model efficiency function the arithmetic average of two quantities:
-
the Kling-Gupta Efficiency (KGE) for discharge:
where r is the linear correlation coefficient between observed and simulated discharge, is the ratio between the coefficients of variation of simulated and observed discharges, is the ratio between the means of simulated and observed discharges.
-
a Snow Cover Efficiency, which is given by the following formula:
where N is the number of days, n is the number of cells, SCsim is 1 if the simulated snow water equivalent (SWE) exceeds 1 mm and 0 otherwise, and SCobs is 1 if the % of snow pixels within the cell is greater than 10 % and 0 otherwise.
The model efficiency is so defined:
From the entire database, only stations having discharge data over the period 2000–2020 are considered for the analysis (104 stations). We split the timeseries into a calibration period (2010–2020) and a verification period (2000–2010). We perform the local calibration over the 104 catchments; from this set, only catchments with at least 5 parameter sets having local model efficiency (ME) > 0.75 and having a catchment area < 1000 km2 are used for the training of PASS, following the assumptions of the method (Merz et al., 2020). These are the so called training catchments. For these sites, the best 30 parameter sets are used for running the regionalization. The remaining catchments, called test catchments, are instead used for validation.
The results for the calibration period (2010–2020) and the verification period (2000–2010) are shown in Fig. 2a and b. Considering the calibration period, while the medians of the mean performances of training and test catchments in local calibration (“train cal” and “test cal”, respectively) are almost identical, applying the regionalization procedure, the median of MEs of regionally predicted distributed parameters sets for the training catchments (“train reg”) is 0.785, and the median regional efficiency for the test catchments (“test reg”) is 0.700.
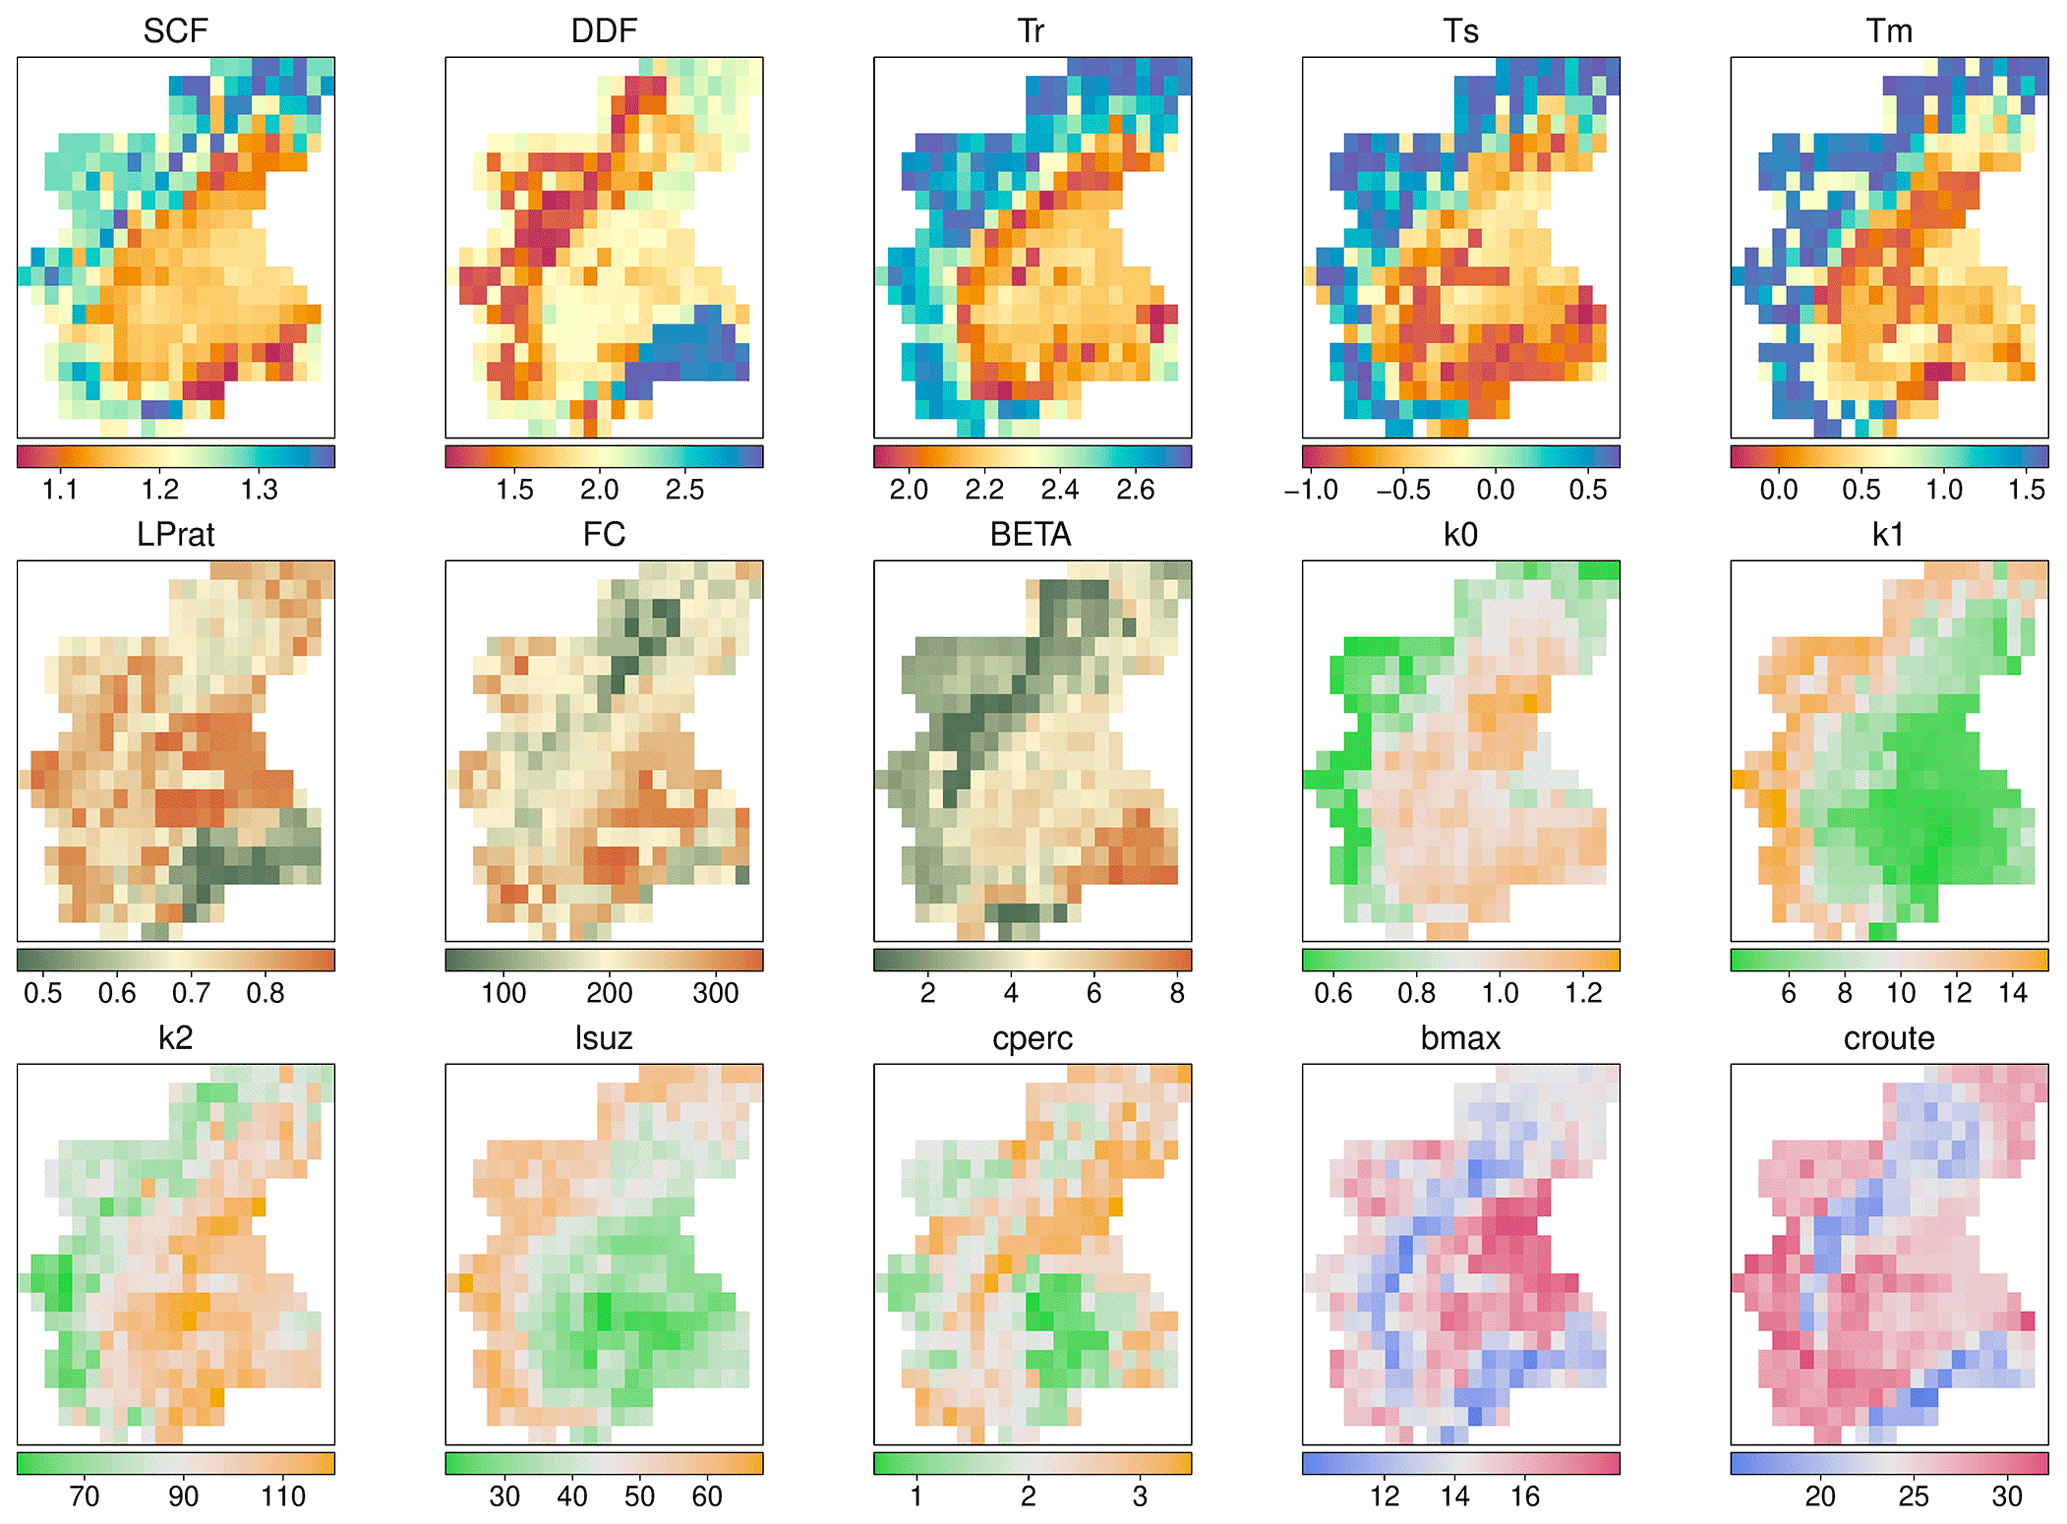
Figure 3Regional maps of distributed TUWmodel parameters obtained with PASS. The color indicates the mean value of the parameter among 30 regionalizations.
When moving to the verification period (2000–2010), the local model efficiencies have a substantial decrease. The median of regionally distributed MEs for training catchments decreases from 0.785 to 0.740, while the median of regionally distributed MEs for test catchments increases from 0.700 to 0.760. In general, we observe that the medians of regional MEs for training and test catchments are very close and the regional performance is not significantly degraded when moving from the calibration to the verification period. This confirms the robustness of the methodology in parameter estimation across spatial and temporal scales. In Fig. 2c and d, examples of normalized locally calibrated and regionally lumped calibrated parameter sets for the Agogna River at Momo are shown. Parameters found by regional calibration show a much smaller spread compared to locally calibrated parameters. As found in Merz et al. (2020), also for this Italian dataset regionalization reduces the effect of parameter equifinality.
Observing the maps of distributed model parameters, they appear to be highly consistent with the climatic and geomorphological features of the region; in particular snow parameters (SCF, DDF, Tr, Ts, Tm) seem to be in accordance with the three different geographical areas which characterize the region: the Alpine range on the West and North, the Apennines on the South and the Po River Valley (Fig. 3).
The results of this study indicate that the PASS procedure can be efficiently applied over the Alpine Region, with satisfactory results, also by taking advantage of snow cover information for the calibration and validation of the model. The model efficiencies for train catchments don't decrease significantly when moving from calibration to the verification period and actually for test catchments an increase is observed. This confirms the robustness of the procedure in the parameter estimation over different spatial and temporal domains. Overall, the results for this study area are in line with what has already been found in Merz et al. (2020). The spatial distribution of the parameters is consistent with the climatic and geomorphological characteristics of the region and this confirms that parameters are controlled by these variables. Following a process-based approach, the use of snow information can be crucial for a good model representation of the processes. This will allow to get “right results for the right reasons”, which is of particular importance in hydrology, especially for large-scale distributed modelling studies which require ungauged streamflow prediction.
Precipitation, temperature and daily discharge data are freely available on the ARPA Piemonte website (see Sect. 2 for further information). The other types of data can be provided by the corresponding author upon request.
LT, SB and RM provided suggestions for organizing the code and data; JP and RT prepared the snow data; AV and MP worked on the data; MP wrote the manuscript draft; AV, JvH and LT reviewed and edited the manuscript.
The contact author has declared that none of the authors has any competing interests.
Publisher’s note: Copernicus Publications remains neutral with regard to jurisdictional claims in published maps and institutional affiliations.
This article is part of the special issue “IAHS2022 – Hydrological sciences in the Anthropocene: Variability and change across space, time, extremes, and interfaces”. It is a result of the XIth Scientific Assembly of the International Association of Hydrological Sciences (IAHS 2022), Montpellier, France, 29 May–3 June 2022.
We would like to thank the Environmental Agency of Piemonte Region (ARPA Piemonte), in particular the Department of Forecasting Systems and the Department of Natural and Environmental Risks, for providing data used in this study.
This paper was edited by Christophe Cudennec and reviewed by two anonymous referees.
Archfield, S. A., Clark, M., Arheimer, B., Hay, L. E., McMillan, H., Kiang, J. E., Seibert, J., Hakala, K., Bock, A., Wagener, T., Farmer, W. H., Andreassian, V., Attinger, S., Viglione, A., Knight, R., Markstrom, S., and Over, T.: Accelerating advances in continental domain hydrologic modeling, Water Resour. Res., 51, 10078–10091, https://doi.org/10.1002/2015WR017498, 2015.
Bergström, S.: The HBV model, Computer Models of Watershed Hydrology, edited by: Singh, V. P., Water Resources Publications, Highlands Ranch, Colorado, 443–476, ISBN 9781887201742, 1995.
Blöschl, G., Sivapalan, M., Wagener, T., Savenije, H., and Viglione, A. (Eds.): Runoff prediction in ungauged basins: synthesis across processes, places and scales, Cambridge University Press, 484 pp., ISBN 9781107028180, 2013
Clark, M. P., Schaefli, B., Schymanski, S. J., Samaniego, L., Luce, C. H., Jackson, B. M., Freer, J. E., Arnold, J. R., Moore, R. D., Istanbulluoglu, E., and Ceola, S.: Improving the theoretical underpinnings of process-based hydrologic models, Water Resour. Res., 52, 2350–2365, https://doi.org/10.1002/2015WR017910, 2016.
Gupta, H. V., Perrin, C., Blöschl, G., Montanari, A., Kumar, R., Clark, M., and Andréassian, V.: Large-sample hydrology: a need to balance depth with breadth, Hydrol. Earth Syst. Sci., 18, 463–477, https://doi.org/10.5194/hess-18-463-2014, 2014.
Merz, R. and Blöschl, G.: Regionalisation of catchment model parameters, J. Hydrol., 287, 95–123, https://doi.org/10.1016/j.jhydrol.2003.09.028, 2004.
Merz, R., Tarasova, L., and Basso, S.: Parameter's Controls of Distributed Catchment Models – How Much Information is in Conventional Catchment Descriptors?, Water Resour. Res., 56, e2019WR026008, https://doi.org/10.1029/2019WR026008, 2020.
Mizukami, N., Clark, M. P., Newman, A. J., Wood, A. W., Gutmann, E. D., Nijssen, B., Rakovec, O., and Samaniego, L.: Towards seamless large-domain parameter estimation for hydrologic models, Water Resour. Res., 53, 8020–8040, https://doi.org/10.1002/2017WR020401, 2017.
Mullen, K., Ardia, D., Gil, D., Windover, D., and Cline, J.: DEoptim: an R package for global optimization by differential evolution, J. Stat. Softw., 40, 1–26, https://doi.org/10.18637/jss.v040.i06, 2011.
Paniconi, C. and Putti, M.: Physically based modeling in catchment hydrology at 50: Survey and outlook, Water Resour. Res., 51, 7090–7129, https://doi.org/10.1002/2015WR017780, 2015.
Parajka, J., Merz, R., and Blöschl, G.: Uncertainty and multiple objective calibration in regional water balance modelling: case study in 320 Austrian catchments, Hydrol. Process., 21, 435–446, https://doi.org/10.1002/hyp.6253, 2007.
Parajka, J., Viglione, A., Rogger, M., Salinas, J. L., Sivapalan, M., and Blöschl, G.: Comparative assessment of predictions in ungauged basins – Part 1: Runoff-hydrograph studies, Hydrol. Earth Syst. Sci., 17, 1783–1795, https://doi.org/10.5194/hess-17-1783-2013, 2013.
Seibert, J.: Regionalisation of parameters for a conceptual rainfall-runoff model, Agr. Forest Meteorol., 98, 279–293, https://doi.org/10.1016/S0168-1923(99)00105-7, 1999.
Troch, P. A., Paniconi, C., and van Loon, E. E.: Hillslope-storage Boussinesq model for subsurface flow and variable source areas along complex hillslopes: 1. Formulation and characteristic response, Water Resour. Res., 39, 1316, https://doi.org/10.1029/2002WR001728, 2003.