the Creative Commons Attribution 4.0 License.
the Creative Commons Attribution 4.0 License.
 | 19 Apr 2024
How can altimetry data be used for water resources management (SDG 6.5.1)? Development of a method using altimetry data from the Envisat, Jason, Jason 2 and Sentinel 3A satellites
Thomas Legay
Yoann Aubert
Julien Verdonck
Jérémy Guilhen
Adrien Paris
Jean-Michel Martinez
Sabine Sauvage
Pankyes Datok
Vanessa Dos Santos
José Miquel Sanchez-Perez
Stéphane Bruxelles
Emeric Lavergne
Franck Mercier
Water resources management relies on the use of hydrometric data collected mainly from in situ stations. Despite the efforts made in setting up and maintaining a network of hydrometric and meteorological stations, water resource managers face many problems, such as equipment degradation during floods, incidents of vandalism and issues related to inaccessibility. Satellite data can improve water resources monitoring, regardless of its objectives (strategic management of water resources, management of structures, forecasting of floods and low flows, etc.). These data have the advantage of covering the entire world at regular intervals, including difficult-to-access areas. Through several projects, various scientific and industrial partners (IRD, CNES, CLS, CNRS, CENEAU, etc.) have contributed to assess and enhance the use of satellite data for the management of water resources at the scale of a catchment (e.g. the Amazon) or a territory (Uganda). The objective is to deliver a method based on the combination of hydrological models, in-situ data and satellite data. This article presents the current possibilities and limitations of using satellite data to optimize the monitoring of water resources.
- Article
(3395 KB) - Full-text XML
- BibTeX
- EndNote


Coupling; spatial altimetry; hydrological modelling; GR5J; regionalization of parameters; comparison
The management of water resources, at local and regional scales, requires the use of hydrometric and meteorological data. These data usually come from in situ stations, whose location on a hydrographic network conditions the knowledge of flows. Despite the efforts made to set up and maintain a network of stations, water resource managers face numerous problems:
-
The location of the stations is not systematically optimal, especially in southern countries (geopolitical context, access difficulties, etc.);
-
The number of functional stations is insufficient, especially in the southern countries;
-
Data are not available for a period of time that is long enough to analyze the historical context and understand the impacts of climate change.
Therefore, in situ hydrometric data alone are often insufficient for the design of hydraulic structures (for extreme events management) or the management of water resources (Vörösmarty et al., 2001).
Regarding in situ meteorological data, they are often too few, both historically and spatially, which limits their use (e.g. construction of a spatial rainfall, frequency analysis) (Lebel et al., 1997; Li and Heap, 2008).
Over the past two decades, two areas of spatial applications, particularly important for hydrology have been developed:
-
Spatial altimetry: satellites equipped with altimeters are commonly used to measure the height of the world's water bodies and/or rivers (from the precursor Geosat, through Topex/Poseidon, ENVISAT, Saral/AltiKa, Jason 2 to Jason-3, Sentinel 3A and 3B, and even the future SWOT mission, etc.) (Paris, 2015);
-
Spatial meteorology: various research centers are working on integrating satellite information, producing spatialized data (rainfall, ETP, temperature) and comparing them with in situ data (Satge et al., 2019).
At the same time, the field of hydrology is expanding and developing many tools for analysis, geostatistical processing and modeling. These tools can be used to generate information at variable spatial resolutions (pixel of 1 km2 to several hundred km2) and temporal resolutions (from 30 min to a month), even in regions without measurements.
The combination of spatial data with in situ data and hydrological tools can partially address the instrumentation problem (Paiva et al., 2013; Paris et al., 2016; Garambois et al., 2017; Bogning et al., 2018; Huang et al., 2020; Andriambeloson et al., 2020). The consortium composed of CLS, IRD, BRL Ingénierie, CENEAU, and CNRS developed an approach mixing altimetry, in situ data, and modeling in two projects:
-
The HydroSim project studies the Amazon catchment; it is funded by the Occitanie region (France) and led by CLS (France);
-
The SmartBasin project focuses on the Ugandan hydrographic network; it is financed by the General Directorate of the Public Treasury (France) and led by BRL Ingénierie
2.1 Objectives
The objective of the HydroSim and SmartBasin projects is to develop a method for integrating and exploiting spatial data, in particular altimeter data, for the management and monitoring of water resources. This method is based on a combination of spatial data, in situ data and hydrological modeling tools. The objective of this manuscript is to evaluate the relevance of altimetry data for watercourse monitoring and to evaluate the method developed to integrate them into the management and monitoring of water resources.
2.2 Method
2.2.1 General approach
Satellites equipped with an altimeter can measure the water level of a river. Like any satellite, they are characterized by:
-
Their orbit: the trajectory of the satellite around the Earth is fixed;
-
Their frequency of passage over the same point: depending on the satellite, it varies from a few days (7 d) to over a month.
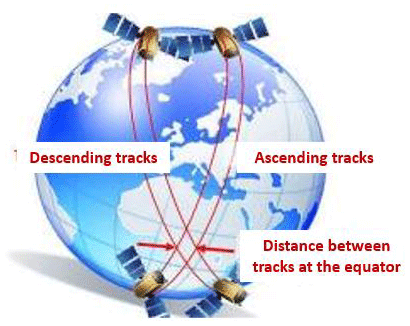
Figure 1Trajectory of a satellite around the globe. Notions of tracks and inter-tracks.
The ground track of a satellite is the projection of its orbit on the Earth's surface.
The satellites measure the water level of a river at the intersection between the ground track and the river. Those sites are called virtual stations. The virtual stations can be located on watercourses, or sections of watercourses where no information is available.
The approach consists of complementing water level data measured by satellites with flow data. This enables the construction of virtual rating curves, i.e., a relation between the water level measured by the satellite and the flow of the river. Flow data is generated using in situ hydrometric data and hydrological modeling tools. The method is as follows:
-
Identification of virtual stations
Over the study area, this step aims to identify the sites where satellites equipped with altimeters correctly measure the water height.
-
Modeling of a flow chronicle at the location of the virtual stations
This step aims to model the flow at the virtual stations.
This step relies on:
-
The collection and analysis of hydrometric and meteorological in situ data,
-
The calibration of a rainfall-runoff model at the hydrometric stations (the criteria used for calibration is the Kling Gupta Efficiency (Gupta et al., 2009)),
-
The flow modelling at the virtual stations,
-
-
Comparison of modeled flows with spatial altimetry data
This step aims to relate model flow with water levels measured by spatial altimetry. It allows virtual rating curves to be built.
-
Verification of the modeled flows at the virtual stations
This step consists in calculating the flow using the altimeter data and the associated virtual rating curve, then verifying that the modeled flow is consistent with the closest in situ data.
This methodology is frequently used in the scientific community and is proven to be useful for satellite monitoring of many basins around the world (Paris, et al., 2016; Bogning, et al., 2020; Andriambeloson et al., 2020). It is also the source of the deployment of free altimetry flow estimates on the Theia/Hydroweb website (http://hydroweb.theia-land.fr/, last access: 20 June 2019).
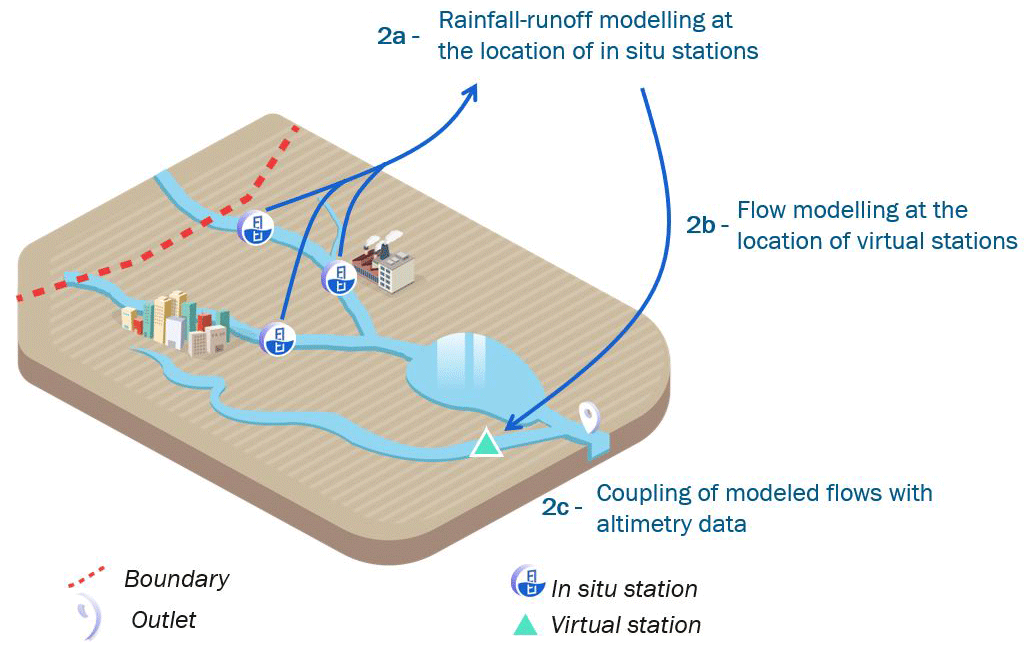
Figure 2Diagram of the general approach applied for the modelling of the flow at the virtual stations (BRL Ingénierie).
2.2.2 Specificity of each project
Each project has its own specificities concerning the data used, the models implemented, the method to simulate the flow at virtual stations and the method of verification of the modelled flows.
Virtual stations
In the scope of the HydroSim project, the virtual stations available on HydroWeb were used. HydroWeb provides data from 981 virtual stations distributed among 3 satellite missions: 97 virtual stations for the Jason and Jason 2 satellite missions, 143 virtual stations for Sentinel-3A and 741 virtual stations for Envisat. The altimetry data used cover a period from September 2002 to June 2019. Depending on the satellite mission, data are available for frequencies of 10 d (Jason and Jason 2), 27 d (Sentinel 3A) and 35 d (Envisat).
For the SmartBasin project, 68 virtual stations have been identified by CLS. 34 virtual stations have been identified for the Jason2/Jason3 constellation and 34 virtual stations have been identified for the Sentinel 3A satellite. The collected data cover the period from July 2008 to February 2019. The frequency of available data is 10 d for Jason and Jason 2 satellites and 27 d for Sentinel 3A. After reanalysis of the data, 39 virtual stations were selected.
In situ data
For the HYDROSIM project, data from more than 1200 rainfall stations were collected from different countries (Brazil, Peru, Bolivia), and from different sources (ANA/IRD, SENAMHI Peru and WMO). For the Smart Basin project, data from 17 stations were collected from the Ministry of Water and Environment of Uganda and from the WMO. After data analysis with the KRITIKOR tool [EDF-DTG], only 413 and 17 rainfall stations were selected as relevant (minimum of 10 years of data, threshold on gaps in series, etc.) respectively over the Amazon basin and the Ugandan hydrographic network.
For the Amazon catchment, flow records were collected from the IRD and their HYBAM database; for Uganda, they were collected from the Ministry of Water and Environment (MoWE). All stations were analyzed and criticized. At the end, 119 hydrometric stations were selected for the Amazon catchment. For Uganda, most of the collected hydrometric data were considered questionable: at the end, only 8 hydrometric stations were selected.
Choice of the rainfall-runoff model
Different classifications of models can be found in literature. One major criteria divide models into:
-
Physically based models, such as SWAT. They represent the processes of the rainfall-runoff relationship using the physical laws governing these processes;
-
Conceptual models, such as GR models (Le Moine, 2008). These models aim to represent the main hydrological processes in a simplified way without resorting to parameterizations of the physical laws that govern them.
Both types of models have advantages and disadvantages. Physically based models, such as SWAT (Arnold et al., 2007), can provide distributed information over the entire study area. Once the hydrological model is calibrated on observed flows at in situ stations (either over an entire catchment, or over parts of the catchment called sub-catchments), the model provides a series of modeled flows over the entire river system including the virtual stations.
The GR5J conceptual model is a global model. This model is used to model the flow of one catchment defined by its outlet. This outlet corresponds to the location of the hydrometric station. Thus, the GR5J model must be calibrated for each hydrometric station. In order to model the flow at the virtual stations, it is necessary to go through a parameter regionalization step.
The following models have been used:
-
HydroSim: CNRS and BRL Ingenierie were in charge of carrying out the flow modelling of the Amazon catchment. CNRS modelled the flow using the SWAT model and BRL Ingenierie used the GR5J model;
-
SmartBasin: the flow modelling work was carried out only by BRL Ingenierie, the flow has been modelled using GR5J.
Flow simulation at the location of the virtual stations
Depending on the rainfall-runoff model used, the method to simulate the flow at the location of the virtual stations differs.
With the SWAT model, as explained previously, once the hydrological model is calibrated on observed flows at in situ stations, the model provides a chronicle of modeled flows over the entire river system including the virtual stations.
With the GR5J model, simulation of the flow at the location of the virtual station implies the use of regionalization of parameters method.
In the context of hydrology, regionalization is defined as a transfer of information from a gauged site where this information is known to an ungauged site where this information is unknown. Here, the ungauged site is the virtual station and the information to be transferred are the parameters of the GR5J model.
The method to simulate the flow at the location of the virtual stations consists in:
-
Calibrating the GR5J model for every hydrometric station,
-
Applying regionalization of parameters methods to calculate the parameters for the catchments of virtual stations.
Different methods are available for regionalizing parameters. A preliminary step consisted in identifying the most robust method. For this, the “leave one out” method was applied with the in situ hydrometric stations. This method is deployed in several stages:
-
We consider all the in-situ stations for which we have calibrated a GR5J model. We remove an in-situ station from this set.
-
We calculate a new set of parameters by regionalization for the excluded station from the parameters of the calibrated models.
-
We simulate the flow of the excluded station. We check the consistency of the simulated flow with the flow observed at this station.
This work is carried out for all the in-situ stations and for all the desired regionalization methods. The selected regionalization method is the one which provides the best simulations of the flow at the in-situ stations. The different regionalization method tested are:
-
Geographical regionalization (Poncelet et al., 2017),
-
Physiographical regionalization (Poncelet et al., 2017),
-
Machine learning methods (Random Forest (Saadi et al., 2019), neuronal network (Riedmiller and Braun, 1993; Intrator and Intrator, 1993; Anastasiadis et al., 2005)).
-
Simulating the flow at the location of the virtual stations using the retained regionalization method and the GR5J model.
Performance of the implemented models
Depending on the project, different verification methods were applied to assess the relevance of the flow modeled at the virtual stations.
For the HydroSim project, a comparison of the flows modeled by the SWAT and GR5J models at the virtual stations was performed.
For the SmartBasin project, no SWAT model was implemented because the CNRS did not take part of the project. The project includes the installation of 3 hydrometric stations at the virtual stations' location. These hydrometric stations will enable the verification processes of the modeled flow (its consistency with the observed flow) and the consistency between the water level measured by the station the one measured by spatial altimetry.
We present hereafter the results obtained for 2 pilot sub-catchments of the Amazon catchment: the Madeira and the Tapajos sub-catchments. These sub-catchments have been modelled with 2 rainfall-runoff models: SWAT and GR5J. In these sub-catchments, 266 virtual stations were studied.
Figure 3 shows an example of correlation between the water level measured by the satellite Jason at virtual station amz-amz-jas-0139-01 and the regionalized flow of the GR model. The good correspondence between water level and discharge enable the construction of a virtual rating curve: a variation in water level measured by spatial altimetry is correlated with a variation in discharge. Here, the correlation coefficient is significant: 0.85. However, Fig. 3 shows a discrepancy between the regression curve and the observed flow. This gap varies between 0 % and 60 % compared to the regression curve, with an average of 37 %.
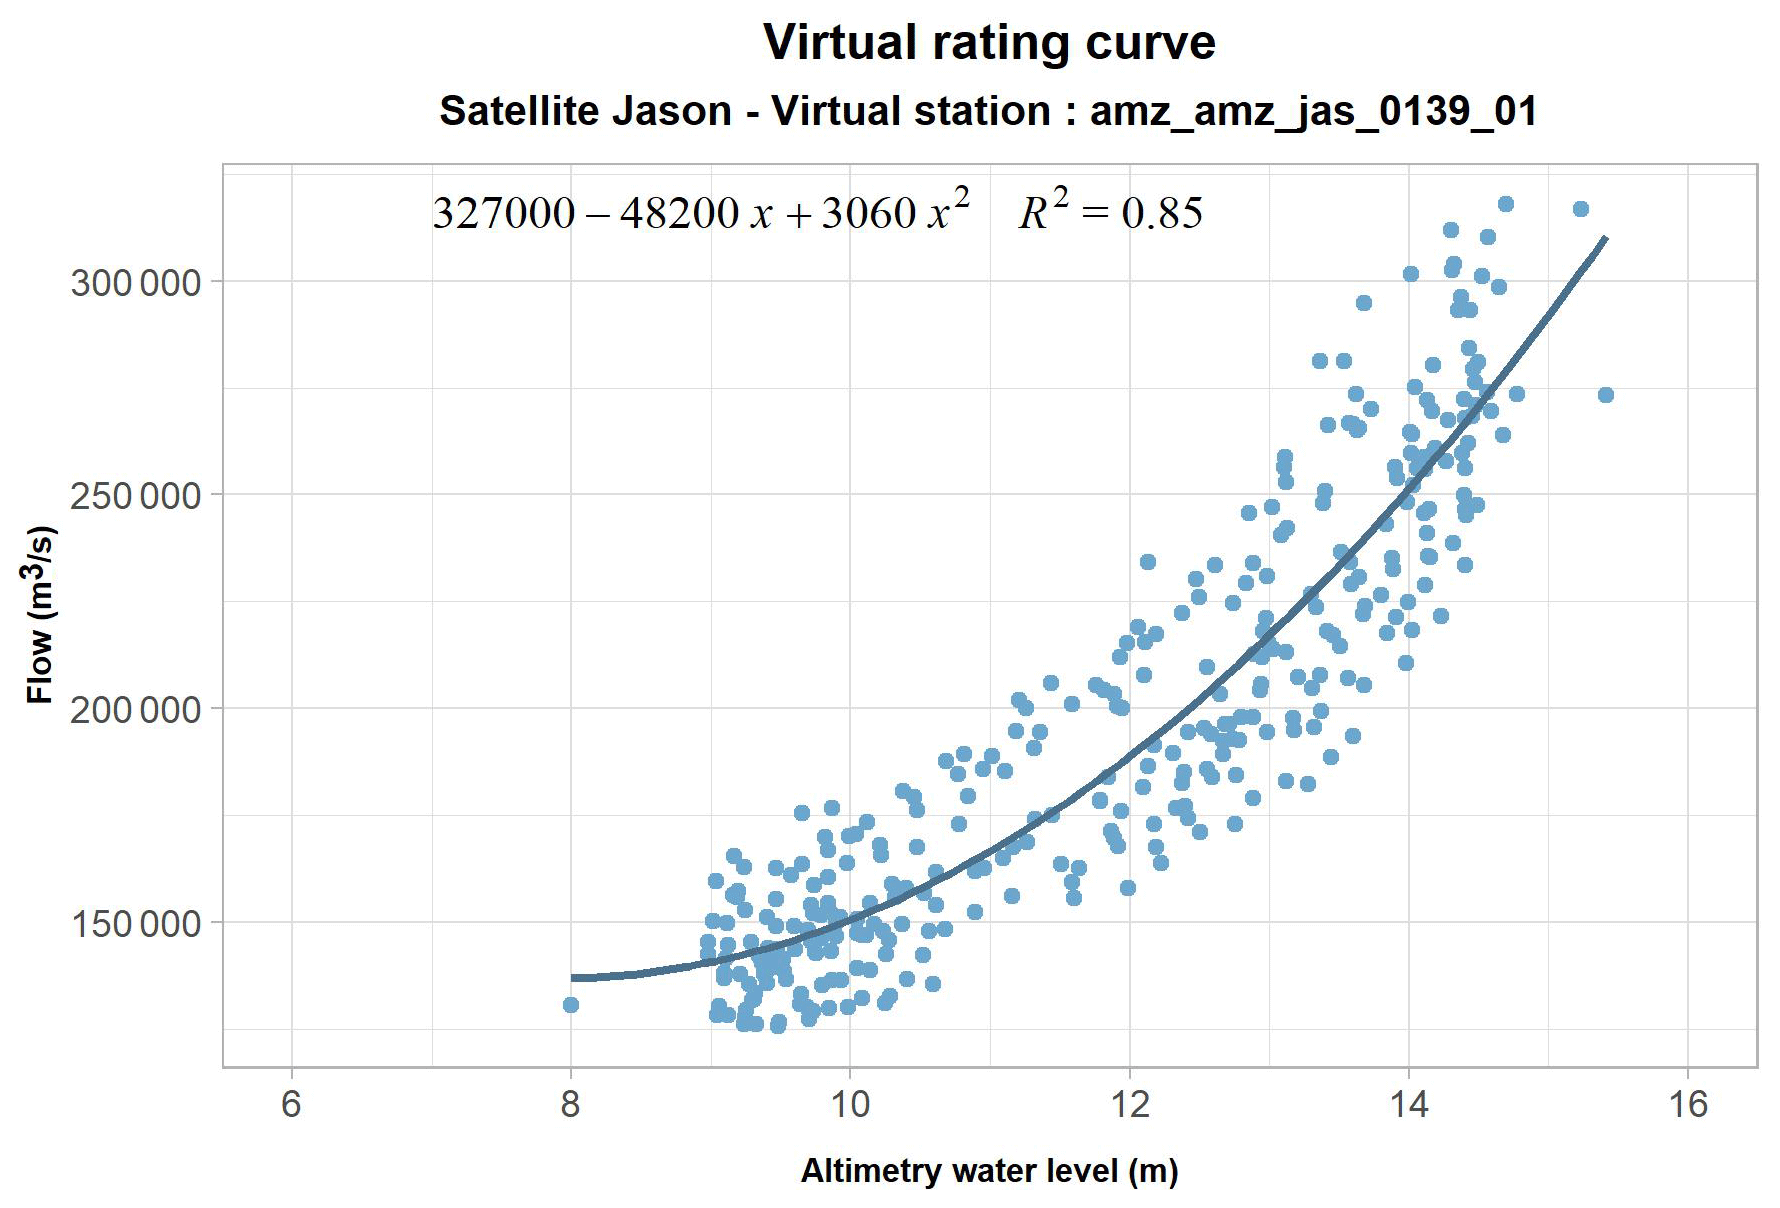
Figure 3Correlation between modelled flows and satellite water levels – Station amz-amz-jas-0139-01 (S=4 696 804 km2).
Figure 4 shows the distribution of the average flow estimation error for the 266 virtual stations of the Madeira and the Tapajos catchments. 34 % (90 virtual stations) present an error between 50 % and 60 % and 66 % of the virtual station (175 virtual stations) present an error between 45 % and 65 %.
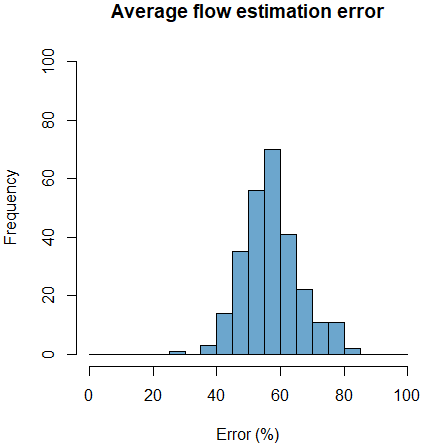
Figure 4Distribution of average flow estimation error for the Madeira and Tapajos catchments.
Such discrepancies have several origins. They include:
-
The imprecision linked to the measurement of water level by satellite. Even though technologies are advancing, measurement uncertainties remain.
-
Uncertainties linked to flow modeling by regionalization of parameters.
However, such results provide discharge information at places where this knowledge is unavailable, or even inaccessible. Such results can be useful for estimating available resources and carrying out water needs-resources assessments.
Figure 5 shows the spatial distribution of the R2 correlation coefficients between the modeled flows (GR5J at the top and SWAT at the bottom) and the satellite water level. We assume that any variation in elevation is associated with a variation in discharge. We also assume that the flows are natural.
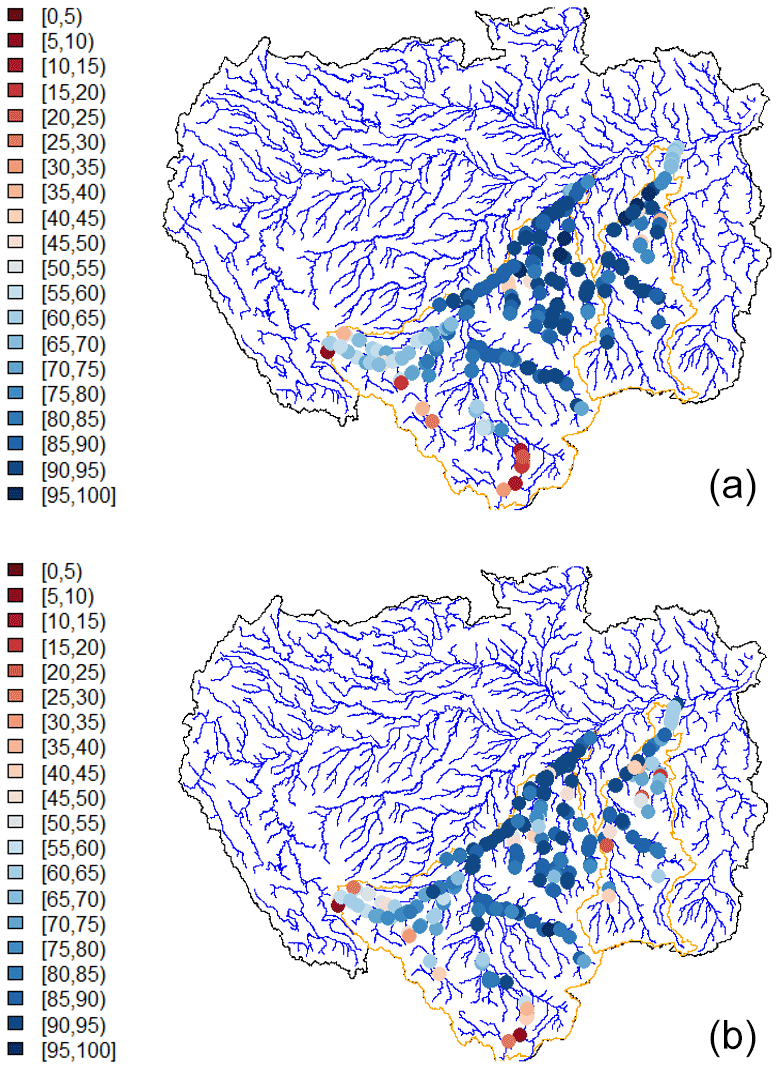
Figure 5Spatial distribution of the correlation coefficients R2 (satellite water level – modelled flows) on the Madeira and Tapajos sub-catchments. Correlation coefficients between satellite water level and modelled flows at daily time step and at dates for which altimetric and modelled data are available with GR5J (top picture) and with SWAT (bottom picture).
The two figures clearly show that the flows modelled by the SWAT and GR5J models present a good correlation with the water level of the virtual stations: on average the R2 are 0.79 with GR5J and 0.77 with SWAT. On the upstream parts of the sub-catchments, the correlation coefficients are lower. This can be explained by:
-
the small size of the rivers making the interpretation of radar echoes more complex,
-
a worse modeling of flows (lack of hydrometric data in these upstream parts, complex representation of rainfall in the Andean zone, etc.).
We examined the relation between the mean error in the flow estimate and the surface area of the catchment (see Fig. 6). For the Madeira and Tapajos catchment, the mean error in the flow estimate seems to decrease as the area of the catchment is higher. This observation is clearer considering the whole Amazon catchment.
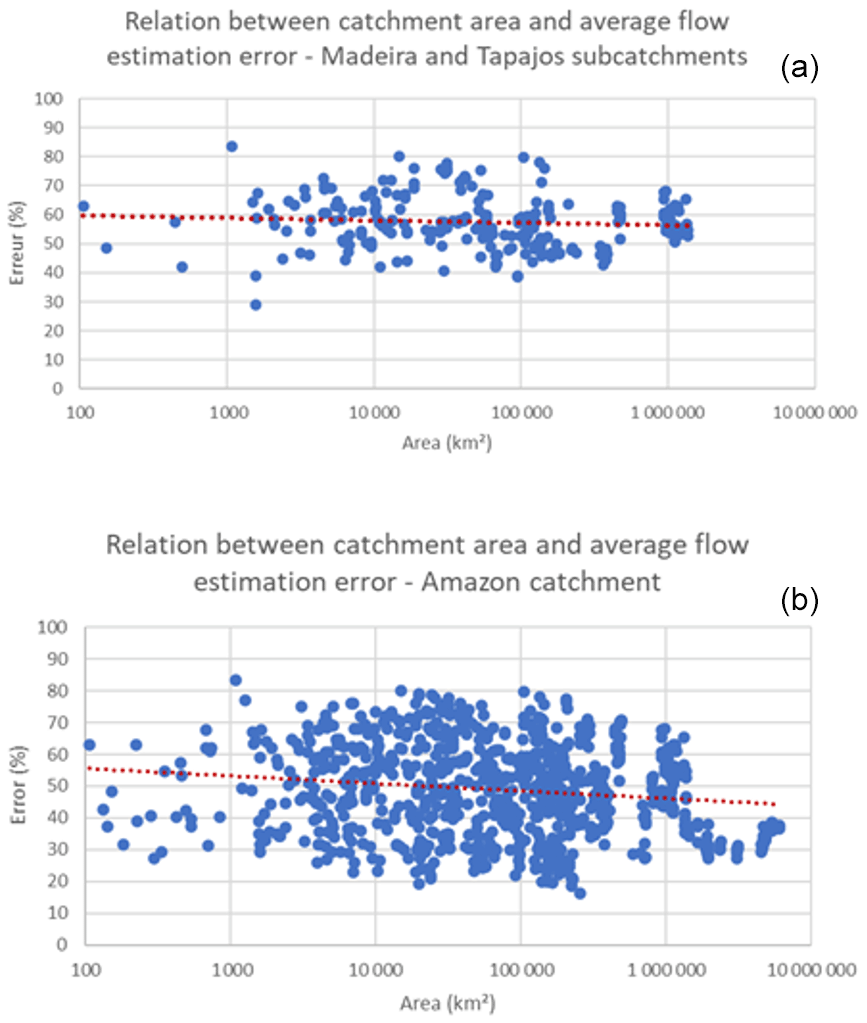
Figure 6Relation between catchment area and average flow estimation error. For the Madeira and Tapajos subcatchments (a) and for the Amazon catchment (b).
We examined the correlation coefficients according to the type of satellite (Sentinel 3A, Jason2 or Envisat). For this, the correlation coefficients were analyzed in frequency (ranking of R2 values).
The following graph shows the frequency distributions of the correlation coefficients according to the type of model (GR5J and SWAT) and the type of satellite data:
-
JASON 2: 2008–2012,
-
ENVISAT: 2002–2010
-
SENTINEL 3A: 2016–2019
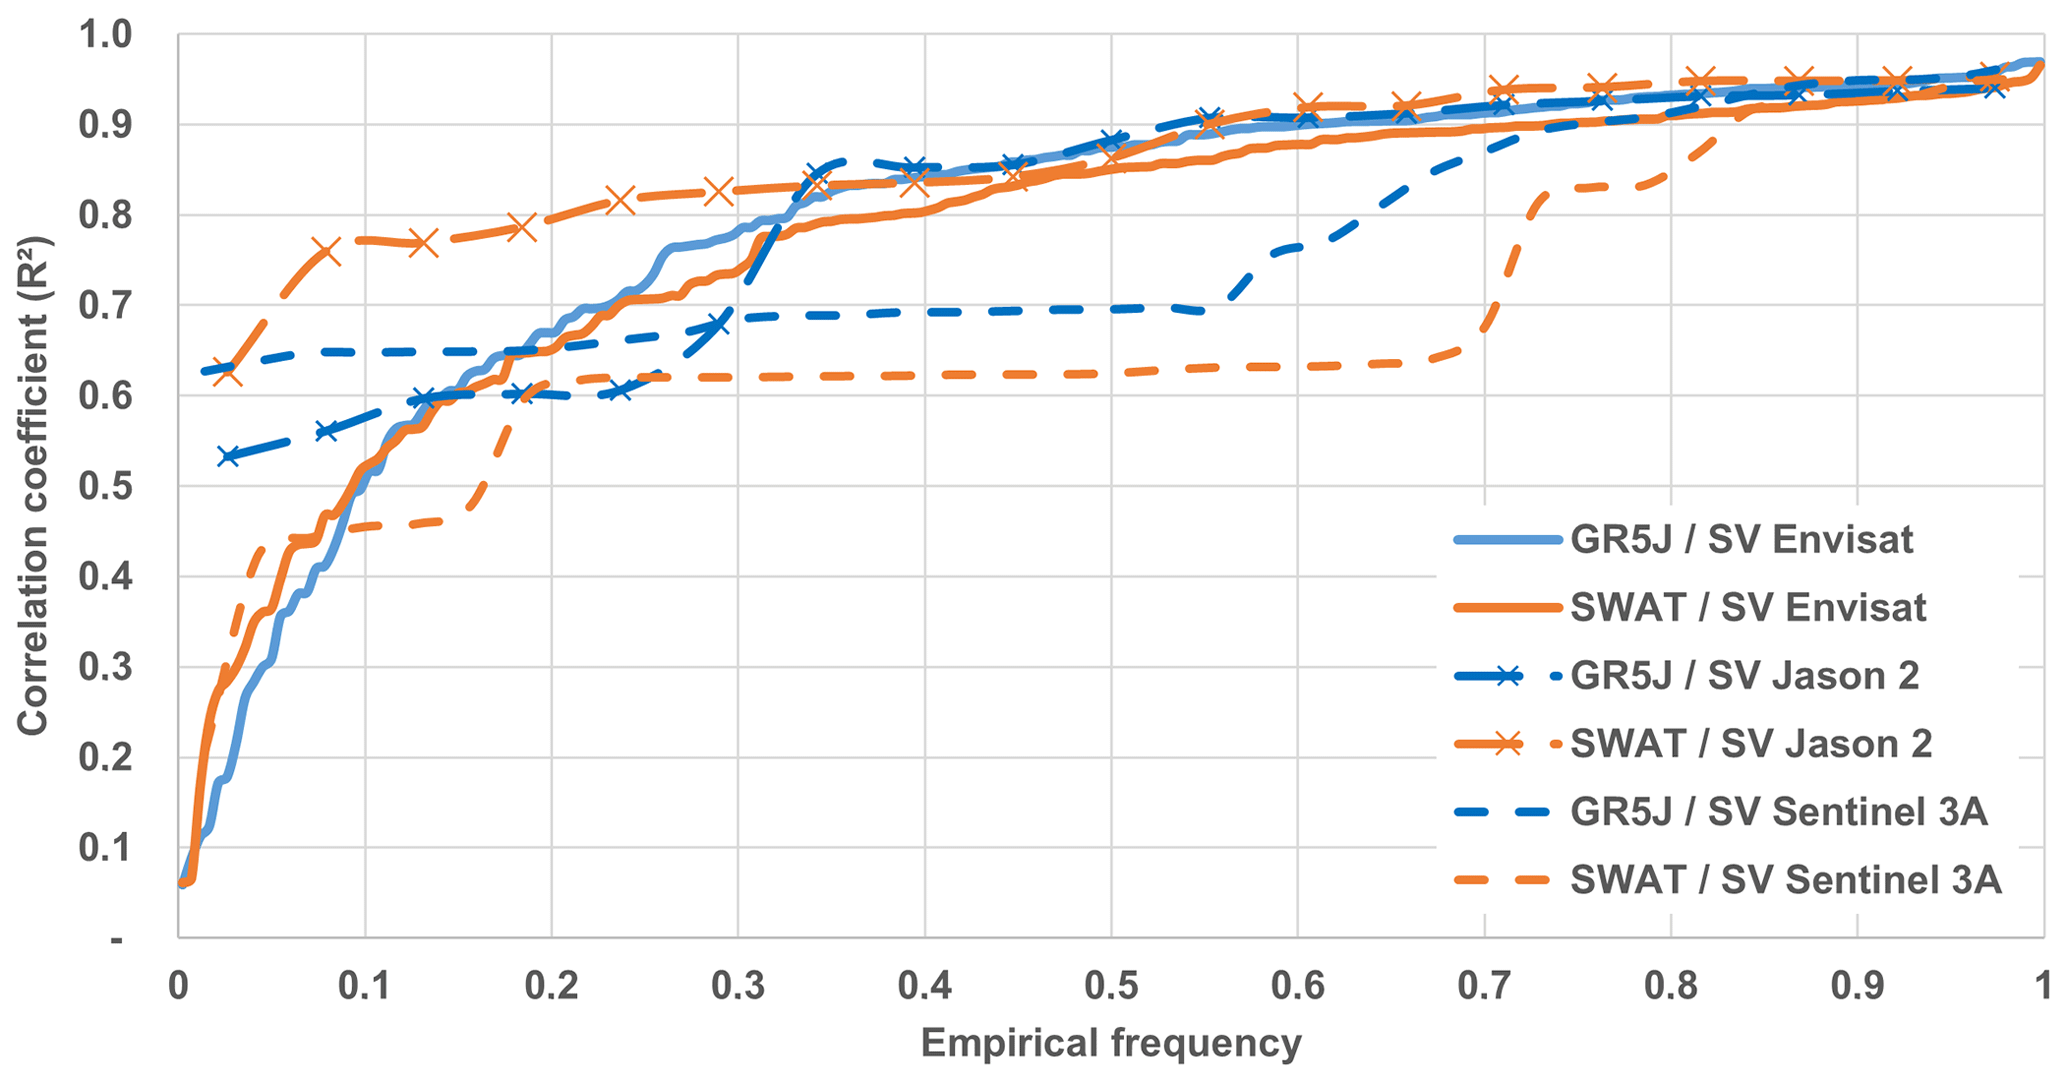
Figure 7Frequency distribution of correlation coefficients as a function of model type and satellite data type.
In general, it is important to note that both models give good correlations between modeled discharge and satellite water level regardless of the satellite product (given the assumptions for each model and satellite data). However, the correlation coefficients calculated with the Sentinel 3A product are lower than with the other data. At the outlet of the Tapajos catchment, the Sentinel 3A satellite track is parallel to the river. The satellite measures the water level of the river at 17 geographically close virtual stations. The correlation coefficient of these 16 stations (43 % of Sentinel 3A virtual stations) is 0.65 to 0.70 for the GR5J model and 0.62 to 0.63 for the SWAT model. This influences the shape of the curve. By retaining only one of these 16 virtual stations (and removing the other 15 stations), the shape of the curve is corrected for GR5J, not for the SWAT model (see Fig. 8). This is due to the number of data in common: the SWAT model stops in 2016. The R2 is not statistically significant.
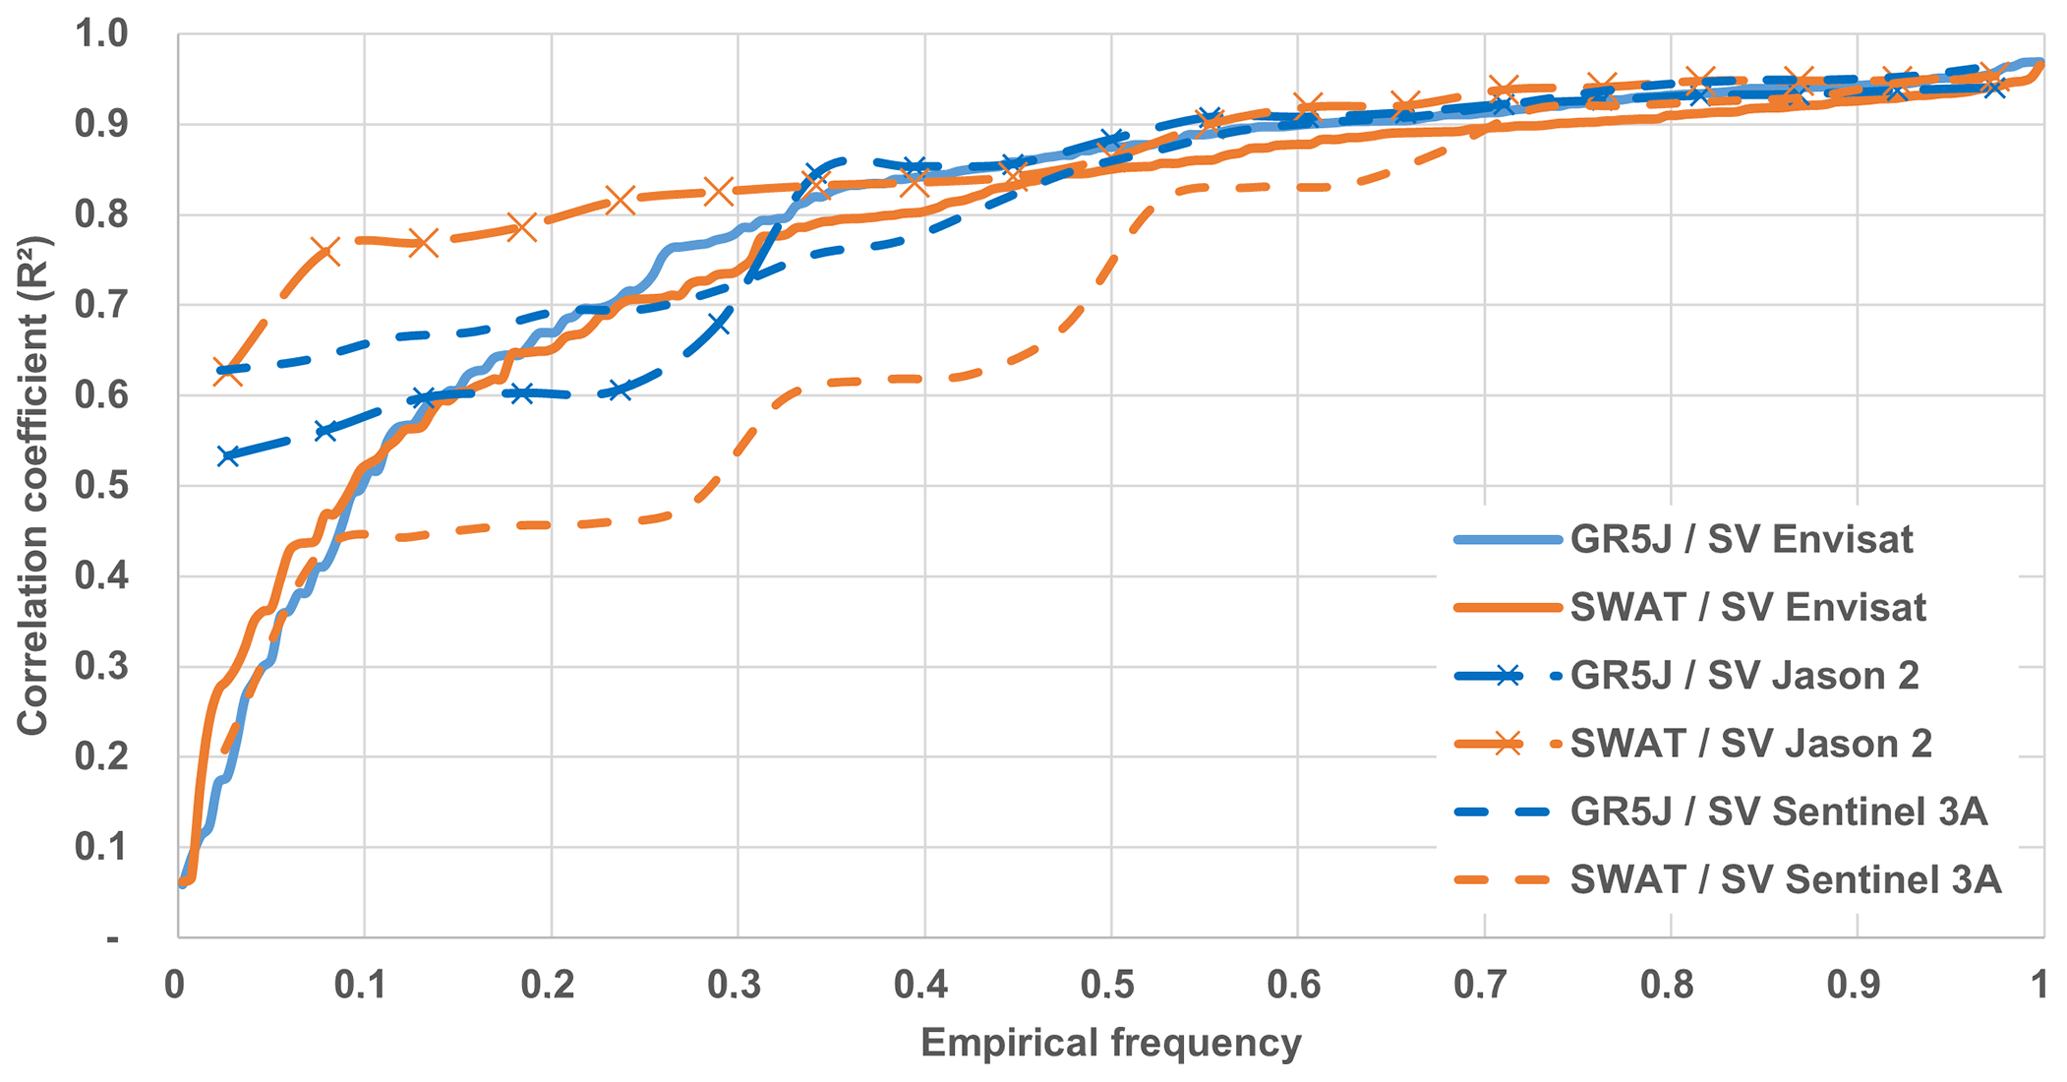
Figure 8Frequency distribution of correlation coefficients as a function of model type and satellite data type after correction.
On the Uganda river network, 39 virtual stations were studied. The figure hereafter shows the spatial distribution of the R2 correlation coefficients between the satellite water level and the modeled discharge on the Ugandan river network.
For Uganda, the results are worse than those of the Amazon catchment. This is explained by:
-
The low number of hydrometric stations available for calibrating the GR5J model. Data from 8 hydrometric stations were made available to us;
-
The quality of hydrometric data. The analysis of the data highlighted numerous uncertainties regarding their quality. The calibration of the GR5J models provided Nash-Sutcliffe values between 19 and 70;
-
Rainfall and ETP data used as input to the GR5J model. We did not have any climatic data on the ground. Therefore, we had to use spatial dataset. The choice of spatial data could not be validated by a comparison with in situ data.
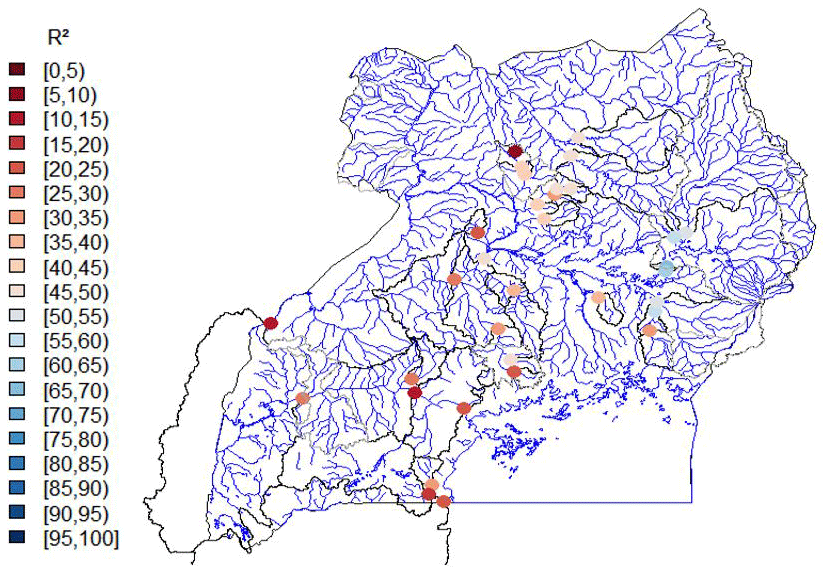
Figure 9Spatial distribution of R2 correlation coefficients (satellite water head – modelled flows) over the Uganda river system.
Satellite data have the advantage of covering the globe and provide regular and homogeneous altimetric information (same measurement methods) on regions with few or no in situ measurements. The HydroSim and SmartBasin projects confirm the interest of this spatial information, in particular spatial altimetry, for monitoring continental water resources.
The idea of spatial altimetry is to efficiently complement in situ data collection networks, and the coupling with these data and modeling is growing today. Within the framework of the HydroSim and SmartBasin projects, it is planned in the near future to enhance the use of spatial altimetry data to confirm the results of real-time hydrological modelling at many points of the network. It will be possible, in a few months, to use additional satellite information following the launch of the Surface Water Ocean Topography (SWOT, Biancamaria et al., 2016) mission with a much more precise temporal and spatial resolution than previous satellites. The analysis tools produced in these two projects will probably be used by future hydrologists.
The data used in the two projects (SmartBasin and HydroSim) are the property of institutions who do not wish their data to be publicly accessible.
JV and EL were respectively in charge of the Smart Basin and the HydroSim project administration and supervision. SB was in charge of the project administration and supervision for CENEAU for both projects. SS and JMSP were in charge of the HydroSim project administration and supervision on CNRS' side. JMM oversaw the relation with the beneficiary of the HydroSim project and ensured data collection. TL and YA analysed the data, calibrated the models at the location of the in-situ stations and modelled the flow at virtual stations location for both projects on BRLi's side. JG, PD and VDS analysed the data, calibrated the models at the location of the in-situ stations and modelled the flow at virtual stations location on CNRS's side. AP provided support for the critique of the altimetry data and the relationships between altimetric water level and simulated flow. FM identified the virtual stations, analysed and corrected the data for the Smart Basin project. TL and YA were in charge of writing the initial draft, making corrections and writing the final draft of this manuscript.
The contact author has declared that none of the authors has any competing interests.
Publisher’s note: Copernicus Publications remains neutral with regard to jurisdictional claims made in the text, published maps, institutional affiliations, or any other geographical representation in this paper. While Copernicus Publications makes every effort to include appropriate place names, the final responsibility lies with the authors.
This article is part of the special issue ”IAHS2022 – Hydrological sciences in the Anthropocene: Past and future of open, inclusive, innovative, and society-interfacing approaches”. It is a result of the XIth Scientific Assembly of the International Association of Hydrological Sciences (IAHS 2022), Montpellier, France, 29 May–3 June 2022.
The results presented in this article are the result of the work of several partners: BRLi, CENEAU, CLS, CNES, CNRS, DG-Treasury, IRD and the Occitanie Region. Without them, we would not have been able to complete this process.
This paper was edited by Christophe Cudennec and reviewed by two anonymous referees.
Anastasiadis, A., Magoulas Goerge, D., and Vrahatis Michael, N.: New globally convergent training scheme based on the resilient propagation algorithm, Neurocomputing, 64, 253–270, 2005.
Andriambeloson, J. A., Paris, A., Calmant, S., and Rakotondraompiana, S.: Reinitiating depth-discharge monitoring in small-sized ungauged watersheds by combining remote sensing and hydrological modelling: a case study in Madagascar, Hydrolog. Sci. J., 65, 2709–2728, 2020.
Arnold, J. G., Srinivasan, R., Muttiah, R. S., and Williams, J. R.: Large area hydrologic modeling and assessment part I: model development, J. Am. Water Resour. As., 34, 73–89, https://doi.org/10.1111/j.1752-1688.1998.tb05961.x, 2007.
Biancamaria, S., Lettenmaier, D. P., and Pavelsky, T. M.: The SWOT mission and its capabilities for land hydrology, Surv. Geophys., 37, 307–337, https://doi.org/10.1002/2014GL062764, 2016.
Bogning, S., Frappart, F., Blarel, F., Niño, F., Mahé, G., Bricquet, J.-P., Seyler, F., Onguéné, R., Etamé, J., Paiz, M.-C., and Braun, J.-J: Monitoring Water Levels and Discharges Using Radar Altimetry in an Ungauged River Basin: the case of the Ogooué, Remote Sens.-Basel, 10, 350, https://doi.org/10.3390/rs10020350, 2018.
Bogning, S., Frappart, F., Paris, A., Blarel, F., Niño, F., Picart, S. S., Lanet, P., Seyler, F., Mahé, G., Onguene, R., Bricquet, J.-P., Etame, J., Paiz, M.-C., and Braun, J.-J.: Hydro-climatology study of the Ogooué River basin using hydrological modeling and satellite altimetry, Adv. Space Res., 68, 672–690, https://doi.org/10.1016/j.asr.2020.03.045, 2020.
Garambois, P. A., Calmant, S., Roux, H., Paris, A., Monnier, J., Finaud-Guyot, P., Montazem, A. S., and Santos da Silva, J.: Hydraulic visibility: Using satellite altimetry to parameterize a hydraulic model of an ungauged reach of a braided river, Hydrol. Process., 31, 756–767, https://doi.org/10.1002/hyp.11033, 2017.
Gupta, H. V., Kling, H., Yilmaz, K. K., and Martinez, G. F.: Decomposition of the mean squared error and NSE performance criteria: Implications for improving hydrological modelling, J. Hydrol., 377, 80–91, 2009.
Huang, Q., Long, D., Du, M., Han, Z., and Han, P.: Daily continuous river discharge estimation for ungauged basins using a hydrological model calibrated by satellite altimetry: implications for the SWOT Mission, Water Resour. Res., 56, 537–546, https://doi.org/10.1029/2020WR027309, 2020.
Intrator, O. and Intrator, N.: Using Neural Nets for Interpretation of Nonlinear Models, Proceedings of the Statistical Computing Section, 244–249, 1993.
Lebel, T., Taupin, J., and D'Amato, N.: Rainfall monitoring during HAPEX-Sahel. 1. General rainfall conditions and climatology, J. Hydrol., 189, 74–96, https://doi.org/10.1016/S0022-1694(96)03155-1, 1997.
Le Moine, N.: Le bassin versant vu par le souterrain: une voie d'amélioration des performances et du réalisme des modèles pluie-débit ?, PhD, Université Pierre et Marie Curie, École Doctorale 398 Géosciences et Ressources Naturelles, France, 348 pp., https://hal.inrae.fr/view/index/identifiant/tel-02591478, 2008.
Li, J. and Heap, A.: A review of Spatial Interpolation Methods for environmental scientists, Geoscience Australia, GPO Box 378, Canberra, ACT 2601, Australia, 137 pp., 2008.
Paiva, R., Buarque, D., Collischonn, W., Bonnet, M.-P., and Frappart, F.: Large-scale hydrological and hydrodynamic modelling of the Amazon River basin, Water Resour. Res., 49, 1226–1243, 2013.
Paris, A.: Utilisation conjointe de données d'altimétrie satellitaire et de modélisation pour le calcul des débits distribués dans le bassin amazonien, PhD, Université Paul Sabatier – Toulouse III, 289 pp., https://theses.hal.science/tel-01357059, 2015.
Paris, A., Dias de Paiva, R., Santos da Silva, J., Medeiros Moreira, D., Calmant, S., Garambois, P. A., and Seyler, F.: Stage-discharge rating curves based on satellite altimetry and modeled discharge on the Amazon basin, Water Resour. Res., 52, 3787–3814, 2016.
Poncelet, C., Andréassian, V., Oudin, L., and Perrin, C.: The Quantile Solidarity approach for the parsimonious regionalization of flow duration curves, Hydrolog. Sci. J., 62, 1364–1380, 2017.
Riedmiller, M. and Braun, H.: A direct adaptive method for faster backpropagation learning: The RPROP algorithm, ProSceedings of the IEEE International Conference on Neural Networks (ICNN), San Francisco, CA, USA, 586–591, https://doi.org/10.1109/ICNN.1993.298623, 1993.
Saadi, M., Oudin, L., and Ribstein, P.: Random Forest Ability in Regionalizing Hourly Hydrological Model Parameters, Water, 11, 1540, https://doi.org/10.3390/w11081540, 2019.
Satge, A., Defrance, D., Sultan, B., Bonnet, M.-P., Seyler, F., Rouché, N., Pierron, F., and Paturel, J.: Evaluation of 23 gridded precipitation datasets across West Africa, J. Hydrol., 581, 124412, https://doi.org/10.1016/j.jhydrol.2019.124412, 2020.
Vörösmarty, C., Askew, A., Grabs, W., Barry, R. G., Birkett, C., Döll, P., Goodison, B., Hall, A., Jenne, R., Kitaev, L., Landwehr, J., Keeler., M., Leavesley, G., Schaake, J., Strzepek, K., Sundarvel, S. S., Takeuchi, K., and Webster, F.: Global water data: A newly endangered species, Eos, 82, 54–58, https://doi.org/10.1029/01EO00031, 2001.