the Creative Commons Attribution 4.0 License.
the Creative Commons Attribution 4.0 License.
 | 18 Apr 2024
Managed groundwater recharge at the farm scale in pre-Saharan Morocco
Guillaume Lacombe
Benoit Dewandel
Abdelilah Taky
Jean-Christophe Maréchal
Ali Hammani
Sami Bouarfa
The oases of the pre-Saharan basin of Wadi Ferkla in southeastern Morocco receives low and erratic rainfall (annual average of 141 mm and inter-annual standard deviation of 70 mm). From the 1980s, surface water and groundwater are increasingly used due to the expansion of irrigation, mainly along two wadis, namely Wadis Ferkla and Satt originating in the High-Atlas and the Anti-Atlas Mountains, respectively. Their flows reach the Ferkla's irrigated perimeters only when the volume of the flood events exceed upstream evaporation, withdrawals and riverbed's infiltration. Nowadays, these irrigated perimeters exert significant pressure on groundwater resources, through numerous drillings equipped with pumping systems, most of them being powered by solar energy. This increasing water demand situation incentivizes individual farmers to design and implement innovative techniques to increase water access for their farms. For instance, the spreading of floodwaters – an ancestral and collective irrigation practice in traditional oases – is currently being modernized by individual farmers. The new technique consists in partially diverting flood flows into earthen basins. The stored water either infiltrates to recharge local aquifers, or is pumped for flood irrigation of date palms. An experimental protocol was set up to characterize groundwater recharge below one of these on-farm basins equipped with a recharge well. Barometric probes were installed in the basin, in the recharge well and in neighboring boreholes to automatically monitor water levels. A topographic survey of the monitoring points and of the basin aimed at deriving piezometric levels from water levels measurements and estimating the height-surface-volume curves of the basin. After 7 months of continuous monitoring, 3 flood events were recorded. The establishment of the basin water balance at a fine time-resolution allowed estimating its different components including the infiltration rate influencing groundwater recharge. An analytical modeling of this process was developed to assess its effect on groundwater level variations. This approach aims to contribute to a broader reflection on securing water management in this fragile oasis ecosystem.
- Article
(1017 KB) - Full-text XML
- BibTeX
- EndNote


Water level monitoring; field observations; groundwater recharge; modelling; oasis; pre-Saharan Morocco
The pre-Saharan Morocco has experienced a significant expansion of pumped agriculture since the 1980s. The pressure on the already scarce groundwater resource has increased considerably. Nowadays, some farms have set up groundwater recharge structures (Todd and Mays, 2004) to increase the supply of irrigation water from wadi floods (Hashemi et al., 2013).
Several authors have evaluated the feasibility of farm-level groundwater recharge (Arshad et al., 2014; Godwin et al., 2022) and the performance of farm-level well recharge structures (Soni et al., 2020).
Worldwide, infiltration rates from groundwater recharge basins vary between 0.3 and 1 m d−1. The volumes infiltrated into these basins are between 600 and 14 000 m3 d−1 (Wuilleumier and Seguin, 2008). The capacity of the injection wells fluctuates between 1700 and 6000 m3 d−1 (Casanova et al., 2013). It is important to assess the effect of infiltration on groundwater. The analytical solution developed by Hantush (1967) for assessing the growth and decay of the groundwater mound below an infiltration basin is used worldwide and very accurate compared to numerical modelling (Warner et al., 1989; Carleton, 2010). Recently, this solution has been adapted to the case where a pumping or recharge well is located near or inside the recharge area (Dewandel et al., 2021).
In this paper, we assess the infiltration rate of a farm-scale recharge basin from its water balance and we evaluate its impact on the local aquifer. The research site, located in Ferkla (Morocco), consists of a floodwater storage basin built around and above a well formerly used for pumping.

2.1 Study site
The farm studied (5°02′01.00′′ W, 31°29′40.00′′ N) is located in the arid region of Drâa-Tafilalet (Morocco). It is located on the left bank of Wadi Satt which originates in the Anti-Atlas. Its runoff reaches the farm during flood periods only. The average rainfall is around 141 mm yr−1 with a standard deviation of around 70 mm (Ait Bouijane station 1961–2018). This farm relies on the quaternary formations of Wadi Satt and pump water from both quaternary and underlying fractured schist-quartzite aquifers. Like all the farms in Ferkla, this farm is irrigated by pumping groundwater throughout the year. It has a basin that allows partial storage of flood water and local recharge of the water table. After filling the basin with a maximum storage area and depth of about 6400 m2 and 2.8 m, respectively, part of the stored water is pumped during the day using solar energy, and channeled into a pipe to irrigate the date palms by gravity. Some palm trees are planted inside the storage basin.
2.2 Material
In order to assess groundwater recharge from the flood basin and its well, four barometric probes recording surface and groundwater levels every 10 min (Fig. 1) were installed in the basin, in its well and in two boreholes located 30 and 360 m away from the basin. The depth of the well inside the basin does not exceed 12 m. The other boreholes are more than 80 m deep and capture water from the Ordovician quartzite and the shale aquifers. One probe placed in the open air aimed to remove the biases caused by the atmospheric pressure variations from the water level measurements. Measured water levels were converted to piezometric levels based on a topographic survey.
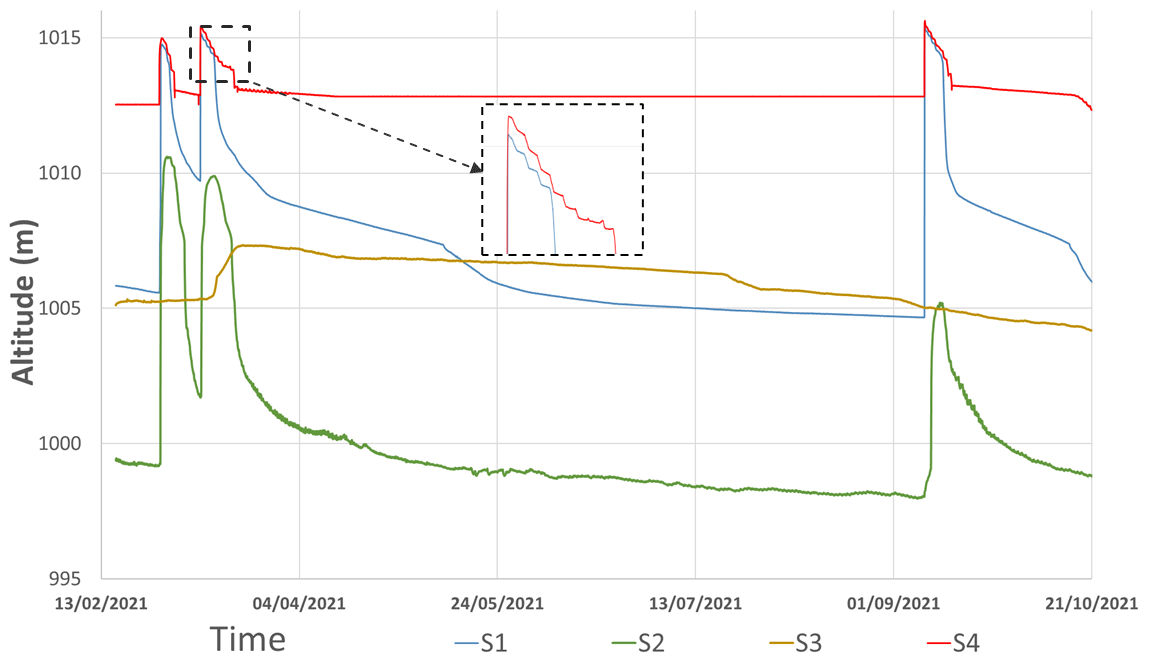
Figure 2Water level in the basin (S4) and in the piezometric monitoring points (S1, S2, S3).
Periodic measurements with a manual piezometer aimed to validate automatic records. A topographic survey of the basin was carried out and processed in ArcGIS to derive the height-volume-surface curve of the basin. Daily precipitation and evapotranspiration data calculated by the Penman-Montheith method (ET0) were available from the nearest meteorological station (Goulmima, ORMVA-Tf).
2.3 Methods
2.3.1 Calculating the infiltration rate from the basin
Infiltration from the basin and its well were estimated from the simplified water balance equation of the basin Eq. (1) obtained during periods with no pumping, no inflow and no rainfall. During these periods visually identified on the graph depicting temporal variations of the basin water level, its water balance simplifies as follows:
where Δh is the variation of the basin water level (mm) over time, q, E and ETpalm are the infiltration (mm), the evaporation (mm) and the evapotranspiration of the palm trees located in the basin, respectively, over the same period of time.
These computation periods were selected at least 24 h after each flood event to ensure the absence of delayed inflow that can bias the infiltration rate calculations, and during the nighttime when there is no pumping from the basin. Infiltration rates were assessed for different water levels in the basin, over time periods of a few hours and exhibiting near-constant drawdown. E and ETpalm were calculated with Eqs. (2) and (3), respectively:
where k is the coefficient of the Colorado tank measuring Etank, usually equal to 0.8, f is the Penman reduction factor of ET0 used to estimate Etank, equal to 0.82 for semi-arid areas (Riou, 1971).
where kc is the crop coefficient of the date palm. It depends on the vegetative stage and varies between 0.8 and 1. In order not to under evaluate ETpalm, kc was fixed to 1.
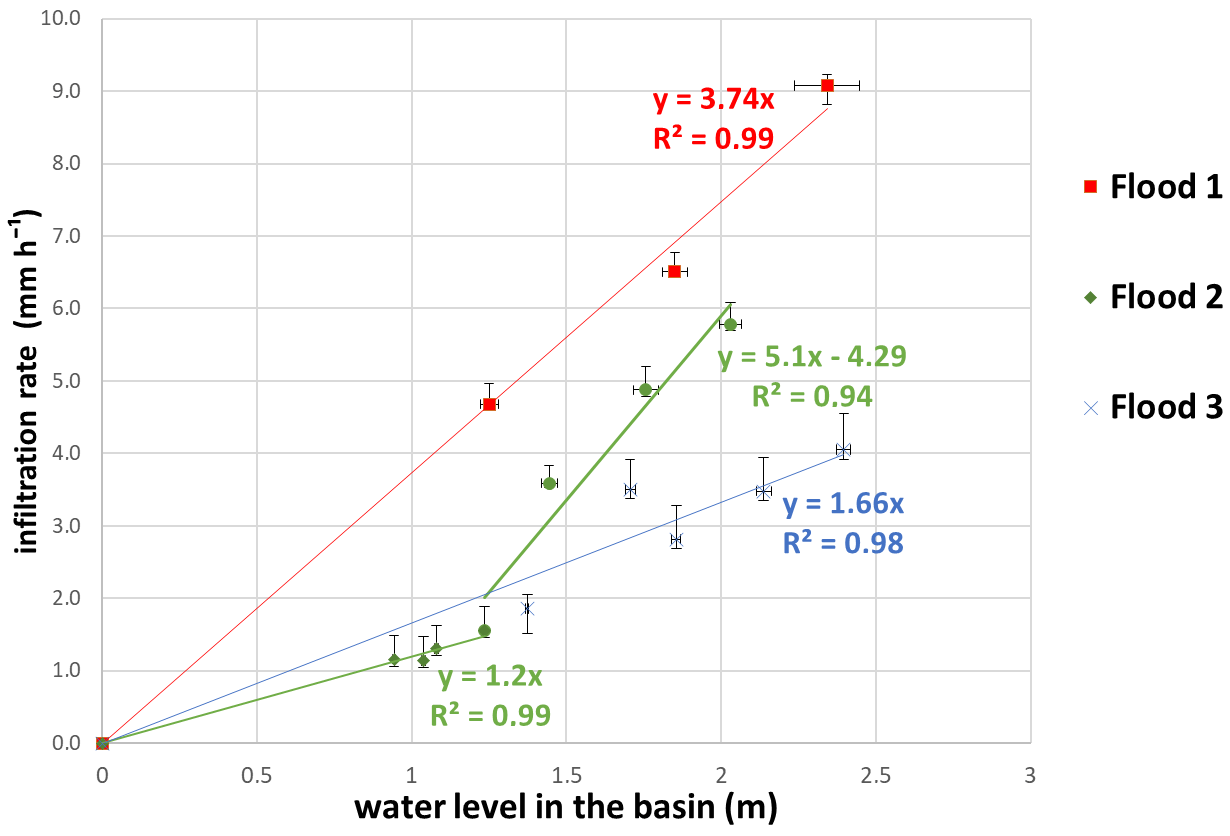
The infiltration rates q calculated over the selected periods were plotted against their corresponding mean basin water level (hbasin). Spurious values likely caused by undetected pumping or probe dysfunctions were removed from the sample (3 values among 17). Linear regressions with R2 exceeding 0.94 were fitted to the scatter plots of each recorded flood using Eq. (4):
Different values for the parameters a and b were obtained for each flood event because of the change in the geometry and permeability of the basin due to siltation. On one of the recorded floods, the infiltration rates were calculated for shallow depths. Thus, two infiltration equations were calculated for this flood, depending on the water level, either lower or greater than 1.4 m.
Infiltration rates of the well located in the basin were computed for water levels lower than those ensuring hydraulic connection with the basin. These infiltration rates were calculated from the well discharge curve. The calculation intervals selected from this curve are the same for all recorded flood events. This velocity is multiplied by the cross-sectional area of the well to derive the seepage rate from the well.
2.3.2 Analytical modelling of groundwater recharge
In order to model the response of the water table below the studied recharged basin, the analytical model developed by Dewandel et al. (2021) which is based on the equations of Hantush (1965 and 1967), was used. The model accounts for the aquifer characteristics (storage coefficient, permeability and aquifer thickness) and for the infiltration flow as a function of time (Eq. 4), to estimate piezometric variations.
For the purpose of the modelling, the geometry of the basin was approximated to a rectangle with the same average area of ponded water. The aquifer thickness used in the model was assigned to 30 m, which corresponds to the saturated quaternary deposit and the top of fractured Ordovician aquifer in the studied region (Ressources en Eau Du MAROC Tome III, 1977). An additional probe located in the vicinity of the wadi 3 km upstream showed no reaction of the piezometry during floods. Therefore, the natural river recharge was assumed to be negligible and not accounted for in the model.
The calibration of the model was performed by adjusting the permeability and storage coefficients values so as to obtain a visually satisfactory match between observed and simulated piezometric levels at S2 and S3.

3.1 Description and analysis of piezometric and limnimetric measurements
During the three recorded flood events (Fig. 2), the water levels in the basin (S4) and in the well inside the basin (S1) initiate a sharp and rapid increase (filling stage), immediately followed by a smoother drop (emptying stage). At the beginning of the emptying stage, S1 and S4 follow similar decrease rates, suggesting that the well and the basin are hydraulically connected. The staircase-like shape of the curves (Fig. 2) reflects the intermittence of pumping that occurs during daytime to irrigate the farm.
After several days of nearly synchronized drawdown of S1 and S4, S1 initiates a much sharper decrease, suggesting that the well disconnects from the basin.
The monitoring points S1 and S2 respond to all filling of the basin. The maximum groundwater level reached during each flood in S2 decreases overtime. In contrast, point S3 did not seem to respond to the first and the third flood, and its response to the second flood is delayed.
3.2 The infiltration rate in the basin
The basin infiltration rates vary between 1 and 9 mm h−1. Figure 3 shows that the infiltration rates decrease overtime (from flood 1 to flood 3). This is assumed to result from the silting up of the basin and the local clogging of the bottom. Furthermore, it is found that the rates are proportionally linear to the depth of water in the basin; the infiltration equations from the basin are thus deduced.


The basin has a maximum storage capacity of approximately 6500 m3, the volumes of water infiltrated during the three events fluctuate between 2100 and 3150 m3. Moreover, the sum of evaporation and evapotranspiration accounts for 3 %, 7 % and 14 % of the infiltrated volumes for the first, second and third floods, respectively. As for the infiltration flows from the recharge well, they do not exceed 0.7 m3 h−1, i.e. less than 17 m3 d−1. These values are negligible compared to the infiltration from the basin, which are between 240 and 380 m3 d−1. Thus, we are only interested in infiltration from the bottom of the basin in the remainder of this work.
3.3 Calibration of the groundwater recharge model
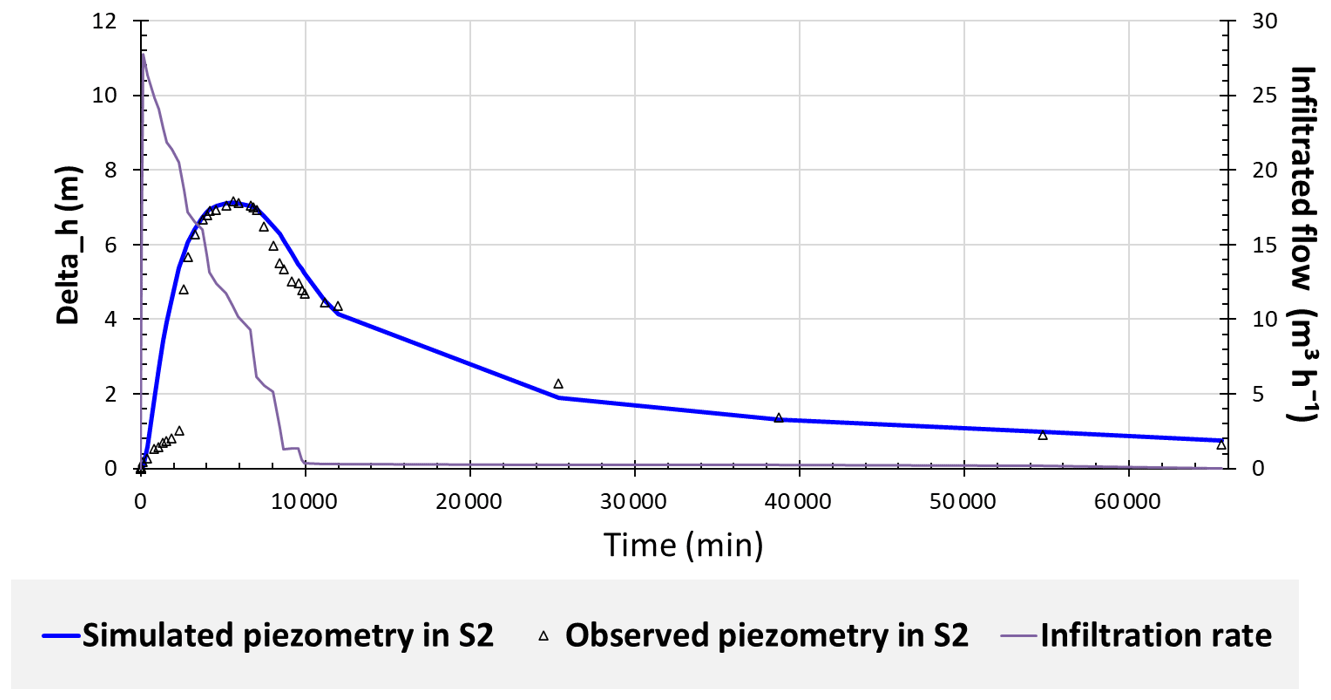
The model was first fitted at point S2 where all the fills of the basin induced an increase of the observed and modelled water levels. The permeability and the storage coefficient values yielding the best match between the observed data and the simulated values are m s−1 and , respectively. The third flood was fitted with a permeability coefficient, m s−1, slightly lower than that used for the first two floods (Fig. 5). This slight difference may be due to errors in flow estimation and to the artefact of modelling the basin as a rectangle. These K and S values are typical of free fractured aquifers (Dewandel et al., 2006; Lachassagne et al., 2021).
The calibration values of permeability and storage coefficient obtained in S2 were also used in S3 (Figs. 6 and 7), assuming that the structure of the aquifer is homogenous. However, the model could not reproduce the groundwater level fluctuations observed in S3 during the three floods, even for other K and S values. Thus, we may conclude that there is no direct link between the infiltration basin and S3. The piezometric increase in S3 may be due to the return flow from irrigation (Fig. 6) that occurs around this point.
Modelling that takes into account the infiltration flow rates from the basin and does not take into account the natural recharge of the wadi and the recharge by the well has allowed the response at piezometer (S2) to be reproduced reasonably. This modelling also shows that a farther piezometer (S3) does not respond to the pond infiltration, probably due to the absence of a dense enough fractures network to connect the aquifer on a large scale. After each flood, infiltration rates decrease because of the basin siltation. In summary, this recharge basin allows the groundwater to be recharged locally over a radius less than 360 m, which may improve locally water sustainability for agriculture. Also, we show that on this experimental site, the recharge induced by the wadi is weak, likely because of its low-permeable bed, and that the recharge induced by the well inside the basin is weak too, probably due to the partial or total clogging caused by the flood deposit.
The data that support the findings of this study are available from the corresponding author upon reasonable request.
YK, GL, AT, and AH. designed the research; YK performed the processing of data; YL, GL, and BD performed the research and the modelling; YK analysed the data. YK, GL, and BD wrote the paper; AH, SB, and JCM provided correction and remarks to the paper.
The contact author has declared that none of the authors has any competing interests.
Publisher's note: Copernicus Publications remains neutral with regard to jurisdictional claims in published maps and institutional affiliations.
This article is part of the special issue “IAHS2022 – Hydrological sciences in the Anthropocene: Past and future of open, inclusive, innovative, and society-interfacing approaches”. It is a result of the XIth Scientific Assembly of the International Association of Hydrological Sciences (IAHS 2022), Montpellier, France, 29 May–3 June 2022.
We thank the Massire project (IFAD, policy number 2000002013) for funding the research and the state agencies ORMVA-Tf, ABH-GZR and ANDZOA for field support and data sharing.
This paper was edited by Christophe Cudennec and reviewed by Mohammad Merheb and one anonymous referee.
Arshad, M., Guillaume, J. H. A., and Ross, A.: Assessing the Feasibility of Managed Aquifer Recharge for Irrigation under Uncertainty, Water, 6, 2748–2769, https://doi.org/10.3390/w6092748, 2014.
Carleton, G. B.: Simulation of groundwater mounding beneath hypothetical stormwater infiltration basins, US Geol. Surv. Sci. Inv. Rep. 2010-5102, 64 pp., https://doi.org/10.3133/sir20105102, 2010.
Casanova, J., Cagnimel, M., Devau, N., and Pettenati, M.: Recharge artificielle des eaux souterraines: état de l'art et perspectives 227, https://infoterre.brgm.fr/rapports/RP-61821-FR.pdf (last access: 26 May 2022), 2013.
Dewandel, B., Lachassagne, P., Wyns, R., Maréchal, J. C., and Krishnamurthy, N. S.: A generalized 3-D geological and hydrogeological conceptual model of granite aquifers controlled by single or multiphase weathering, Hydro-ecological functioning of the Pang and Lambourn catchments, UK 330, J. Hydrol., 330, 260–284, https://doi.org/10.1016/j.jhydrol.2006.03.026, 2006.
Dewandel, B., Lanini, S., Hakoun, V., Caballero, Y., and Maréchal, J.-C.: Artificial aquifer recharge and pumping: transient analytical solutions for hydraulic head and impact on streamflow rate based on the spatial superposition method, Hydrogeol. J., 29, 1009–1026, https://doi.org/10.1007/s10040-020-02294-9, 2021.
Godwin, I. A., Reba, M. L., Leslie, D. L., Adams, R. F., and Rigby, J. R.: Feasibility of farm-scale infiltration galleries for managed aquifer recharge in an agricultural alluvial aquifer of Northeast Arkansas, Agr. Water Manag., 264, 107531, https://doi.org/10.1016/j.agwat.2022.107531, 2022.
Hantush, M. S.: Growth and decay of groundwater-mounds in response to uniform percolation, Water Resour. Res., 3, 227–234, https://doi.org/10.1029/WR003i001p00227, 1967.
Hashemi, H., Berndtsson, R., Kompani-Zare, M., and Persson, M.: Natural vs. artificial groundwater recharge, quantification through inverse modeling, Hydrol. Earth Syst. Sci., 17, 637–650, https://doi.org/10.5194/hess-17-637-2013, 2013.
Lachassagne, P., Dewandel, B., and Wyns, R.: Review: Hydrogeology of weathered crystalline/hard-rock aquifers – guidelines for the operational survey and management of their groundwater resources, Hydrogeol. J., 29, 2561–2594, https://doi.org/10.1007/s10040-021-02339-7, 2021.
Ressources en Eau Du MAROC Tome III: Hydrogéologie Bassin versant [WWW Document], Scribd, https://fr.scribd.com/document/494028246/Ressources-en-Eau-Du-MAROC-Tome-III (last access: 4 May 2022), 1977.
Riou, C.: Evaporation en bac et évapotranspiration potentielle: Expression de l'évaporation d'une petite nappe d'eau en fonction des données sous abri, Int. Assoc. Sci. Hydrol. Bull., 16, 53–65, https://doi.org/10.1080/02626667109493048, 1971.
Soni, P., Dashora, Y., Maheshwari, B., Dillon, P., Singh, P., and Kumar, A.: Managed Aquifer Recharge at a Farm Level: Evaluating the Performance of Direct Well Recharge Structures, Water, 12, 1069, https://doi.org/10.3390/w12041069, 2020.
Todd, D. K. and Mays, L. W.: Groundwater Hydrology, John Wiley & Sons, 656 pp., ISBN 0471059374, 9780471059370, 2004.
Warner, J., Molden, D., Chehata, M., and Sunada, D. K.: Mathematical analysis of articial recharge from basins 1, Jawra, https://doi.org/10.1111/J.1752-1688.1989.TB03077.X, 1989.
Wuilleumier, A. and Seguin, J. J.: Réalimentation artificielle des aquifères en France, Une synthèse, Rapport final, BRGM/RP-55063-FR, 122 pp., 2008.