Articles | Volume 385
https://doi.org/10.5194/piahs-385-443-2024
Post-conference publication
 | 
19 Apr 2024
Post-conference publication |  | 19 Apr 2024

Assessing the Accuracy of Multiple Classification Algorithms Combining Sentinel-1 and Sentinel-2 for the Citrus Crop Classification and spatialization of the Actual Evapotranspiration Obtained from Flux Tower Eddy Covariance: Case Study of Cap Bon, Tunisia

Amal Chakhar, Rim Zitouna-Chebbi, David Hernández-López, Rocío Ballesteros, Imen Mahjoub, and Miguel A. Moreno
Abstract

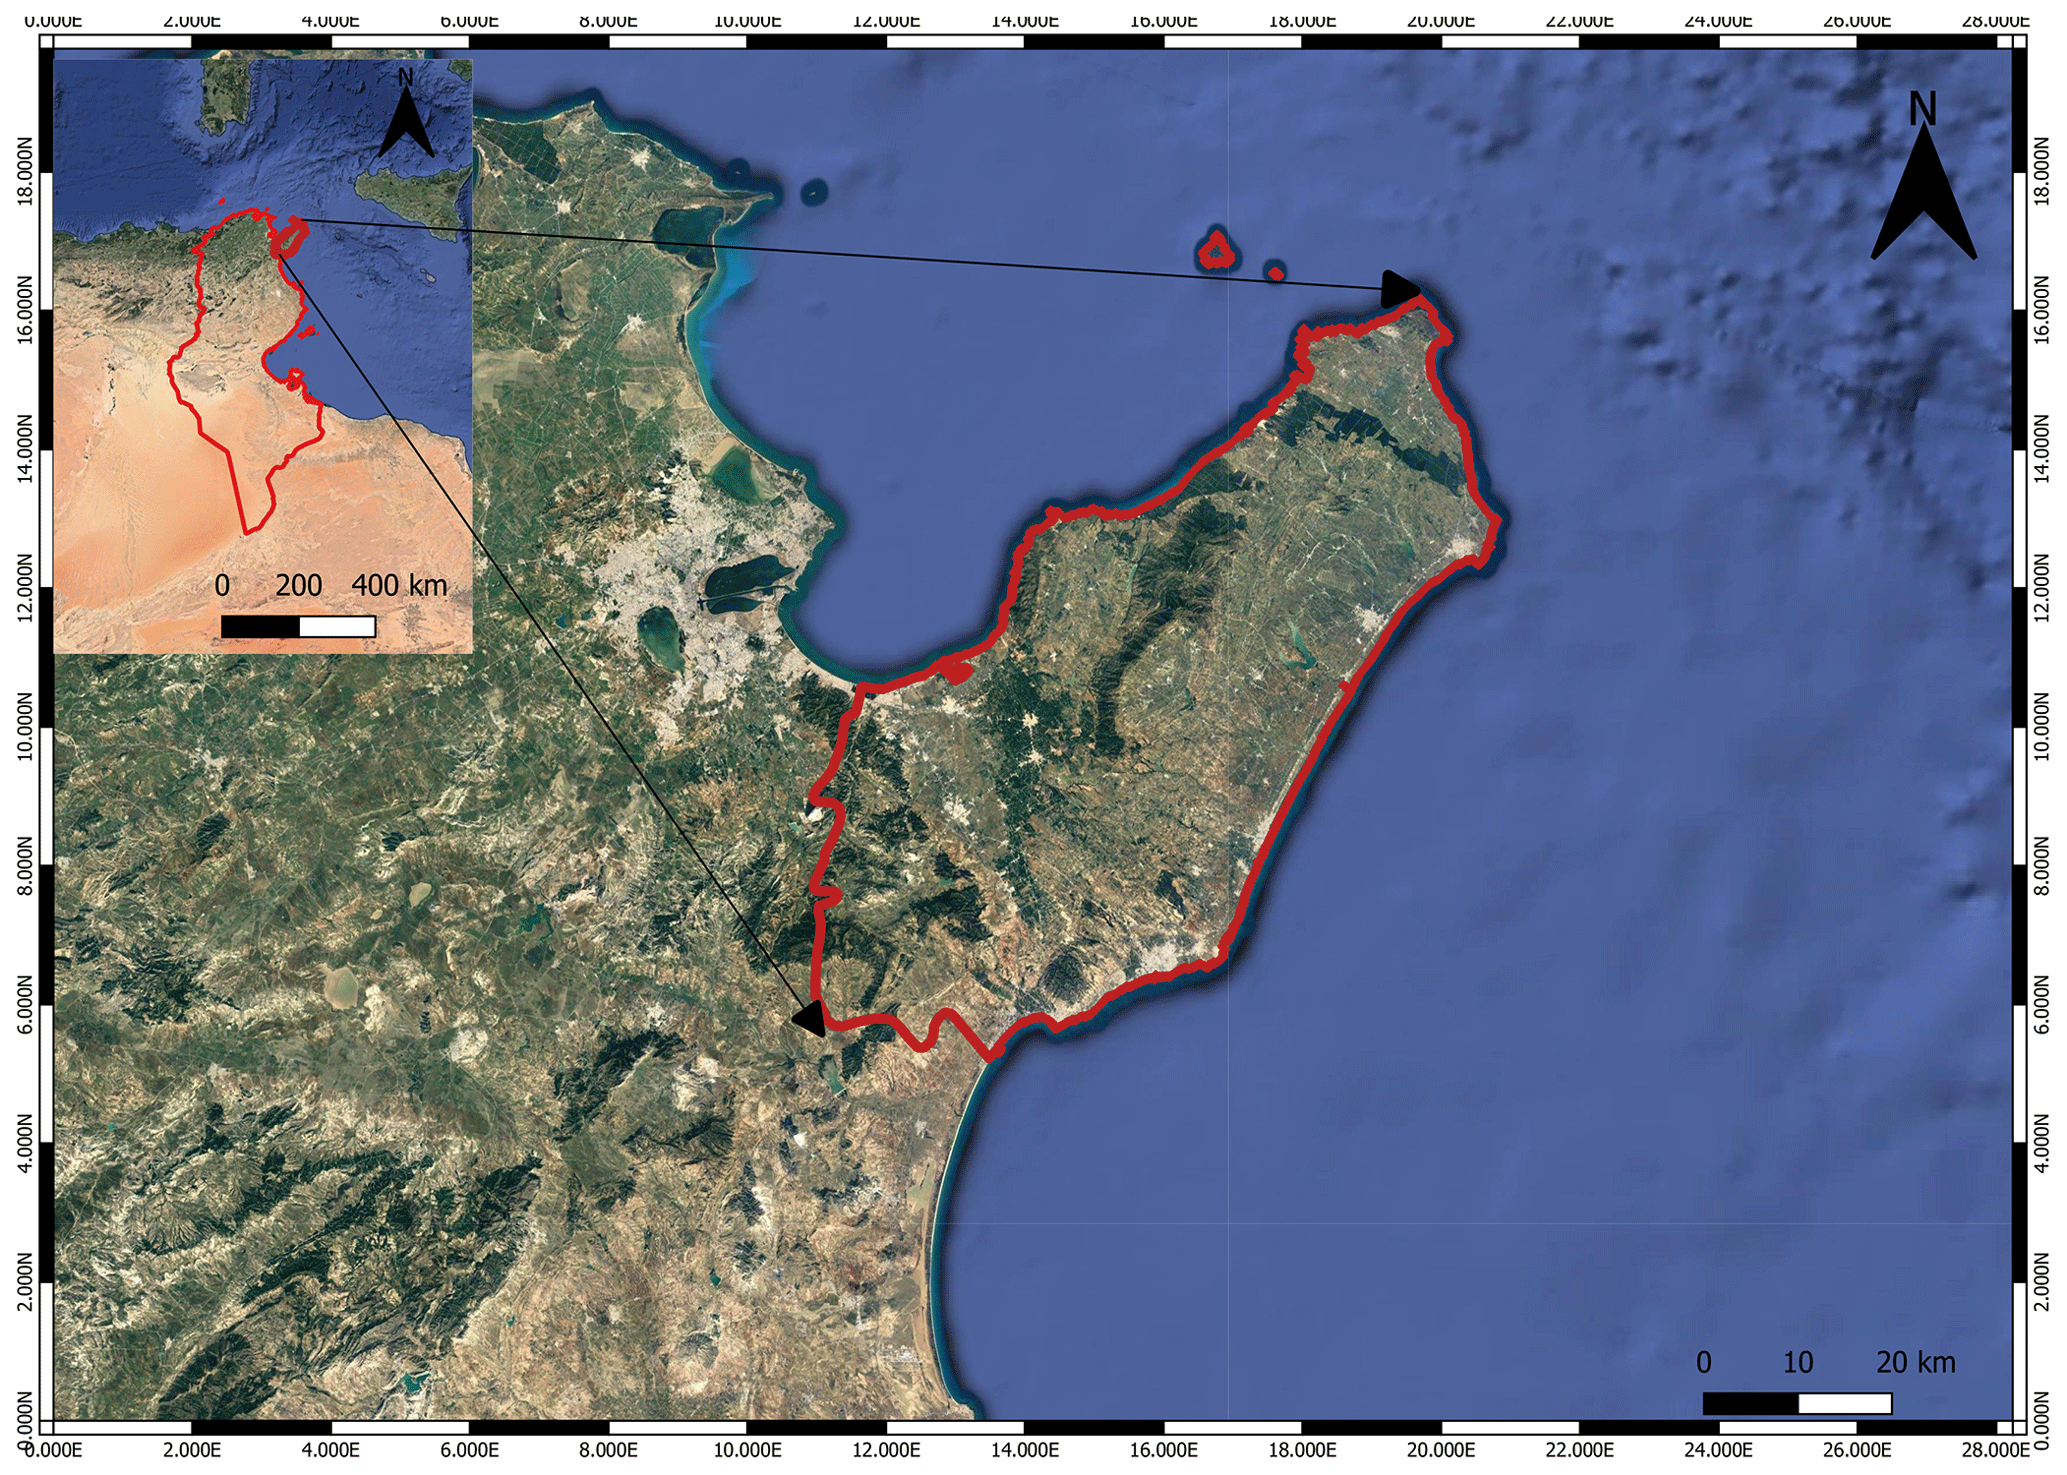
Land use and water resources are closely linked. Every single type of land use has a different influence on the hydrologic cycle, consequently impacting the people and the natural resources. The use of advanced technologies, for example monitoring the agricultural resources with remote sensing, offers the possibility to assess the water demand, to know the total cultivated area with the precise distribution of crops and enables the regularly acquisition of data distributed in space and time. The citrus sub-sector is of paramount importance in the Tunisian agricultural sector. The Cap Bon region has the main production area with 75 % of the total citrus area. The possibility of classifying citrus crops is important for water resource management at regional scale and for economic stability. Given the socio-economic importance of the citrus sector in the Cap Bon region, it is very important to have accurate estimation of the total area of citrus plots in this region. Therefore, the main objectives of this current work are:

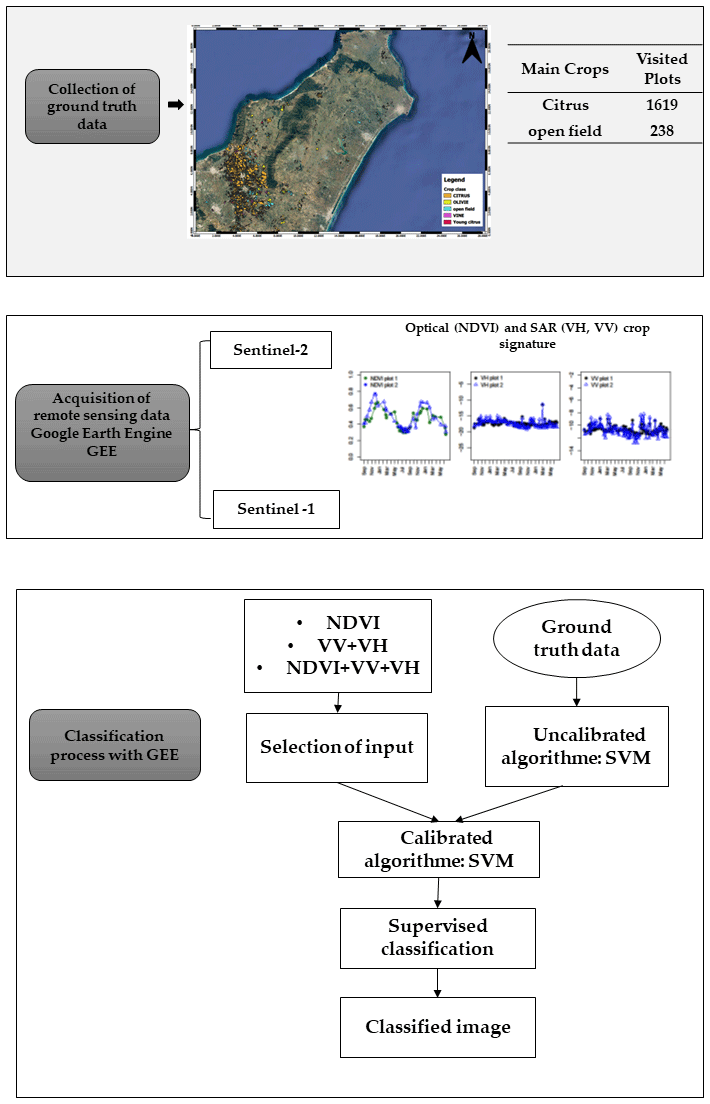
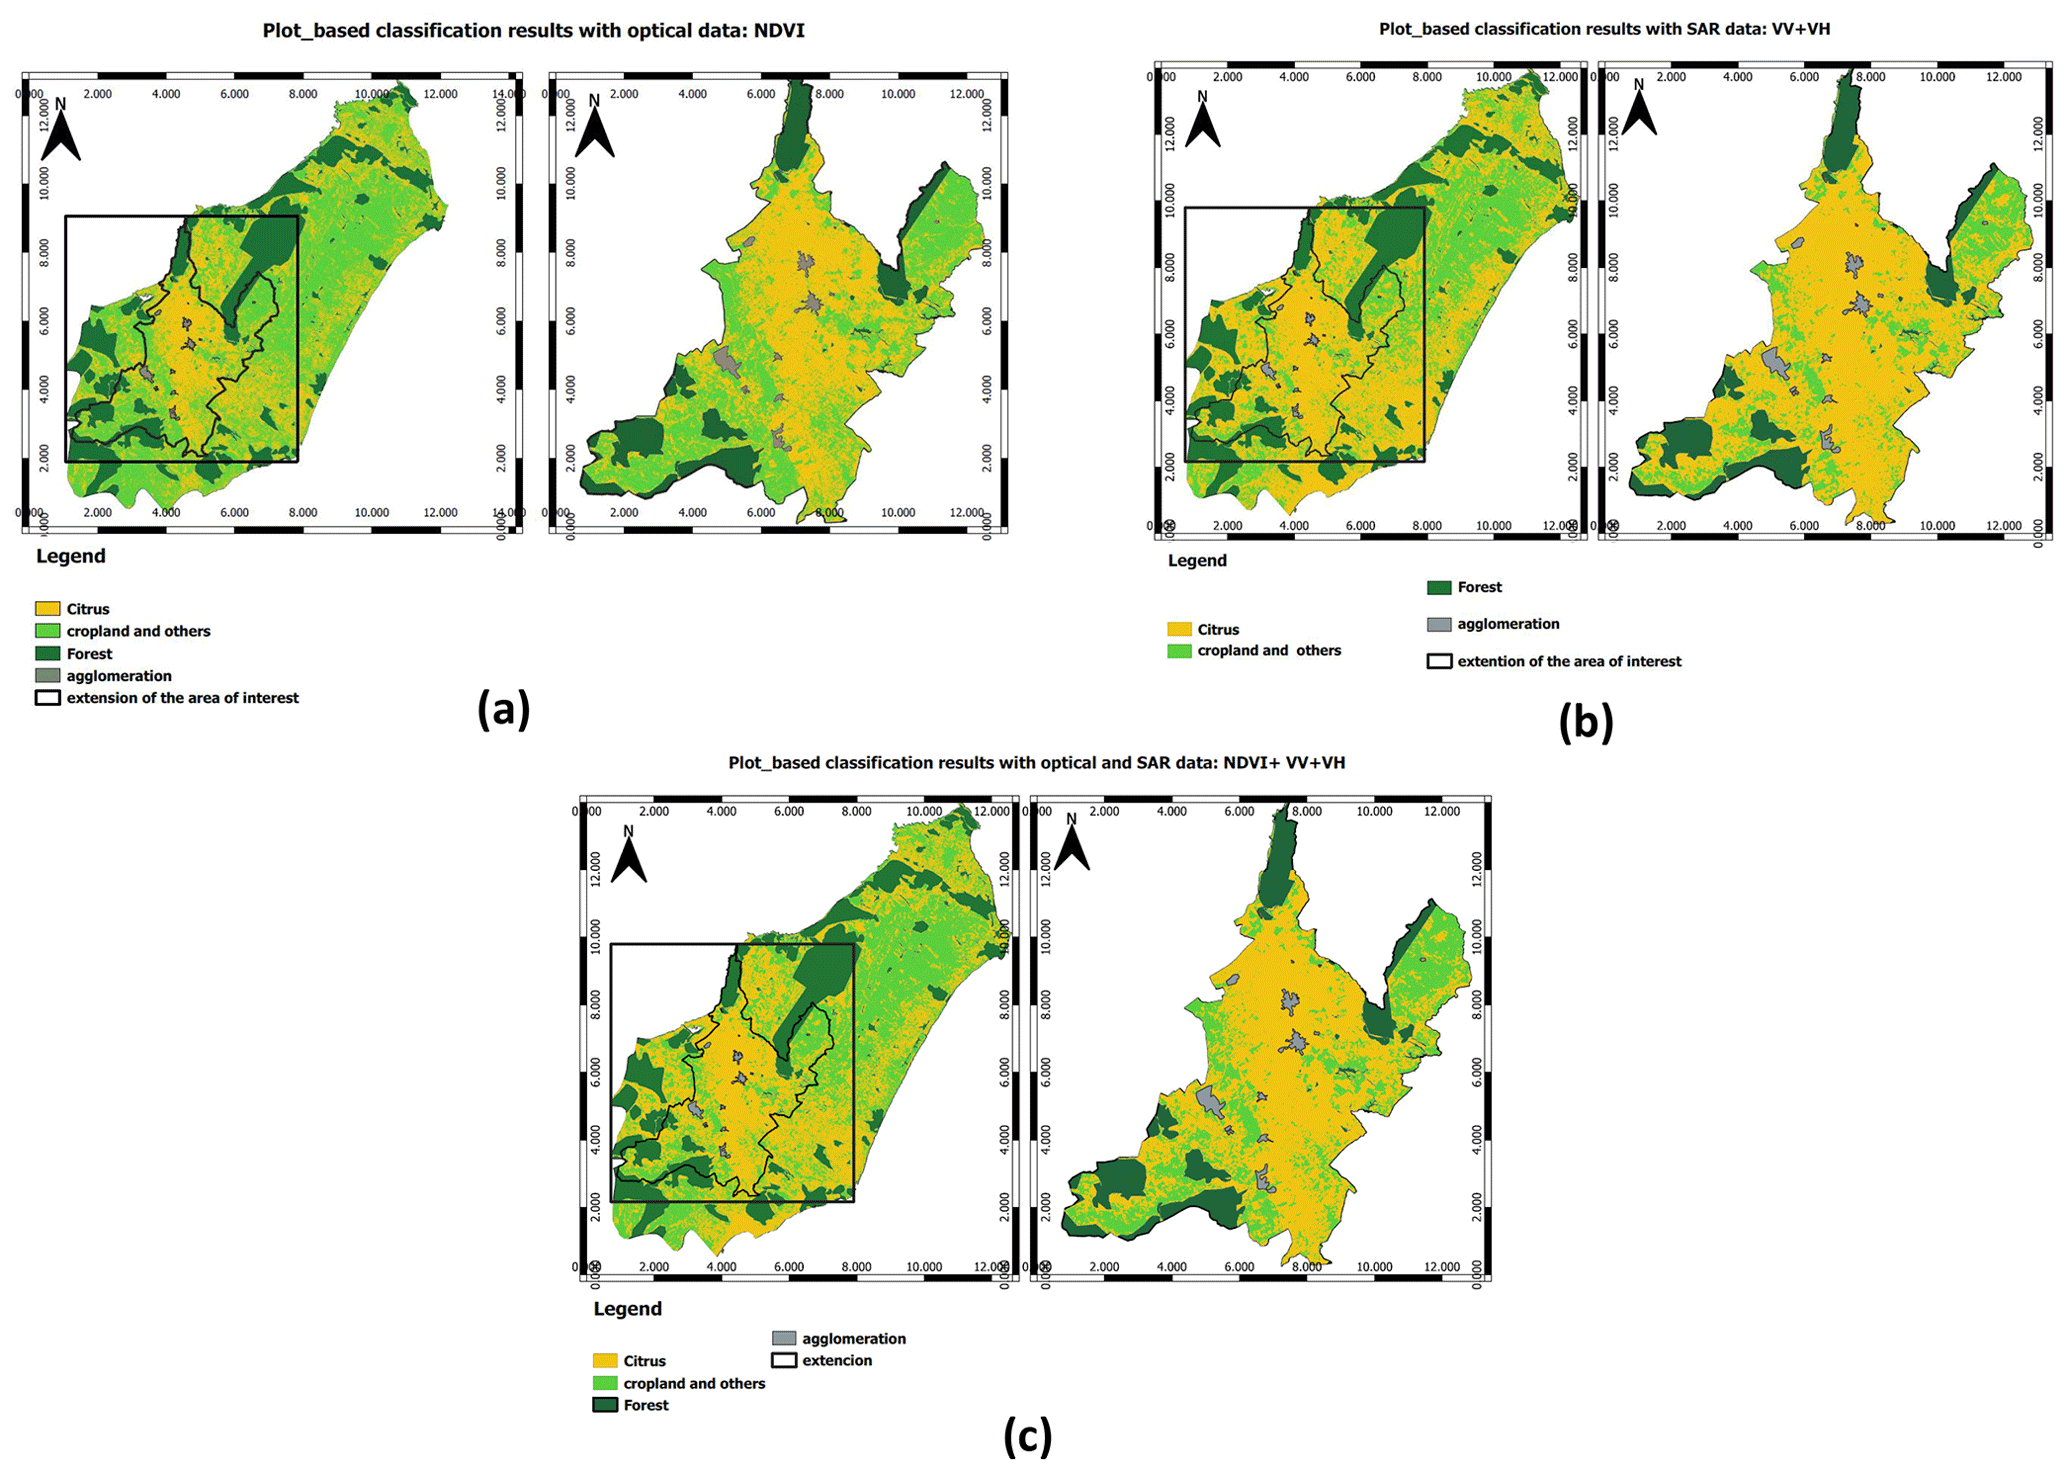
  • To integrate multitemporal synthetic aperture radar SAR data, Sentinel-1, and optical data Sentinel-2, together to determine the best machine learning algorithm that allowed obtaining the most accurate citrus crop classification in the region.

  • To study and analyze the temporal signatures of the Normalized Difference Vegetation Index (NDVI) of the classified crops, mainly the citrus, with the purpose to provide the maximum amount of information that allow the differentiation between the crops.

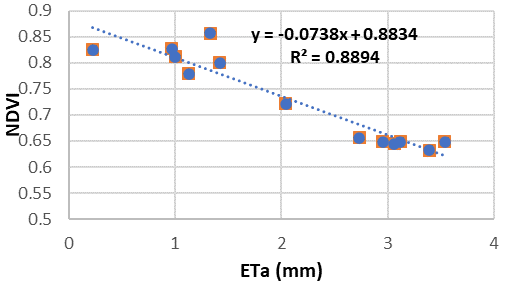
  • To study the potential relation between NDVI and Actual Evapotranspiration (ETa) fluxes measured with the eddy covariance method for a citrus orchard to extrapolate the eddy tower measurements to greater scales.

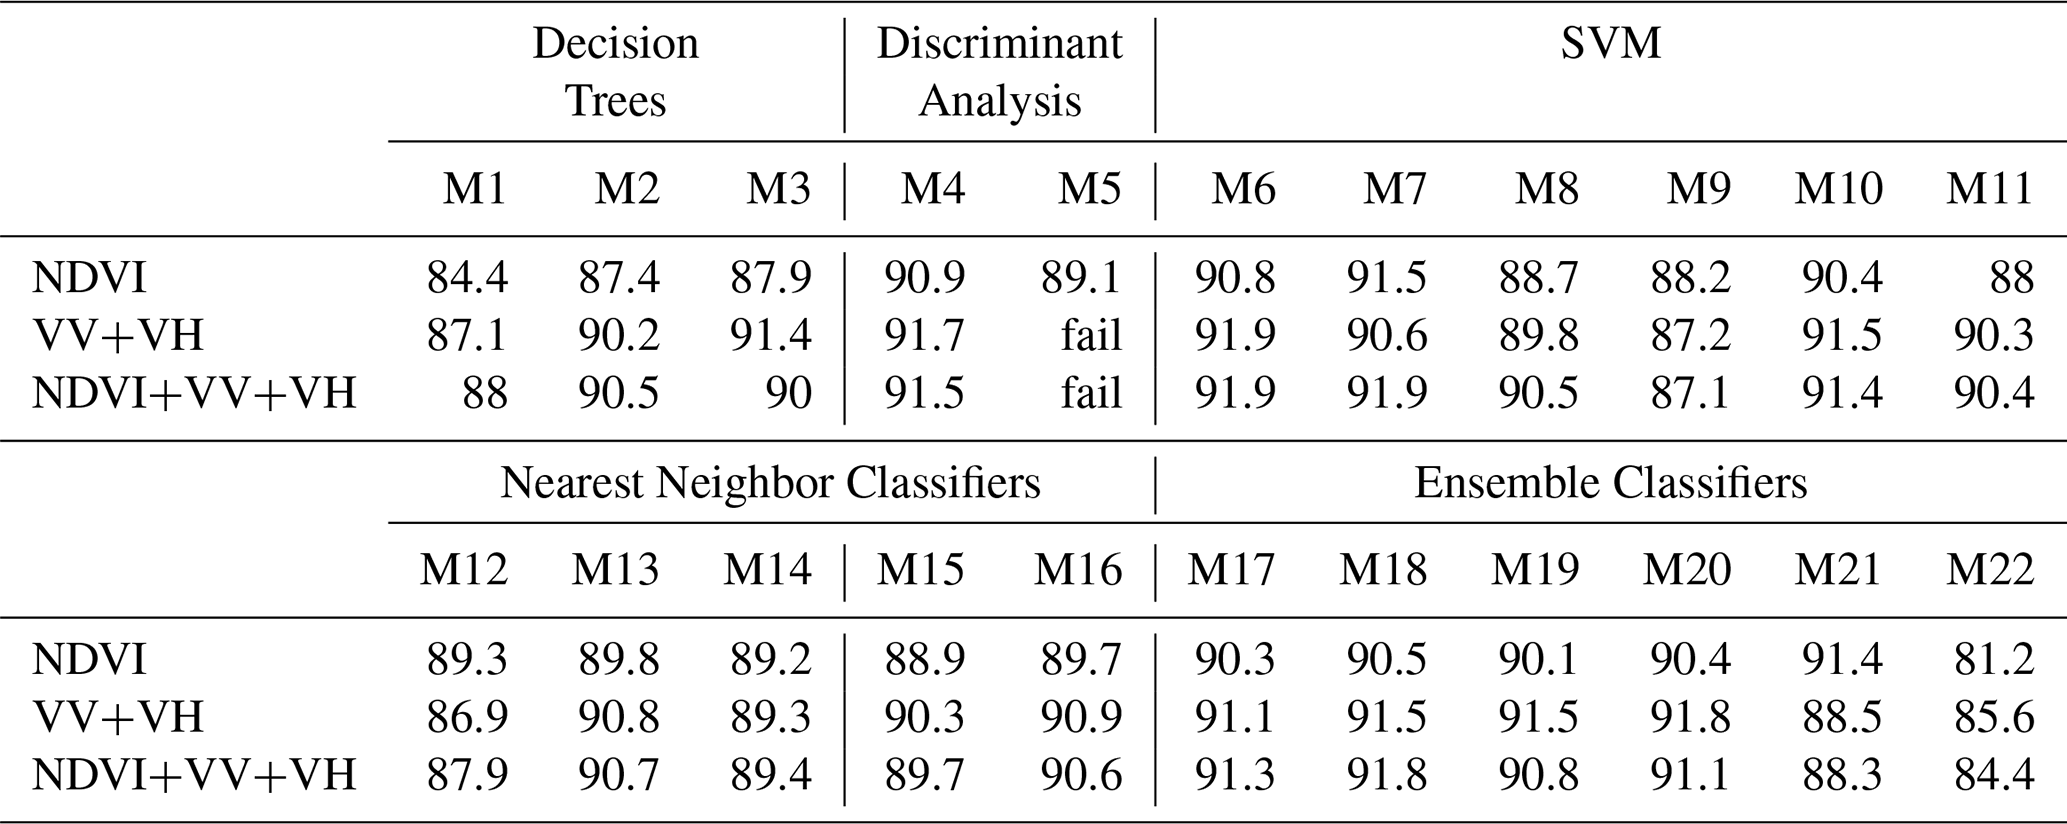
To achieve these objectives, we evaluated the performance of 22 nonparametric classifiers during the period September 2020–June 2021. Additionally, ET measured by the eddy covariance method was available for the same period, so we tried to find the potential relation between NDVI and Actual Evapotranspiration (ETa). The results revealed that the best performing classifier is the Support Vector Machine SVM with an accuracy around 91 %. Consequently, our results provided a significant contribution to the citrus classification in the Cap Bon region but can be further improved. Also, the obtained results highlighted the potential to extrapolate accurate ET estimation to larger scales using the vegetation index obtained from Sentinel-2 data.

Keywords

Sentinel-1; Sentinel-2; crop classification; citrus crop; Actual Evapotranspiration; Cap Bon

1 Introduction

The citrus sub-sector is of paramount importance in the Tunisian agricultural sector. The Cap Bon region is considered to be the main production area of citrus with 75 % of the total area (Zekri and Laajimi, 2001). Given the socio-economic importance of the citrus sector in the Cap Bon region, it is of principal importance to make an estimate of the total area of citrus plots and their spatial distribution, especially with the absence of up-to-date agricultural census data and their spatial distribution. The information obtained from this type of work will allow the estimation of water requirements of citrus orchards and the improvement of irrigation scheduling methodologies which need to be more precise as water and energy supplies became scarce. Citrus monitoring with remote sensing can provide an affordable and effective method to support field inspection efforts. SAR data can offer valuable information that can enhance optical remote sensing data and can be particularly beneficial for crop classification application.

Various studies have shown that satellite derived canopy cover and Vegetation Indices (VI's) have strong correlation with the crop coefficient Kc (Mateos et al., 2013; Er-Raki et al., 2007). The VI's such as, Normalized Difference Vegetation Index (NDVI), Soil Adjusted Vegetation Index (SAVI) and Transformed Soil Adjusted Vegetation Index (TSAVI) are widely used for of actual crop evapotranspiration (ETa) estimation (Glenn et al., 2011). Observation of these parameters over regional scale can be possible with high temporal resolution specially with actual satellite remote sensing products such Sentinel-2.

Therefore, the main objectives of this current work are:

  • integrate multitemporal synthetic aperture radar SAR data, Sentinel-1, and optical data Sentinel-2, together to determine the best machine learning algorithm that allowed obtaining the most accurate citrus crop classification in the region.

  • study and analyze the temporal signatures of the NDVI of the classified crops, mainly the citrus, with the purpose to provide the maximum amount of information that allow the differentiation between the crops.

  • study the potential relation between NDVI and observed ETa on a citrus orchard to extrapolate the eddy tower measurements to greater scales.

2 Materials and methods

2.1 Presentation of the study area

This study was carried out on the scale of the entire Cap Bon region (Fig. 1). The Cap Bon region covers 2840 km2. As for the climate, it varies from subhumid to semi-arid, and the average annual amounts of rain in the region vary between 390 and 630 mm. The study area is characterized by variable evaporation in time. The estimated total annual evapotranspiration exceeds 1100 mm (Hamouda, 2008). The dominant agricultural products are citrus, vineyards, spices, and vegetable culture (basically tomato, pepper, and strawberry).

https://piahs.copernicus.org/articles/385/443/2024/piahs-385-443-2024-f01

Figure 1Cap Bon Tunisia: The study area (caption from © Google Maps).

2.2 Field truth data collection

2.2.1 Land use

During this study, we conducted land visits and interviews with some farmers, we collected the coordinates of the locations of citrus plots with a portable GPS. In total we made three visits, in 18, 25 and 31 August 2021. In addition, most of acquired truth data have been carried out based on a laborious interpretation of the Google Earth Map based on two main criteria: First criterion: The windbreaks surround the citrus orchards. Second criterion: the planting density of citrus fruits which is usually of the order of 3 out of 5 and 5 out of 6. Finally, we were able to delimit 1857 plots. Based on the distribution of major crops in the region, the following vegetable coverage classes were selected: citrus and open field.

2.2.2 Actual evapotranspiration

Long term observation of ETa on citrus in the Cap Bon region have been acquired. A flux tower measuring ETa has been installed since 2004. Measurements are still in progress. Description of the orchard, instruments and calculations methods are in Zitouna-Chebbi et al. (2017).

2.3 Remote sensing data: Sentinel-1 and Sentinel-2 dataset

Currently the new cloud solution the Google Earth Engine GEE is receiving an increasing attention as a new settlement to search, extract and download Earth Observation EO data in a way that was not possible before (rapid access to large spatio-temporal data). Therefore, we decided to use GEE to download the Sentinel-1 and Sentinel-2 dataset for the period September 2019–June 2021. For the Sentinel-2 we used a command to calculate and download the NDVI scenes directly instead of downloading the red and NIR bands and calculate the NDVI for each available date. As for the Sentinel-1 data, we downloaded the VV, VH and angle of incidence bands which were processed by the GEE default processing streams.

https://piahs.copernicus.org/articles/385/443/2024/piahs-385-443-2024-f02

Figure 2Classification methodology scheme (caption from © Google Maps).

https://piahs.copernicus.org/articles/385/443/2024/piahs-385-443-2024-f03

Figure 3NDVI, VV and VH time series of two selected citrus plots.

Download

Table 1Overall Accuracy (OA) (expressed in (%)) of the different classification methods with the available information.

Download Print Version | Download XLSX

2.4 Classification methodology

One of the objectives of this study is to evaluate the effectiveness of the incorporation of Sentinel-1 time series data with optical remote sensing data of Sentinel-2 for citrus classification. We performed the evaluation of the performance of the 22 non-parametric classifiers with the integration of SAR data, to classify citrus trees. We applied the developed methodology (Chakhar et al., 2021) to Cap Bon case study. Therefore, following we present the adapted methodology:

  • Data collection. We downloaded optical (Sentinel-2) and SAR (Sentinel-1) data during the period September 2019–June 2021 from GEE platform. Concerning the ground truth data, were collected by visual interpretation using very high resolution (VHR) Google Earth imagery and land visits.

  • Data preparation. In pursuit of the preprocessing process, we extracted two features from the Sentinel-1 data set: VH, VV. We computed the mean of these features at the level of plot (plot-based approach) for each available date of Sentinel-1 and Sentinel-2 time series.

  • Assessing the accuracy of multiple classification algorithms. In this step set of 22 classification algorithms was evaluated including decision trees, discriminant analysis, support vector machines, nearest neighbor and ensemble classifiers. These algorithms are the most frequent algorithms used in the literature. The Classification Learner application of Matlab® was utilized with the aim of calibrating and validating the different algorithms. The Classification Learner app can be found in the latest versions of the Statistics and Machine Learning toolbox of Matlab. Given that one of the critical issues for the use of SAR time series is the choice of the features used for the classification, we decided to evaluate VV and VH SAR features. The approach is about the combination of these feature with NDVI. Three classification scenarios based on the selection of the input feature were then applied for all the available dates:

    • The first scenario: only the optical feature was used as input.

    • The second scenario: VV and the VH channels derived from SAR data.

    • The third scenario: NDVI, the VV and VH channels.

    Classification process with GEE: The proposed classification method is presented in Fig. 2. The applied methodology was entirely based on the use of the GEE cloud platform environment. The method started with the collection of the ground truth data. The second step consisted in downloading the available dataset Sentinel-1 and -2 corresponding for the study area and the required period from the GEE catalogue and building a consistent time-series. Afterward the evaluation of the accuracy of 22 classification algorithms was done and the identification of the most accurate classifiers for all the scenarios was performed and revealed the outperformance of SVM. Finally, the classification process was accomplished with the SVM algorithm within the GEE platform, and we have tried it with the three scenarios (NDVI, VV+VH, NDVI+VV+VH).

3 Results

3.1 Analysis of Temporal Signatures of citrus

Figure 3 shows NDVI, VV, VH time series for two selected plots for the period September 2019–June 2021. The graph showed the minimum and maximum NDVI founded values, respectively, in Summer (June–August) and in Autumn–Winter (January–February/October–December), the same statement was made in Vanella et al. (2020). The time-series of NDVI of these two selected plots have demonstrated a standard annual shape (Vanella et al., 2020; Sawant et al., 2016) originating from the sum of two contributions (i) the stable vegetation dynamic of citrus trees and (ii) the presence of grassed soil. Days of minimum NDVI were in the summer months (June–August) justified by low canopy increase due to peak of water stress (Sawant et al., 2016).

https://piahs.copernicus.org/articles/385/443/2024/piahs-385-443-2024-f04

Figure 4Cap Bon citrus maps obtained by the SVM classifiers for each adopted scenarios: (a) with NDVI as input data, (b) with VV+VH as input and (c) with NDVI+VV+VH as input data.

3.2 Evaluation of Classification Methods for Crop Classification

The results of using only Sentinel-2 information (NDVI), only Sentinel-1 information (VV+VH) and a combination of both sources of information (NDVI+VV+VH) were obtained for the evaluated classification methods. A comparison between the 22 classification methods with the different combinations of available information is shown in Table 1. Among the tested classifications algorithms and for the three scenarios, the best algorithm is the Support Vector Machine SVM, with an Overall Accuracy (OA) = 91.5 % for the first scenario, OA = 91.9 % for the second scenario and OA = 91.9 % for the third scenario.

3.3 Evaluation of Classification results

Figure 4 shows the classification maps of the three adopted scenarios using the SVM classifiers. These classification maps did not offer high OA. The first scenario provided an OA = 67 %, while the second scenario supplied a slight high OA than the first scenario equal to 69 % and the third scenario had an OA = 73 %. However overly all the classification results overestimate the total area of citrus plots.

3.4 Relation between NDVI and ETa measured with the eddy.

With the objective to extrapolate ETa to larger scales using the vegetation index obtained from Sentinel-2 data, we studied, for the same period of classification 2019–2021 the potential relation between NDVI, and ETa fluxes measured with the eddy covariance method installed in an experimental citrus orchard located in the study area. Figure 5 showed that linear relationships between NDVI and ETa with a high coefficient of determination R2=0.89 indicating a promising result that can be extrapolated to larger scale.

https://piahs.copernicus.org/articles/385/443/2024/piahs-385-443-2024-f05

Figure 5Vegetation index NDVI–ETa relationship of an experimental plot in the study.

Download

4 Conclusions

Image classification results were obtained with GEE for the three adopted scenario (NDVI; VV+VH; NDVI+VV+VH). We found that for all these classification scenarios there is an overestimation of the total area of citrus plots. Therefore, we think that these classification results can be further improved because GEE does not offer the option to work with all the time-series of the input data, instead it reduces the selected dataset to a single image containing each image's information to perform the classification. Consequently, for future classification tasks we are going to try to use all the time-series dataset by adapting the Datacubes methodology combined with the specific Local Nested Grid. Concerning the relation between NDVI and ETa fluxes measured with the eddy covariance indicates promising result that can be extrapolated to larger scale.

Data availability

The underlying research data is currently not publicly available due to privacy. The Sentinel-1 and Sentinel-2 images, scenes are provided by https://dataspace.copernicus.eu/ (Copernicus Open Access Hub, 2023).

Author contributions

Conceptualization, DHL, MAM and RZC; data curation, AC; formal analysis, AC, DHL and MAM; funding acquisition, DHL, RB and MAM; investigation, AC, DHL and IM; methodology, AC, DHL and MAM; project administration, RB; resources, RB and MAM; software, DHL, and MAM; supervision, DHL and MAM; visualization, AC; writing – original draft, AC; writing – review and editing, AC and MAM. All authors have read and agreed to the published version of the manuscript.

Competing interests

The contact author has declared that none of the authors has any competing interests.

Disclaimer

Publisher's note: Copernicus Publications remains neutral with regard to jurisdictional claims made in the text, published maps, institutional affiliations, or any other geographical representation in this paper. While Copernicus Publications makes every effort to include appropriate place names, the final responsibility lies with the authors.

Special issue statement

This article is part of the special issue “IAHS2022 – Hydrological sciences in the Anthropocene: Past and future of open, inclusive, innovative, and society-interfacing approaches”. It is a result of the XIth Scientific Assembly of the International Association of Hydrological Sciences (IAHS 2022), Montpellier, France, 29 May–3 June 2022.

Acknowledgements

This work was supported by H2020-MSCA-RISE-2018 ACCWA project and Water JPI 2018 FLUXMED project.

Financial support

This research has been supported by the University of Castilla–La Mancha for funding a Ph.D. grant for Amal Chakhar (“Predoctoral contract for research staff in training within the framework of the I+D+i plan, has been co-financed by the European Social Fund ESF within the 2014–2020 Operational Plan of Castila-La Mancha”).

Review statement

This paper was edited by Christophe Cudennec and reviewed by two anonymous referees.

References

Chakhar, A., Hernández-López, D., Ballesteros, R., and Moreno, M. A.: Improving the Accuracy of Multiple Algorithms for Crop Classification by Integrating Sentinel-1 Observations with Sentinel-2 Data, Remote Sens., 13, 1–21, https://doi.org/10.3390/rs13020243, 2021. 

Copernicus Open Access Hub: Sentinel-2 archives, https://sentinels.copernicus.eu/web/sentinel/missions/sentinel-2/data-products, last access: 12 December 2023. 

Er-Raki, S., Chehbouni, A., Guemouria, N., Duchemin, B., Ezzahar, J., and Hadria, R.: Combining FAO-56 Model and Ground-Based Remote Sensing to Estimate Water Consumptions of Wheat Crops in a Semi-Arid Region, Agr. Water Manage., 87, 41–54, https://doi.org/10.1016/j.agwat.2006.02.004, 2007. 

Glenn, E. P., Christopher, M. U. N., Hunsaker, D. J., and Nagler, P. L.: Vegetation Index-Based Crop Coefficients to Estimate Evapotranspiration by Remote Sensing in Agricultural and Natural Ecosystems, Hydrol. Process., 25, 4050–4062, https://doi.org/10.1002/hyp.8392, 2011. 

Hamouda, M. F. B.: Approche Hydrogéologique et Isotopique Des Systèmes Aquifères Côtiers Du Cap Bon: Cas Des Nappes de La Côte Orientale et d'El Haouaria, Tunisie, PhD, INAT, 2008. 

Mateos, L., González-Dugo, M. P., Testi, L., and Villalobos, F. J.: Monitoring Evapotranspiration of Irrigated Crops Using Crop Coefficients Derived from Time Series of Satellite Images. I. Method Validation, Agr. Water Manage., 125, 81–91, https://doi.org/10.1016/j.agwat.2012.11.005, 2013. 

Sawant, S. A., Chakraborty, M., Suradhaniwar, S., Adinarayana, J., and Durbha, S. S.: TIME SERIES ANALYSIS OF REMOTE SENSING OBSERVATIONS FOR CITRUS CROP GROWTH STAGE AND EVAPOTRANSPIRATION ESTIMATION, Int. Arch. Photogramm. Remote Sens. Spatial Inf. Sci., XLI-B8, 1037–1042, https://doi.org/10.5194/isprs-archives-XLI-B8-1037-2016, 2016. 

Vanella, D., Consoli, S., Ramírez-Cuesta, J. M., and Tessitori, M.: Suitability of the MODIS-NDVI Time-Series for a Posteriori Evaluation of the Citrus Tristeza Virus Epidemic, Remote Sens., 12, 12, https://doi.org/10.3390/rs12121965, 2020. 

Zekri, S. and Laajimi, A.: Etude de La Compétitivité Du Sous-Secteur Agrumicole En Tunisie”, Cahier Opt. Médit, January 2001, 9–16, https://www.researchgate.net/publication/235980822_Etude_de_la_Competitivite_du_Sous-secteur_Agrumicole_en_Tunisie (last access: 12 December 2023), 2001. 

Zitouna-Chebbi, R., Mahjoub, I., Mekki, I., and Ben Mechlia, N.: Comparing evapotranspiration rates estimated from atmospheric flux, soil water balance and fao56 method of a small orange orchard in Tunisia, Acta Hortic., 1150, 23–30, https://doi.org/10.17660/ActaHortic.2017.1150.4, 2017. 

Download
Short summary
It is very important to have accurate estimation of the total area of citrus plots. To achieve this objective, we performed crop classification using Sentinel-1 and -2. Additionally, ETa was available, so we tried to find it is potential relation with NDVI. The results were obtained with the classifier SVM using GEE Google Earth Engine and provided a significant contribution to the citrus crop classification also highlighted the potential to extrapolate accurate ET estimation to larger scales.