the Creative Commons Attribution 4.0 License.
the Creative Commons Attribution 4.0 License.
 | 19 Apr 2024
Qualitative flood risk assessment for road and railway infrastructures: the experience of the MOVIDA project
Natasha Petruccelli
Luca Mantecchini
Alice Gallazzi
Daniela Molinari
Mohammed Hammouti
Marco Zazzeri
Simone Sterlacchini
Francesco Ballio
Armando Brath
Alessio Domeneghetti
The Po River District Authority promoted the MOVIDA project with the aim to define appropriate methodologies for flood risk assessment and being compliant with the European Floods Directive (Directive 2007/60/EC). A dedicated Open Source Geographic Information System (i.e. QGIS geoprocessing modules) has been developed for mapping the expected damages in all areas at significant risk in the Po District (Northern Italy), considering five categories of exposed elements (population, infrastructures, economic activities, environmental and cultural heritage, and na-tech sites). Focusing on road and railway infrastructures, the methodology proposed within the project adopts information coming from different data sources (Regional Geoportals, Open Street Map, etc.) and allows to qualitatively estimate the potential risk associated with a flood event. Different risk classes (High, Medium, Low and Null) are assigned in relation to roads category (i.e., Highways, Main, Secondary, Service, Other) or railways type (High-Speed train or not), thus considering both the relevance of the infrastructure itself (as well as its topographical characteristics: e.g. tunnel, bridge, etc.) and the magnitude of the expected event (i.e., hazard). The definition of the risk matrix led to the estimation of the lengths of the sections exposed to different risk levels, which is useful to support the definition of potential mitigation measures and support the competent bodies in the organization of the rescue.
- Article
(6278 KB) - Full-text XML
- BibTeX
- EndNote


Flood risk; infrastructures; road; railway; risk levels; expected impact
Damages of hydrological origin represent about 37 % of all-natural disasters related ones (geophysical, meteorological, biological; CRED and UNDRR, 2021). In particular, flood represents one of the most frequent and widespread type of natural risk globally (Adhikari et al., 2010). In the last 20 years, the number of floods has more than doubled compared to the previous two decades and their further increase worldwide is expected due to climate change (Tanoue et al., 2016; Blöschl et al., 2019), likely causing a progressive rise in damage because of the greater concentration of the population in the most exposed areas (Ferreira et al., 2018) and to economic growth. The development of flood risk management and mitigation policies, promoted at EU level by the Floods Directive (Directive 2007/60/EC), pushed the entire scientific community towards the definition of methodologies capable to assess flood-related damages to the different exposed assets and support the Cost-Benefit Analysis (CBA) of mitigation measures. With the intent of upgrading the flood risk management plan for the Po River District (the largest basin in Italy), the Po River Basin Authority (AdBPo) funded the MOVIDA project (MOdello per la Valutazione Integrata del Danno Alluvionale – MOdel for the integrated assessment of flood damage) to assess flood-related damage to several elements (i.e., population, infrastructures, economic activities, environmental and cultural heritage, and na-tech sites) in all areas classified at significant risk of inundation (APSFR). This paper briefly summarizes the procedure developed for the qualitative assessment of the flood risk to road and railway infrastructures.
The transport system plays a fundamental role in the economic and social development of a country; a physical failure of the network or a traffic interruption, caused by the presence of water on the infrastructure, can lead to significant socio-economic losses (Kellermann et al., 2015; Zhang and Alipour, 2021). In the literature, there are several studies attempting to quantify the direct and indirect damages suffered by infrastructures and vehicles in circulation; however, in most of the cases a detailed description of the exposure and vulnerability of the network is still hampered by lack of information. This study reports expert-based (for road) and data-driven (for railway) approaches developed to sustain a large exposure classification of linear infrastructures. Referring to the road and railway network of one region of the Po River District (i.e., the Emilia-Romagna region), the scope was the attribution of risk classes to exposed infrastructure sections, based on their structural and functional characteristics (e.g. type of traction, traffic flows, etc.), as well as on inundation characteristics. This enables the identification of the most critical sections of the network, which is essential to strengthening the system's resilience and adaptability to natural disasters, such as floods.
The analysis concerns the regional territory of Emilia-Romagna falling within the Hydrographic District of the Po River. 7 APSFR (out of 22 identified at the district level by the Flood Risk Management Plan – FRMP) are in the study area (as shown in Fig. 1), with an extent of about 3500 km2 corresponding to 16 % of the total regional area.
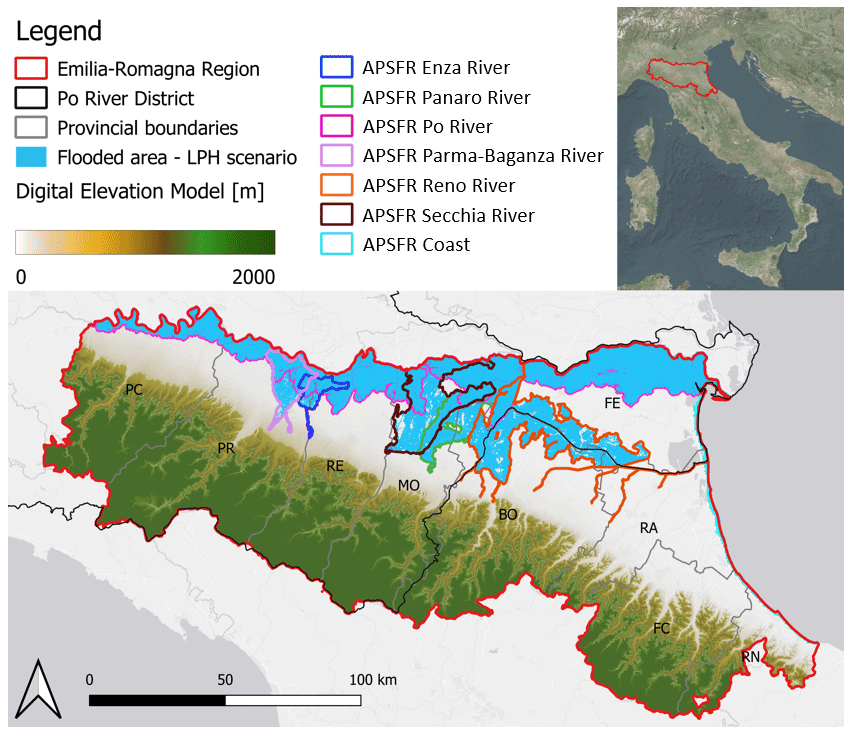
Figure 1Study area and regional APSFRs.
For each APSFR, the FRMP provides hazard maps (i.e., inundation depth; spatial resolution of 5–10 m) for three probability scenarios, according to Floods Directive: Low Probability Hazard (LPH – 500-year return period), Medium Probability Hazard (MPH – 200-year return period) and High Probability Hazard (HPH – 50-year return period). These maps, superimposed on the graphs of the transport network, identify the sections exposed to potential inundations. Concerning the transportation network, a detailed database containing the physical and functional characteristics of the infrastructures was built. For both roads and railways, reference has been made to Open Street Map (OSM), whose information has been integrated with that coming from the Regional Geoportal (https://geoportale.regione.emilia-romagna.it, last access: March 2021). Roads were classified by order of importance (e.g., Highway, Main, Secondary, Service or Dirt, Other) and in the light of topological characteristics: roads in elevation (bridge, viaduct, overpass) and tunnels (underpass). For railways, the Integrated Regional Transport Plan (Piano Regionale Integrato dei Trasporti, 2021) was also consulted to associate the number of tracks, the category and the type of traction to each section of the network. Data regarding the number and train typology in transit along a given railway arch in a specific period of time were also collected. The latter data were used to quantify the load on the network by two different types of users: passengers and freight. In particular, traffic data relating to any midweek working day were collected, as regards passenger flows, while data concerning freight train traffic were acquired over a weekly period. A real traffic value was therefore associated with each arch. In addition, the OSM information layer was intersected with that of the buildings of the Regional Topographical database to evaluate the presence of any railway station exposed to flood risk.
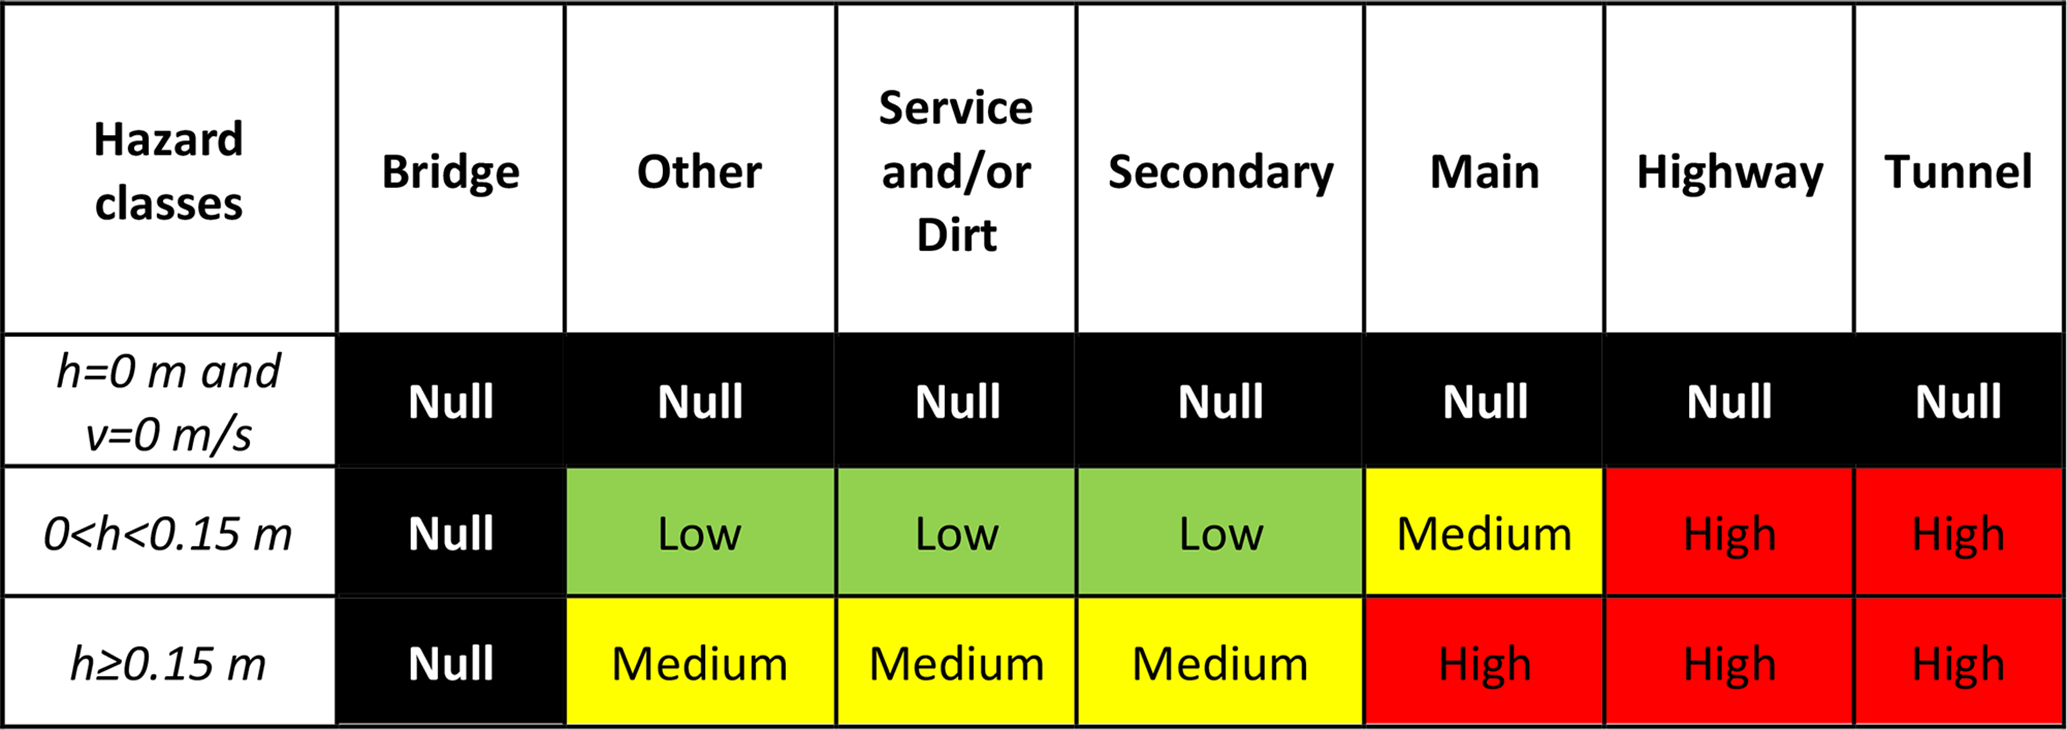
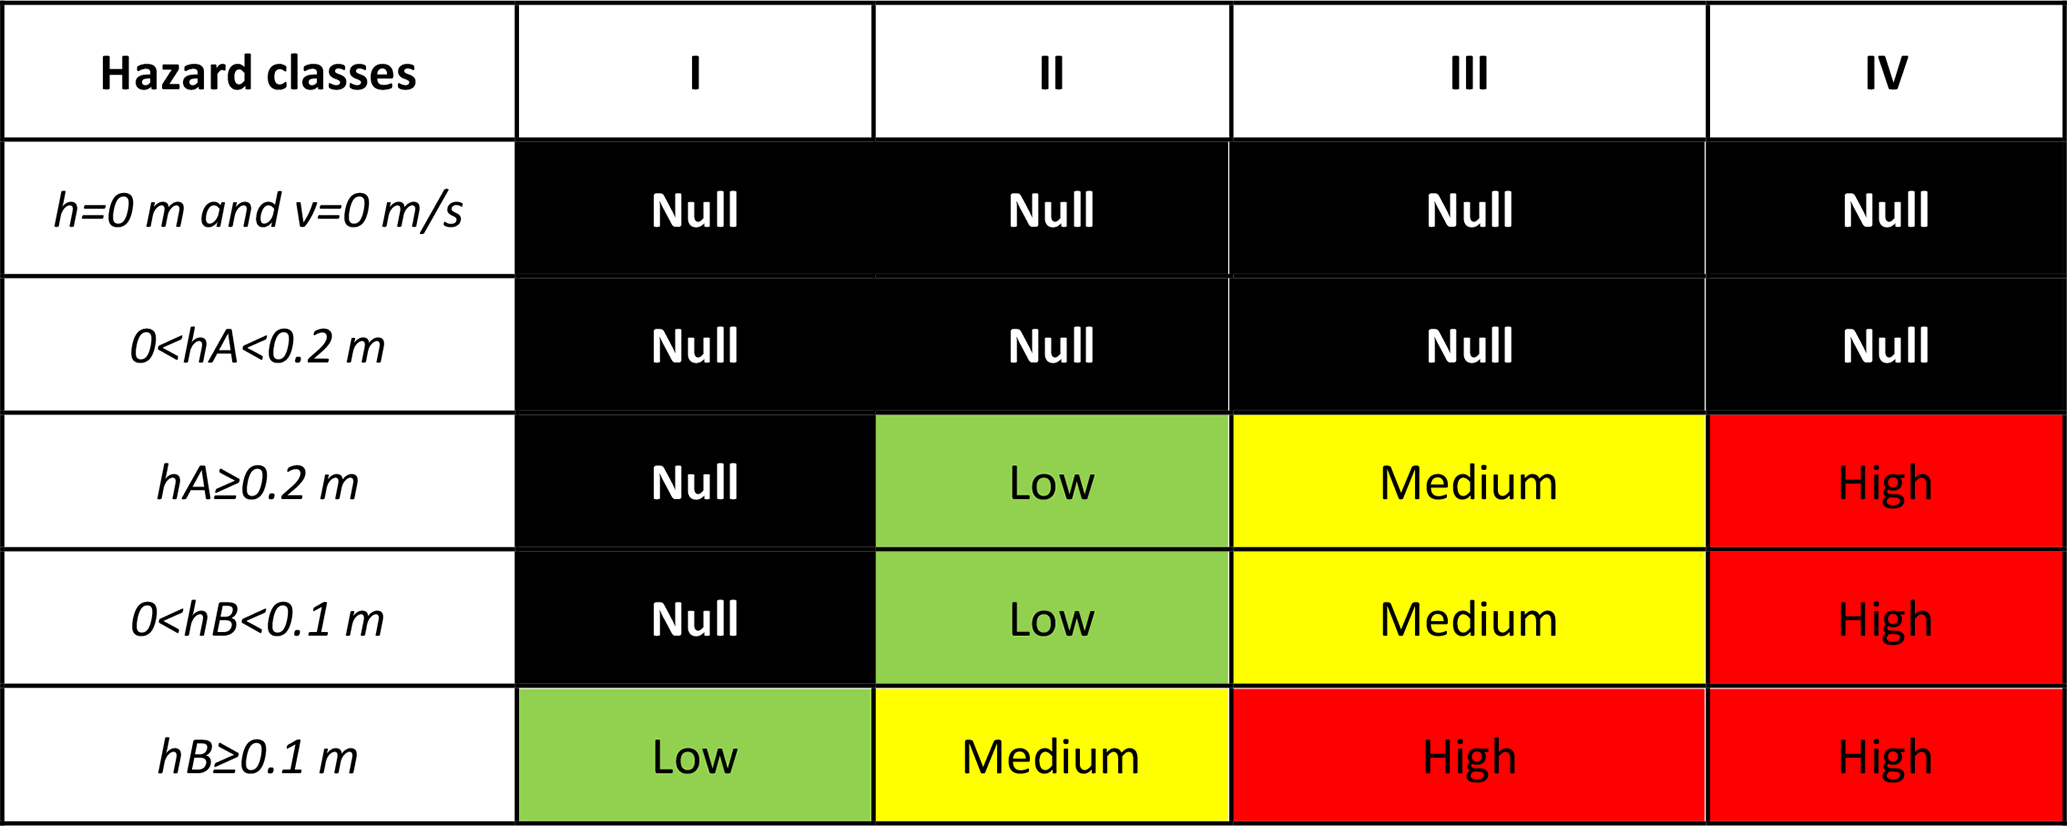
Functional damages associated with the operability of a given infrastructure are in many cases of greater importance than physical damages (Pregnolato et al., 2017). In this work we propose a methodology for the assessment, in qualitative terms (i.e., null, low, medium, high), of the functional risk associated to the network about a specific flood event. Despite the singularities of the systems, the approach developed for road and railway infrastructures is similar and involves the definition of a risk matrix resulting from the combination of two sub-matrices: (i) a first one representative of the impact of the flood event in terms of slowdown or interruption of vehicular transit (depending on the hazardous variables; i.e. hydraulic load or water depth); a second one (ii) indicating the uniqueness of the performance services offered by the infrastructure, which depends on the type of flooded section. The overall risk matrix is obtained by carrying out a weighted average of the aforementioned matrices and consulting the existing literature (Kramer et al., 2016; Pregnolato et al., 2017; Kellermann et al., 2015) for the definition of the different hazardous thresholds. Specifically, those cases are foreseen as regards road infrastructures: (i) no risk to road sections with average water depth and average water velocity equal to zero, as well as for roads at high altitude; (ii) a high risk on the most critical sections in case of flooding (i.e., tunnels); (iii) a variable risk on the remaining sections, depending on the hazard and vulnerability (as Table 1 depicts). For railways, the definition of the risk in Table 2 matrix is more complex. Unlike roads, two possible scenarios have been distinguished: (A) the railway line is close to the flooding front, but not directly affected by water; this causes trains to slow down and, in the case of significant loads or water depth, the activation of the monitoring service due to risk of erosion; (B) the railway line is surmounted with possible damage to the power supply system and possible transit interruption caused by the compromised stability of the roadbed and embankment.
Rail journeys are linked to the stations of origin and destination; thus, it is possible to build the arch-paths incidence matrix associating the traffic values to each railway arch. This information, together with the structural and functional characteristics of the network, reveals the importance of the railway section and, therefore, how severe the consequences are expected in case of its interruption. Attribution of relevance class to each arch (from I to IV, associate with higher relevance) was carried out through a multi-criteria analysis by weighing the characteristics of each arch: type of traction, category and number of trains in transit. In particular, as regards passenger transport, a weight (wtrac) of 0.5 has been assigned to diesel traction, to reduce the contribution of the minor lines where this technology is still present, while electric traction has been assigned a unit value. To the four present arch categories (Regional, National 1-track, National 2-track and High-Speed line), weights (wcat) between 0.25 (for regional lines) and 1 (for High-Speed lines) have been attributed. The weight of train traffic on each network arch (wflux) was evaluated by normalizing this variable among maximum and minimum values observed on the overall network, which result on a weight that varies continuously between 0 and 1. With this approach, each arch of the network was assessed by adopting a specific index (pequi), expressed in terms of the number of equivalent passengers, estimated using the following expression:
where npas represents the number of passengers travelling along each arch, calculated in relation to the type of train in transit and its transport capacity. Four different relevance classes have been identified based on pequi (as illustrated in Fig. 2 in the top panel). A similar approach was used for freight transport (depicted in Fig. 2 in the bottom panel), according to the values assumed by the index fequi evaluated as:
where the number of trains in transit was transformed into the number of equivalent trains (trequ) considering the type of freight train. A maximum value of 3 has been assigned to Combined Trains – CT (international freight trains used for the intermodal transport of trucks, semi-trailers etc.), a minimum of 1 to the Terminal Trains – TT (freight trains in terminal service to and from a shunting area to railway yard). The relative weight of the type of traction is unchanged with respect to the previous case, while, for the classes inherent to category, the weight attributed to the High-Speed lines has been changed (set equal to 0.25), as these are of marginal importance for the freight transit.
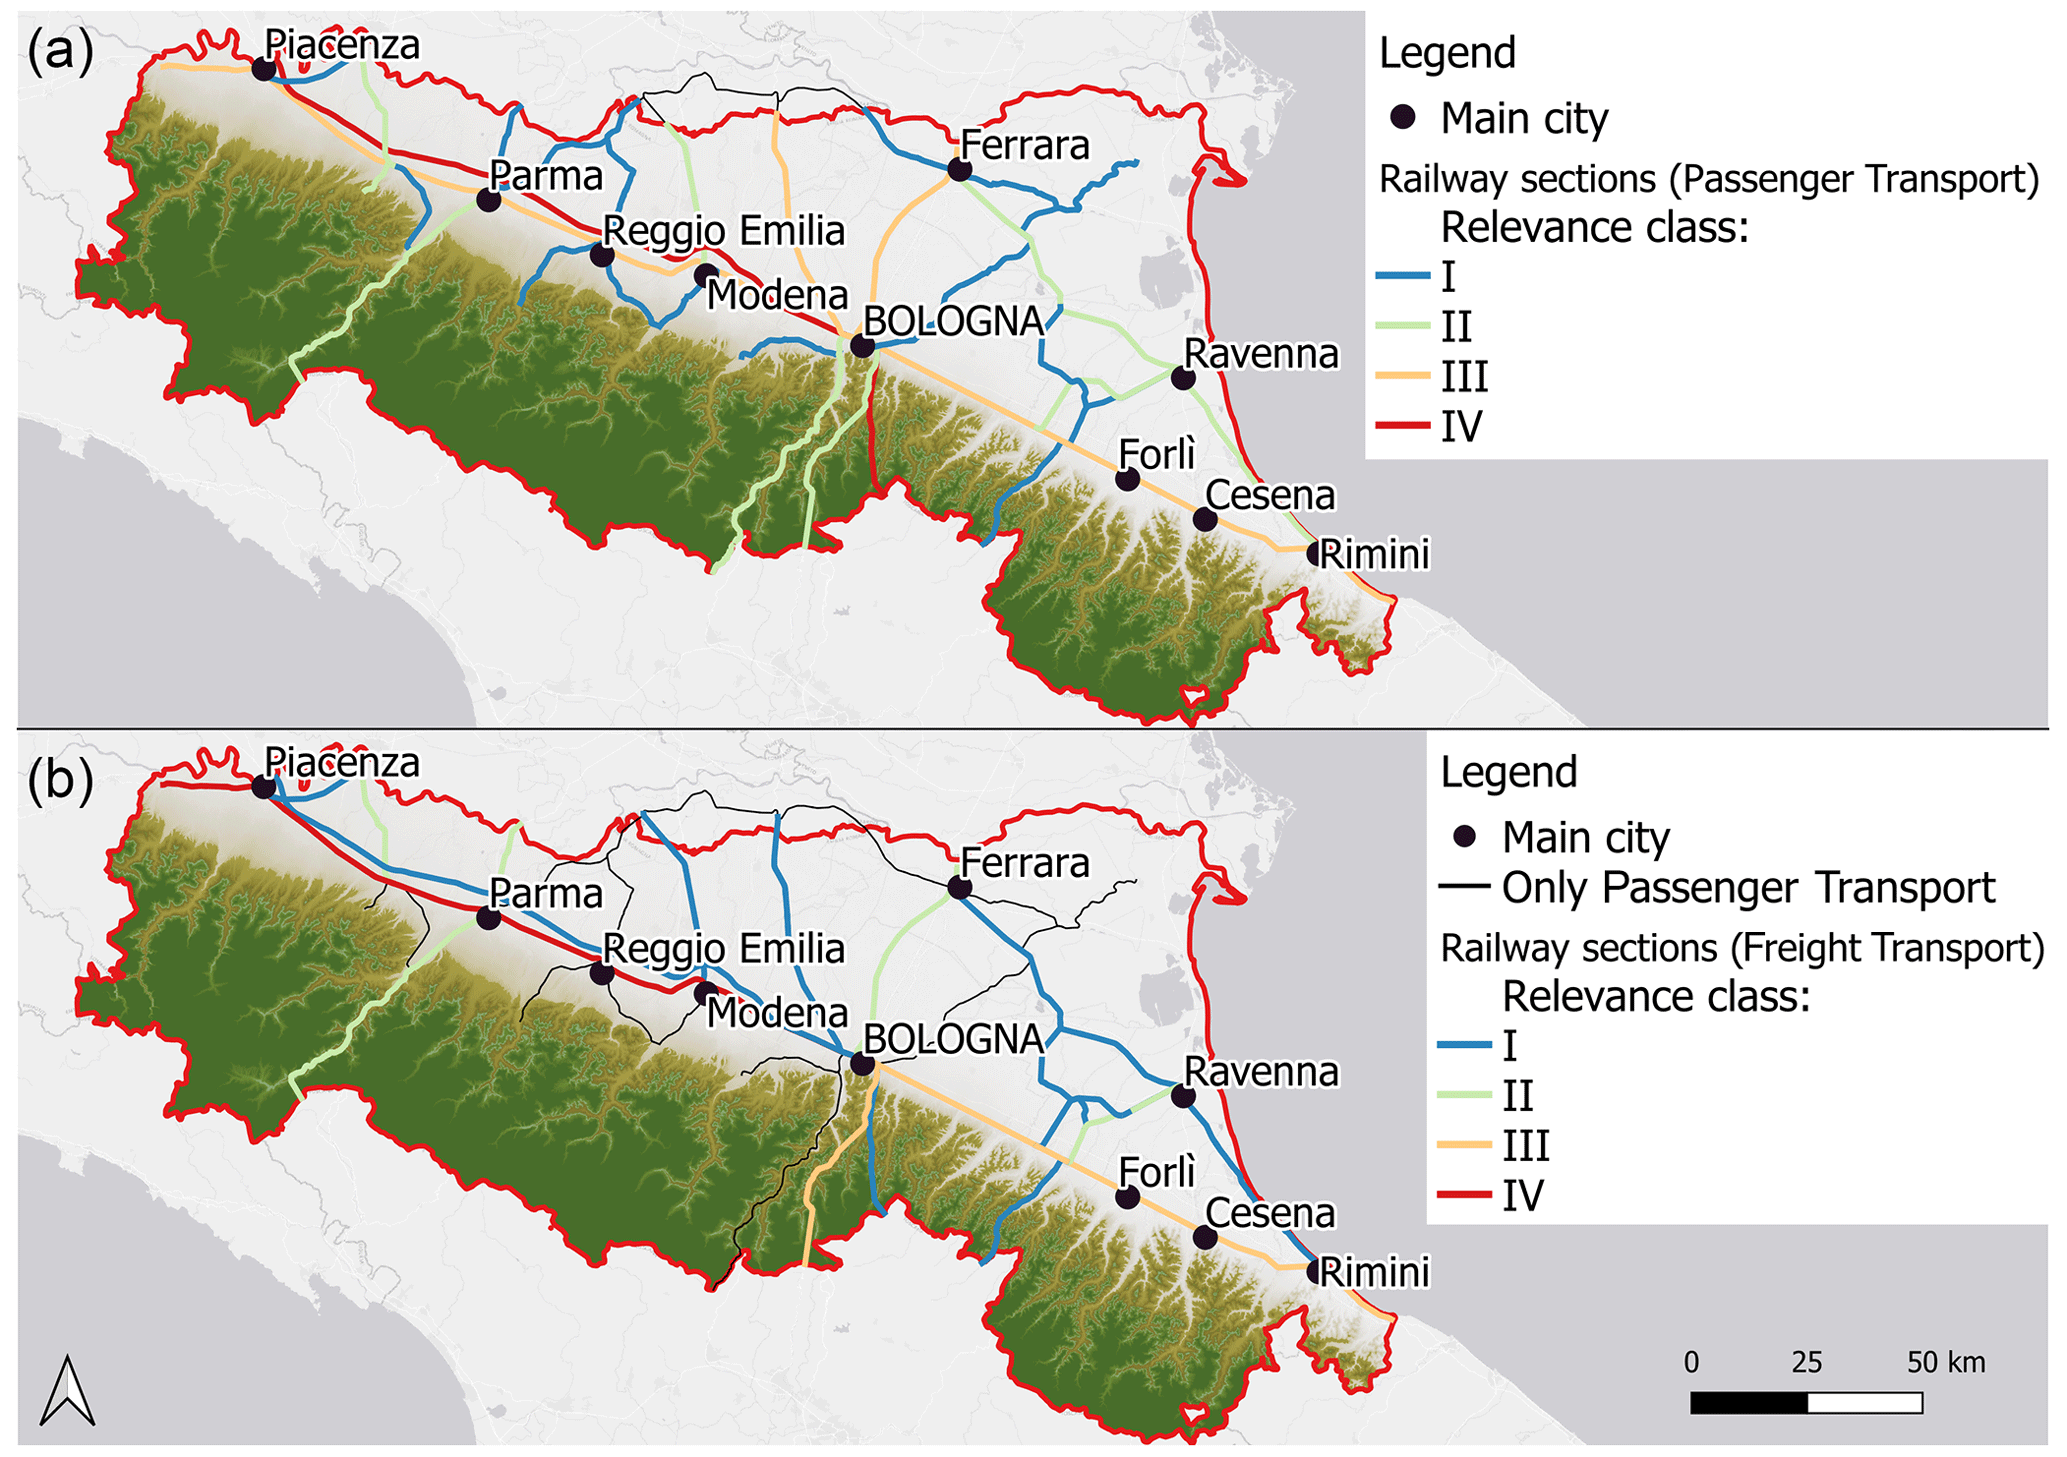
Figure 2Relevance classes of railway sections used for the transport of passengers (a) and freight (b).
The methodology developed for the qualitative assessment of functional damage to railway infrastructures also includes the identification of impacted railway stations; it was decided to assign the maximum class to all stations in the flooded area.
The implemented GIS procedures makes possible the evaluation of road and railway sections most exposed to flood risk according to the identified classes. The risk matrices shown in Tables 1 and 2 were applied considering the hazard maps provided by the FRMP and the relevance classes attributed to roads and railways. From Fig. 2 it can be seen that the constructed index depicts different relevance classes to a given railway arch in relation to the type of transport considered (passengers or freight), which is representative of the current condition. Concerning passenger transport, the Firenze-Milano line, the only High-Speed line in the region, falls into the highest class, while the historic regional lines (e.g., Ancona-Piacenza and Bologna-Padova), reach class III having a significant passengers flow. The intra-regional connections, mainly concentrated in the provinces of Ravenna and Ferrara, all fall into the lowest relevance classes. The overall risk picture changes in case of considering freight transport: lines with the highest relevance index are those that connect the main cities with national ports or cross the border; the highest number of freight trains of international importance, such as European Combined Trains (ECT) and International Combined Trains (ICT), transits over these lines. Furthermore, it can be observed that lines strategic for passenger transport have a minor, if not null, impact on freight (such as the High-Speed line and intra-regional diesel traction lines which, providing only passenger service, have been neglected in the risk analysis for the displacement of freight). The application of the risk matrices made possible to evaluate, for each of the three hazard scenarios, the effect on the road and railway infrastructures within the 7 APSFR of the Po District in the Emilia-Romagna region. Tables 3 and 4 show the length of roads and railways impacted by an event with an intermediate probability of occurrence (MPH).
Table 3Risk associated with an MPH event for road infrastructures.
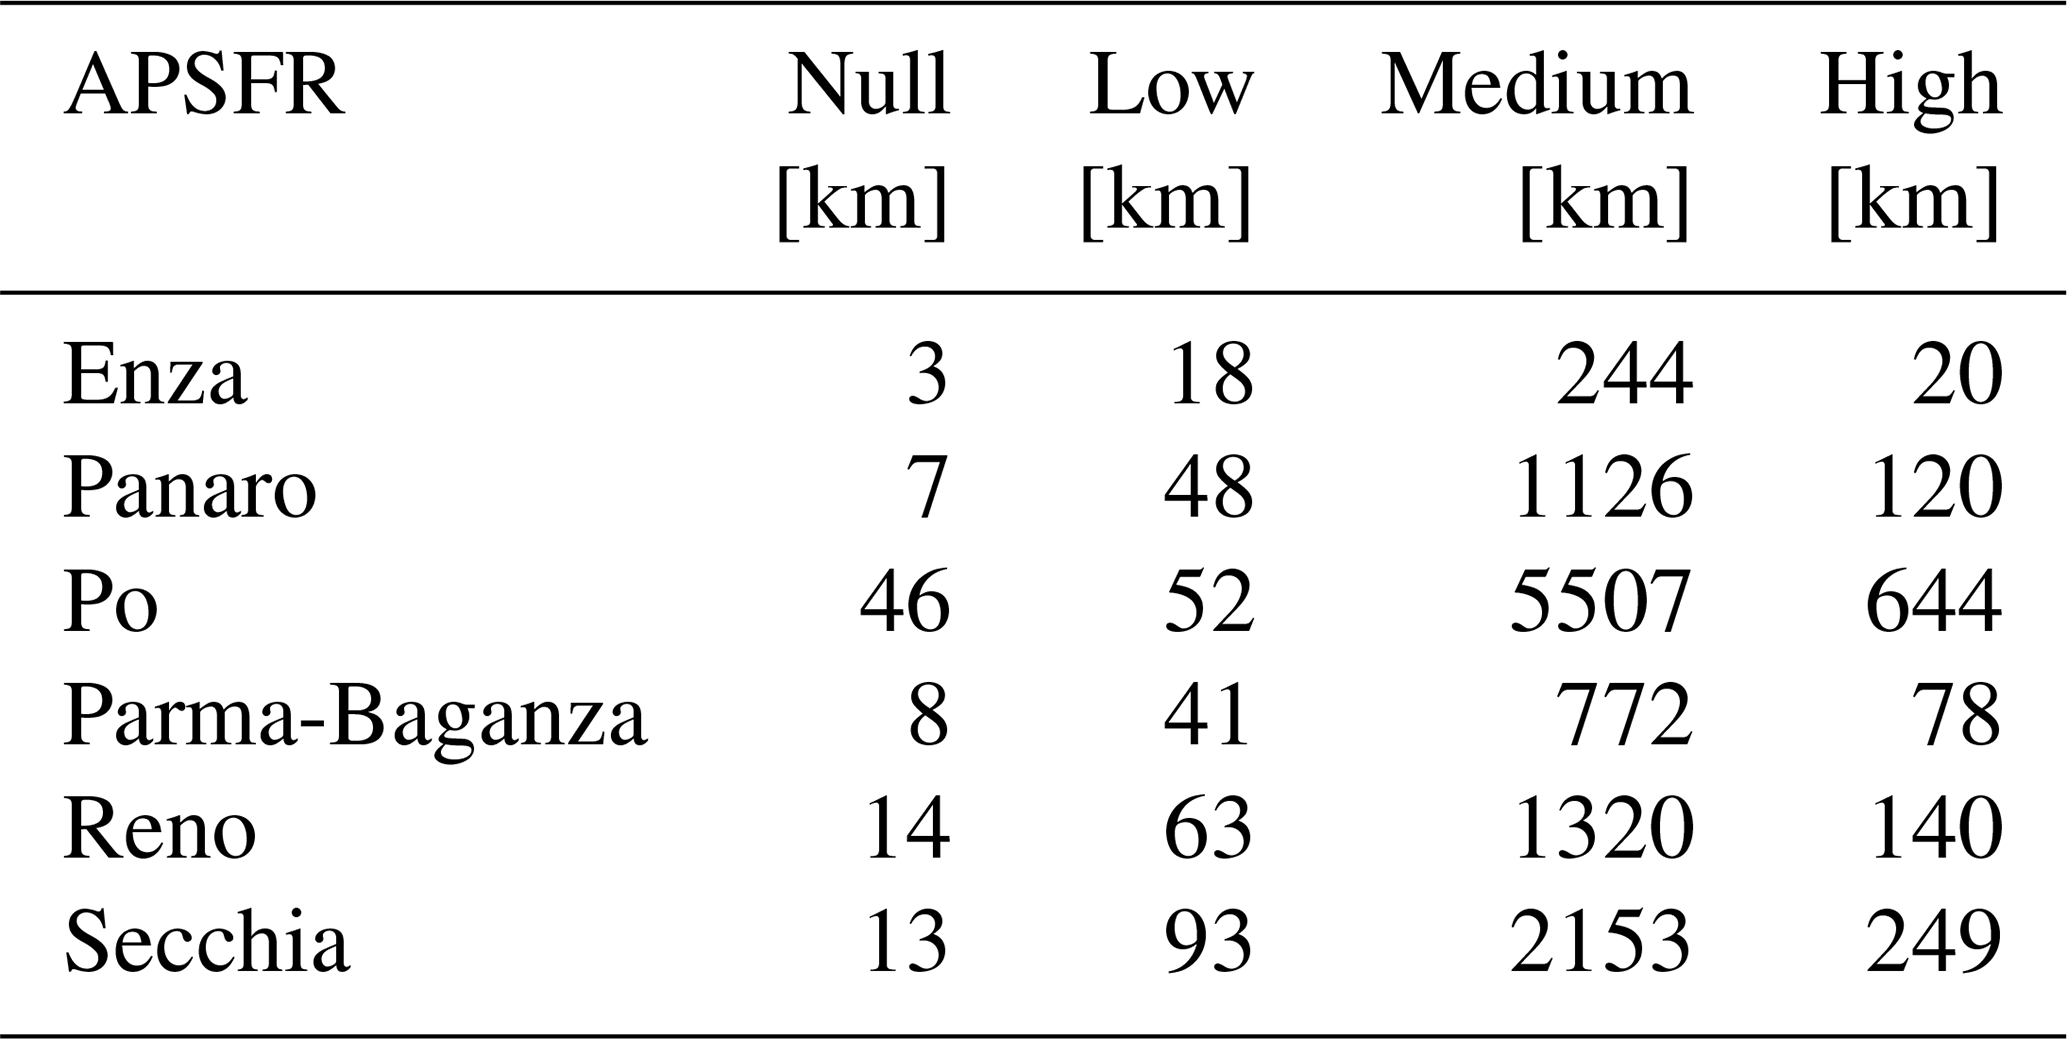
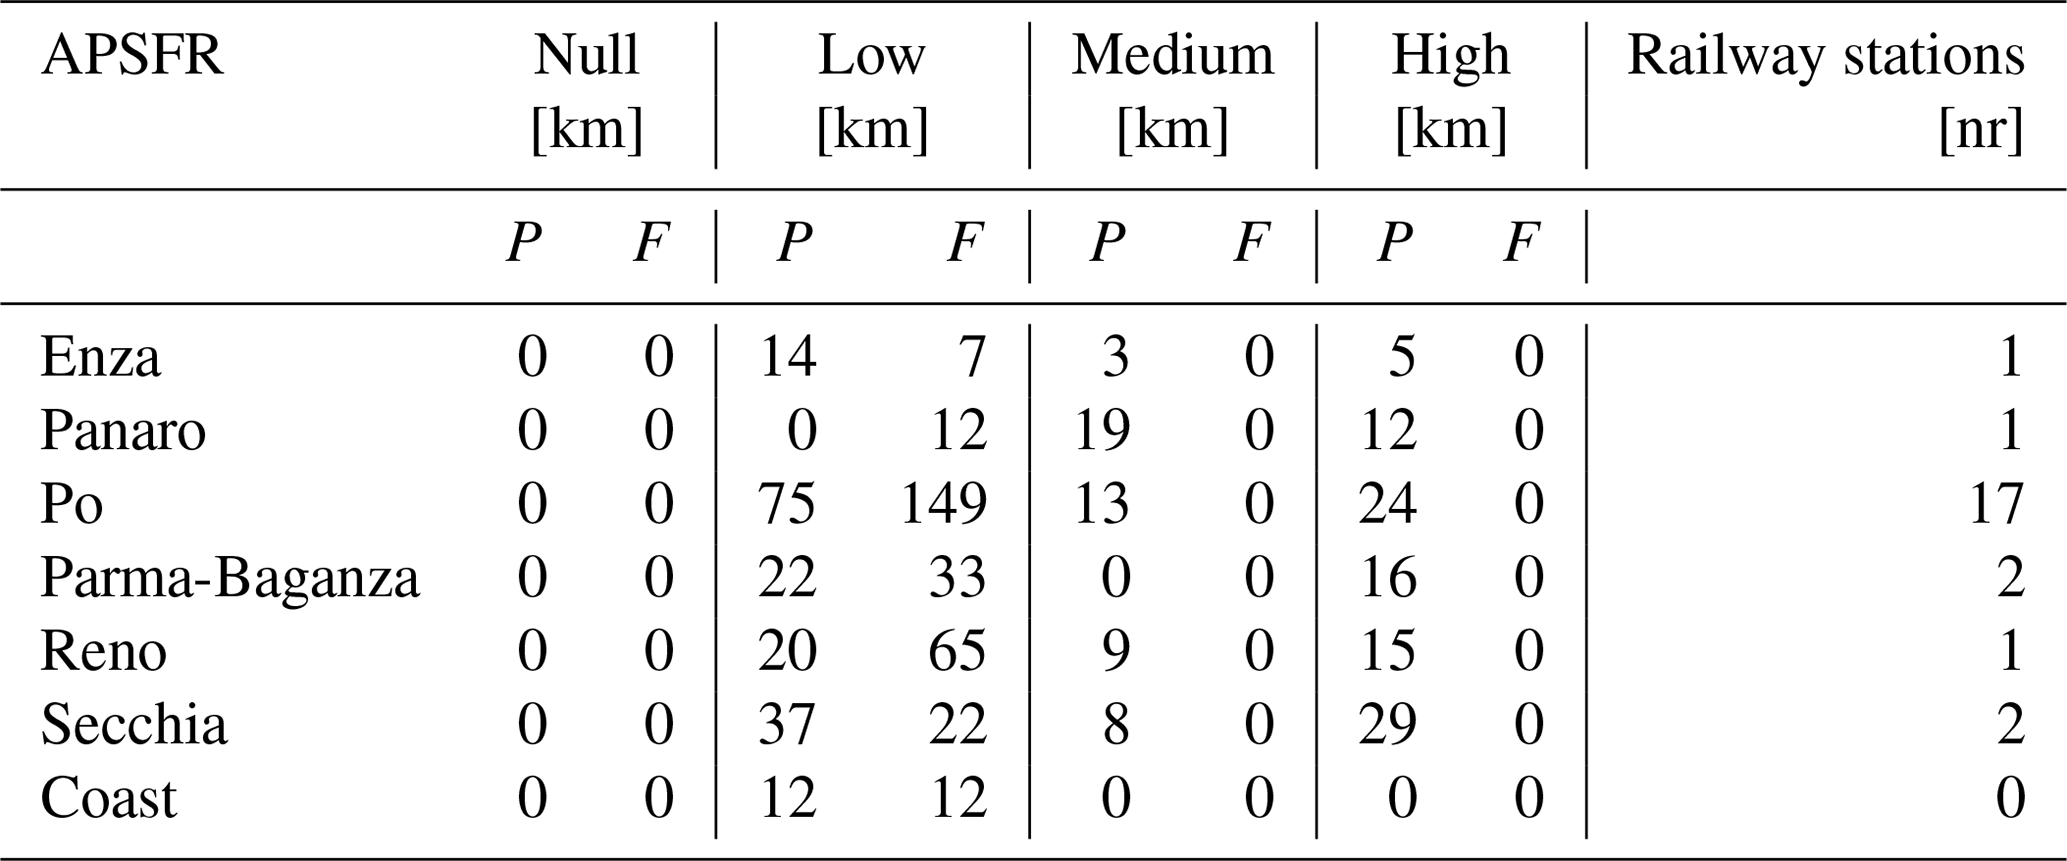
Table 4Risk associated with an MPH event for railway infrastructures (P refers to passenger transport and F to freight transport).
Concerning the reported hazard scenario (MPH, although the same applies to other events), all APSFRs have a significant extension of medium-risk roads: this is due to the greater presence of secondary and service or dirt roads within each area, compared to the main roads and highways (as shown in the Fig. 3 for the APSFR of Secchia River).
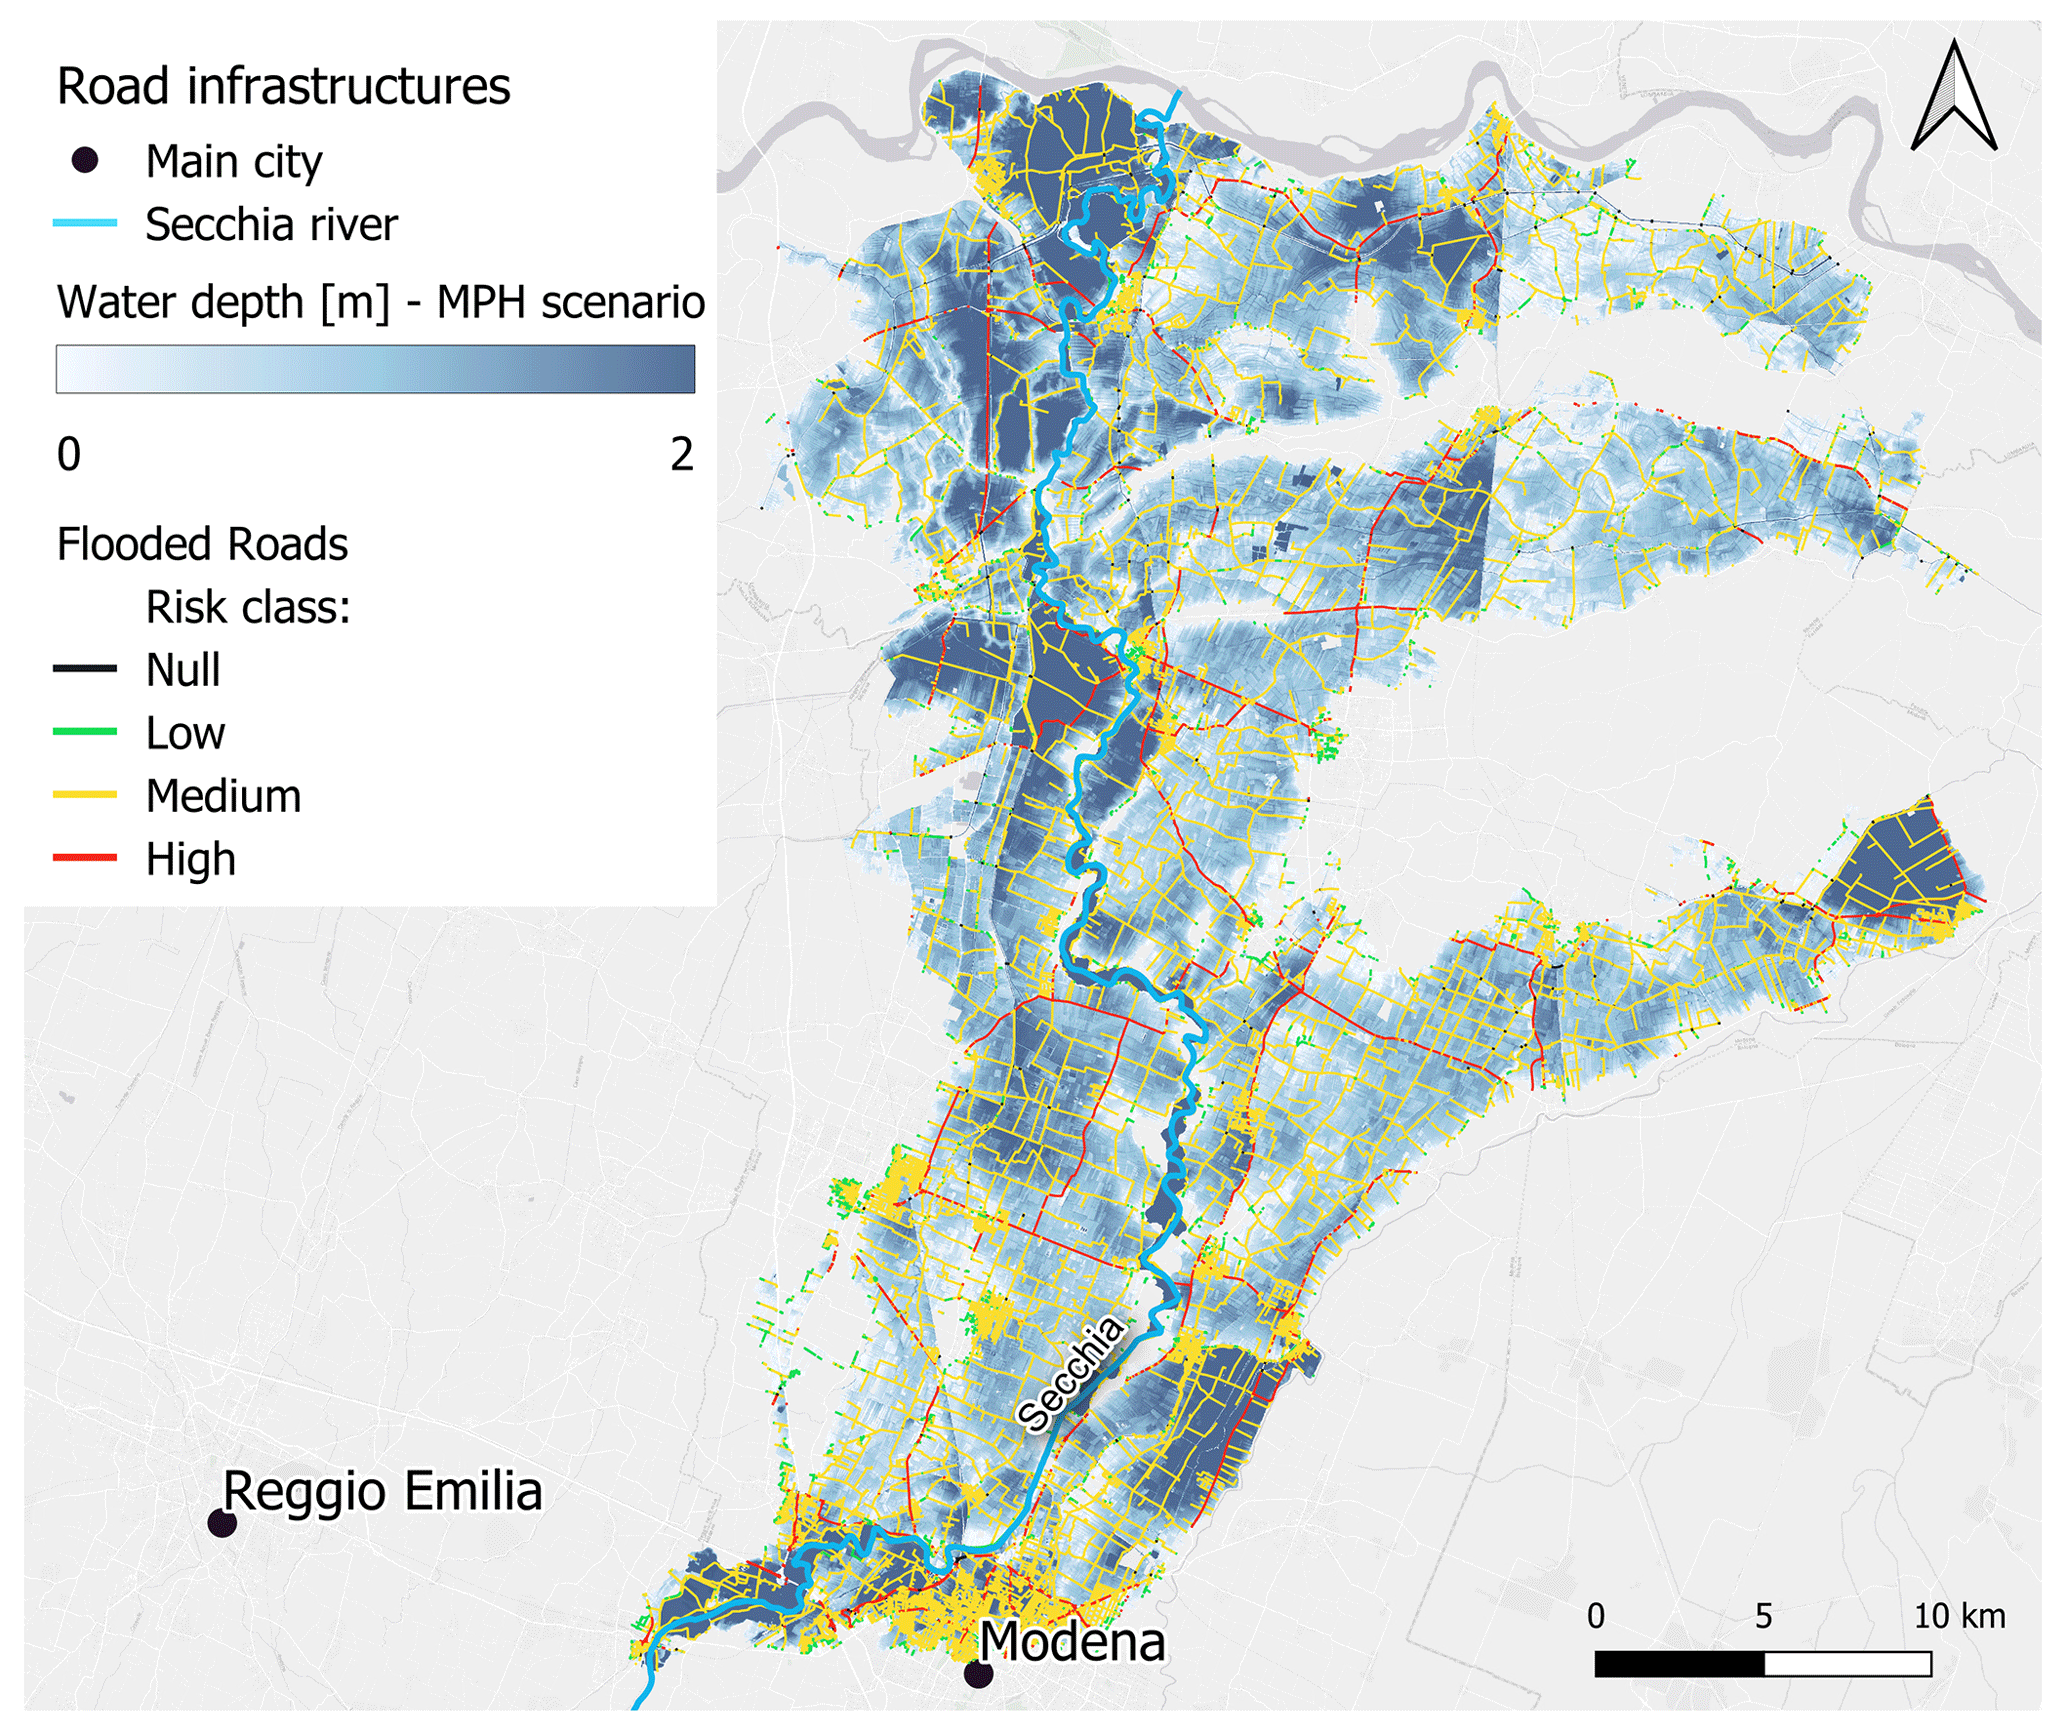
Figure 3Inundation extent according to MPH scenario and road risk classification for the APSFR of Secchia River.
Highways sections severely impacted are: the A1, which crosses the APSFR of Secchia River for 7 km, Parma-Baganza for 13 km and Enza for 3 km; A13 that crosses the APSFR Reno for 14 km and the A21 that intersects the APSFR of Po River in the Emilia-Romagna region.
As regards passenger transport on railway lines, most of the lines resulted associated with high and low risk classes for all APSFR. The first case is attributable to the High-Speed line, for a total length of 45 km, and to the Bologna-Piacenza line, parallel to the previous one, which is exposed for a length of 32 km. The significant extent of low risk classes is due to railway sections not directly affected by floods but rather located nearby the inundation edge (see Table 2). The overall risk for freight transport appears lower: arches relevant in this case are not severely impacted by inundations.
The developed methodology allows for qualitatively assess the functional risk for transport infrastructures in case of flooding. The evaluation considers water depth impacts on slowing down or interrupting the transit, as well as the ability of the network to guarantee an adequate level of redundancy, calculated according to the type of infrastructure affected by the flood. The procedure is applied for roads and for railways, for the latter distinguishing the case of person and freight transport. The risk is assessed at the scale of the single exposed section or station (microscale).
As regards the procedure implemented for road infrastructures, a limit of the present investigation concerns high altitude sections (i.e., bridges, viaducts): comparison of deck level and water depth is not carried out, associating these sections to the null risk class, regardless the stability of the road infrastructure affected by the flood and the freeboard.
As regards the railway infrastructures, the current limitations concern: the definition of the arches, which are represented continuously from station to station, ignoring the presence of logistics stops; stations are considered as a punctual element, without distinguishing them in terms of importance and dimensions. For both infrastructures, only a qualitative estimate of the risk was made through the use of an “expert-based” approach. A proper validation of risk attribution was not possible at this stage due to the lack of extensive data relating to the impacts of past flood events, as well as by the limited involvement of infrastructures managers, which should be considered in the validation of categorical approaches, as the one proposed here. That said, the method refers to reasonable considerations and literature findings (literature data and experimental observations were used to evaluate the impact of water depth on the speed of road and rail vehicles), which we believe make the approach scientific and technically sounding. Nevertheless, the validation of methodology certainly represents one of the challenges that we intend to overcome in the future developments. Also, the study will be extended considering physical damages to infrastructures, in terms of costs of reconstruction/restoration, as well indirect damages (i.e., the impact on the travel times of passengers or the temporary stop of freight convoys). These are rather complex analyses that require in-depth knowledge, such as the geometric characteristics of the infrastructure, on which the cost items significantly depend. However, the presented analysis of the flood risk on transport infrastructures constitutes an added value for the operators of the sector in terms of efficient management of the network, promoting targeted planning and implementation of measures aimed at reducing the risk.
The methodology was developed in a GIS environment (https://download.qgis.org/downloads/, QGIS, 2023); latest version released on 16 January 2021. The tool can be provided to scientists for reasonable research purposes upon request to the corresponding author.
Data of transport networks refers to OSM (https://download.geofabrik.de/europe/italy/nord-est.html, OpenStreetMap contributors, 2020). Hazard maps can be downloaded from the national geo portal website (http://www.pcn.minambiente.it/mattm/direttiva-alluvioni/, Po River District Authority, 2021). Additional data are available from the website of the National Institute of Statistics (ISTAT) at this link: https://www.istat.it/it/archivio/104317 (ISTAT, 2011).
The work was carried out thanks to the participation of all authors. NP was responsible for defining the methodology, analyzing the data and writing the manuscript, AD gave a significant contribution to the analysis of the data and writing the manuscript, which was also reviewed by AB. LM, however, provided detailed information on the characteristics of transport networks. DM, AG and FB took care of the direction and coordination of the works, while MH, MZ and SS allowed the implementation of the procedure in a GIS environment and the definition of a structured database.
The contact author has declared that none of the authors has any competing interests.
Publisher’s note: Copernicus Publications remains neutral with regard to jurisdictional claims in published maps and institutional affiliations.
This article is part of the special issue “IAHS2022 – Hydrological sciences in the Anthropocene: Variability and change across space, time, extremes, and interfaces”. It is a result of the XIth Scientific Assembly of the International Association of Hydrological Sciences (IAHS 2022), Montpellier, France, 29 May–3 June 2022.
This work was supported by the Po River Basin District Authority for the update of the flood risk management plan, released in 2021.
The research has been supported by the Po River Basin District Authority (research agreement ex art.15 L. N. 241/90 – Metodologie e applicazioni per l’aggiornamento delle mappe di danno alluvionale relativamente alla revisione del PGRA – “PGRA-Danni”).
This paper was edited by Christophe Cudennec and reviewed by Eric Gaume and one anonymous referee.
Adhikari, P., Hong, Y., Douglas, K., Kirschbaum, D., Gourley, J., Adler, R., and Brakenridge, R.: A digitized global flood inventory (1998–2008): compilation and preliminary results, Nat. Hazards, 55, 405–422, 2010.
Blöschl, G., Hall, J., Viglione, A., Perdigão, R., Parajka, J., Merz, B., Lun, D., Arheimer, B., Aronica, G. T., Bilibashi, A., Boháč, M., Bonacci, O., Borga, M., Čanjevac, I., Castellarin, A., Chirico, G., Claps, P., Frolova, N., Ganora, D. Gorbachova, L., Gül, A., Hannaford, J., Harrigan, S., Kireeva, M., Kiss, A., Kjeldsen, T., Kohnová, S., Koskela, J., Ledvinka, O., Macdonald, N., Guirguinova, M. M., Mediero, L., Merz, R., Molnar, P., Montanari, A., Murphy, C., Osuch, M., Ovcharuk, V., Radevski, I., Salinas, J., Sauquet, E., Šraj, M., Szolgay, J., Volpi, E., Wilson, D., Zaimi, K., and Živković, N.: Changing climate both increases and decreases European river floods, Nature, 573, 108–111, https://doi.org/10.1038/s41586-019-1495-6, 2019.
Centre for Research on the Epidemiology of Disasters, in collaboration with United Nations Office for Disaster Risk Reduction (CRED and UNDRR): The Non-Covid year in disasters, CRED, Brussels, Belgium, https://www.cred.be/publications (last access: December 2022), 2021.
Ferreira, C., Walsh, R., and Ferreira, A.: Degradation in urban areas, Current Opinion in Environmental Science & Health, 5, 19–25, https://doi.org/10.1016/j.coesh.2018.04.001, 2018.
ISTAT: Territorial bases – census sections, ISTAT [data set], https://www.istat.it/it/archivio/104317 (last access: November 2021), 2011.
Kellermann, P., Schöbel, A., Kundela, G., and Thieken, A. H.: Estimating flood damage to railway infrastructure – the case study of the March River flood in 2006 at the Austrian Northern Railway, Nat. Hazards Earth Syst. Sci., 15, 2485–2496, https://doi.org/10.5194/nhess-15-2485-2015, 2015.
Kramer, M., Terheiden, K., and Wieprecht, S.: Safety criteria for the trafficability of inundated roads in urban floodings, Int. J. Disast. Risk Re., 17, 77–84, https://doi.org/10.1016/j.ijdrr.2016.04.003, 2016.
OpenStreetMap contributors: Nord-Est, Geofabrik [data set], https://download.geofabrik.de/europe/italy/nord-est.html (last access: March 2021), 2020.
Piano Regionale Integrato dei Trasporti (PRIT 2025): Emilia-Romagna region, https://mobilita.regione.emilia-romagna.it/prit-piano-regionale-integrato-dei-trasporti/sezioni/prit-2025-elaborati-tecnici (last access: March 2022), 2021.
Po River District Authority: Flood Risk Management Plans, Geoportale Nazionale [data set], http://www.pcn.minambiente.it/mattm/direttiva-alluvioni/ (last access: March 2022), 2021.
Pregnolato, M., Alistair, F., Wilkinson, S., and Dawson, R.: The impact of flooding on road transport: A depth-disruption function, Transport. Res. D-Tr. E., 55, 67–81, https://doi.org/10.1016/j.trd.2017.06.020, 2017.
QGIS: v. 3.10.14, QGIS [code], https://download.qgis.org/downloads/, last access: January 2023.
Tanoue, M., Hirabayashi, Y., and Ikeuchi, H.: Global-scale river flood vulnerability in the last 50 years, Scientific Reports, 6, 36021, https://doi.org/10.1038/srep36021, 2016.
Zhang, N. and Alipour, A.: A multi-step assessment framework for optimization of flood mitigation strategies in transportation networks, Int. J. Disast. Risk Re., 63, 102439, https://doi.org/10.1016/j.ijdrr.2021.102439, 2021.