the Creative Commons Attribution 4.0 License.
the Creative Commons Attribution 4.0 License.
 | 18 Apr 2024
Trend analysis of reference evapotranspiration and climate variables in the main hydrosystems of Senegal: Senegal, Gambia and Casamance River Basins
Papa Malick Ndiaye
Ansoumana Bodian
Serigne Bassirou Diop
Lamine Diop
Alain Dezetter
Andrew Ogilvie
Koffi Djaman
Analysis of reference evapotranspiration (ET0) trends is essential for understanding the impacts of climate change on water resources. Thus, despite the continuous rise in temperatures, a decrease in evapotranspiration is noted in some parts of the world. This contrast is called the “evaporation paradox” and is thought to be related to the variation in wind speed, relative humidity and solar radiation. The objective of this work is to analyze the annual and seasonal trends of ET0 and climate variables at the scale of the Senegal, Gambia and Casamance river basins. The reanalyze data of NASA/POWER are used over the period 1984–2019. Mann Kendall's test and Sen slope were used to analyze trends in ET0 and climate variables. Results show that on annual scale, ET0 increases significantly in 32 % of the Senegal basin and decreases in less than 1 % of it. In contrast, in the Casamance and Gambia basins, the annual ET0 drops by 65 % and 18 %, respectively. On an annual scale, temperature and relative humidity show an increasing trend over all basins while wind speed and radiation decrease significantly. This confirms the existence of the “evaporation paradox” in the three basins. This phenomenon is explained by the increase in relative humidity and the decrease in wind speed and solar radiation.
- Article
(5219 KB) - Full-text XML
- BibTeX
- EndNote


UPH1; SDG 6; Modelling; Senegal; Gambia; Casamance River Basins
In a context of climate change, the spatiotemporal analysis of evapotranspiration is important for the management of water resources. Indeed, in semi-arid regions, 60 % to 80 % of rainfall is lost through evapotranspiration (Mjejra, 2015; Ndiaye et al., 2020a). In this regard, evapotranspiration is an important parameter for hydrological modelling, reservoir management, irrigation planning and scheduling, and climate change studies. In its latest assessment report, the GIEC (2021) continues to alert international opinion to the potential impacts of climate change on various sectors of activity. One of the consequences of global warming is the intensification of the hydrological cycle (Wilcox et al., 2018) which would result in an increase in evapotranspiration (Jiao and Wang, 2018). However, in recent years, despite rising temperatures, studies (Peterson et al., 1995; Qin et al.. 2021) have shown a decreasing in evapotranspiration in certain regions of the world. This contrast between increasing temperatures and decreasing evapotranspiration highlights the concept of the “evaporation paradox” theorized since the 1990s (Peterson et al., 1995). The causes of the evaporation paradox are analyzed through the trends of climatic variables (temperatures, relative humidity, solar radiation and wind speed). Thus, according to Mekoya (2020), for the evaporation paradox to exist, the temperature must follow an upward trend. Others show that the drop in evapotranspiration is linked to the decreasing in wind speed (Han et al., 2012), solar radiation (Rodrick and Forquha, 2002) and the increase in relative humidity (Chattopadhyay and Hulme, 1997). The main reasons for this evaporation paradox are not yet well understood and research is continuing in this area. Ndiaye et al. (2020b) highlighted the evaporation paradox in the Senegal River basin over the period 1984–2017. This paradox is linked to the increase in relative humidity and the decrease in wind speed. This work aims to expand the study by Ndiaye et al. (2020b) on the other watersheds of Senegal (Gambia and Casamance) in order to analyze trends in ET0 and climatic variables on the main hydrosystems of Senegal. These three hydrosystems are major challenges for the agricultural sector, drinking water supply, hydroelectric production in the countries that share these basins.
2.1 Study area
The main hydrosystems of Senegal are the basins of Senegal, Gambia and Casamance (Fig. 1). The Senegal and Gambia rivers have their source in Fouta Djallon at an altitude of 1150 m and drain areas of more than 300 000 km2 and 77 100 km2 respectively (Faye, 2018; Ndiaye et al., 2020a). The Senegal River is shared by Senegal, Guinea, Mauritania and Mali which form the Organization for the Development of the Senegal River (Organisation pour la Mise en Valeur du Fleuve Sénégal, OMVS, in french). The Gambia river basin is concerned by Senegal, Gambia and Guinea which constitute the Organization for the Development of the Gambia River (Organisation pour la Mise en Valeur du fleuve Gambie, OMVG in French). The Casamance basin extends over an area of 20 150 km2 and is located almost entirely in Senegalese territory (Dacosta, 1989). From a climatic point of view, these three hydrosystems extend over three climatic zones: Guinean (average annual rainfall > 1500 mm); South Sudanian (1000 < rainfall < 1500 mm); North Sudanian (500 < rainfall < 1000 mm) and Sahelian (P rainfall 500 mm). The water resources of these three hydrosystems are used for the development of agriculture, hydroelectric production, drinking water supply, navigation and the maintenance of ecosystems. These water resources are therefore a major challenge for the socio-economic development of the riparian countries.
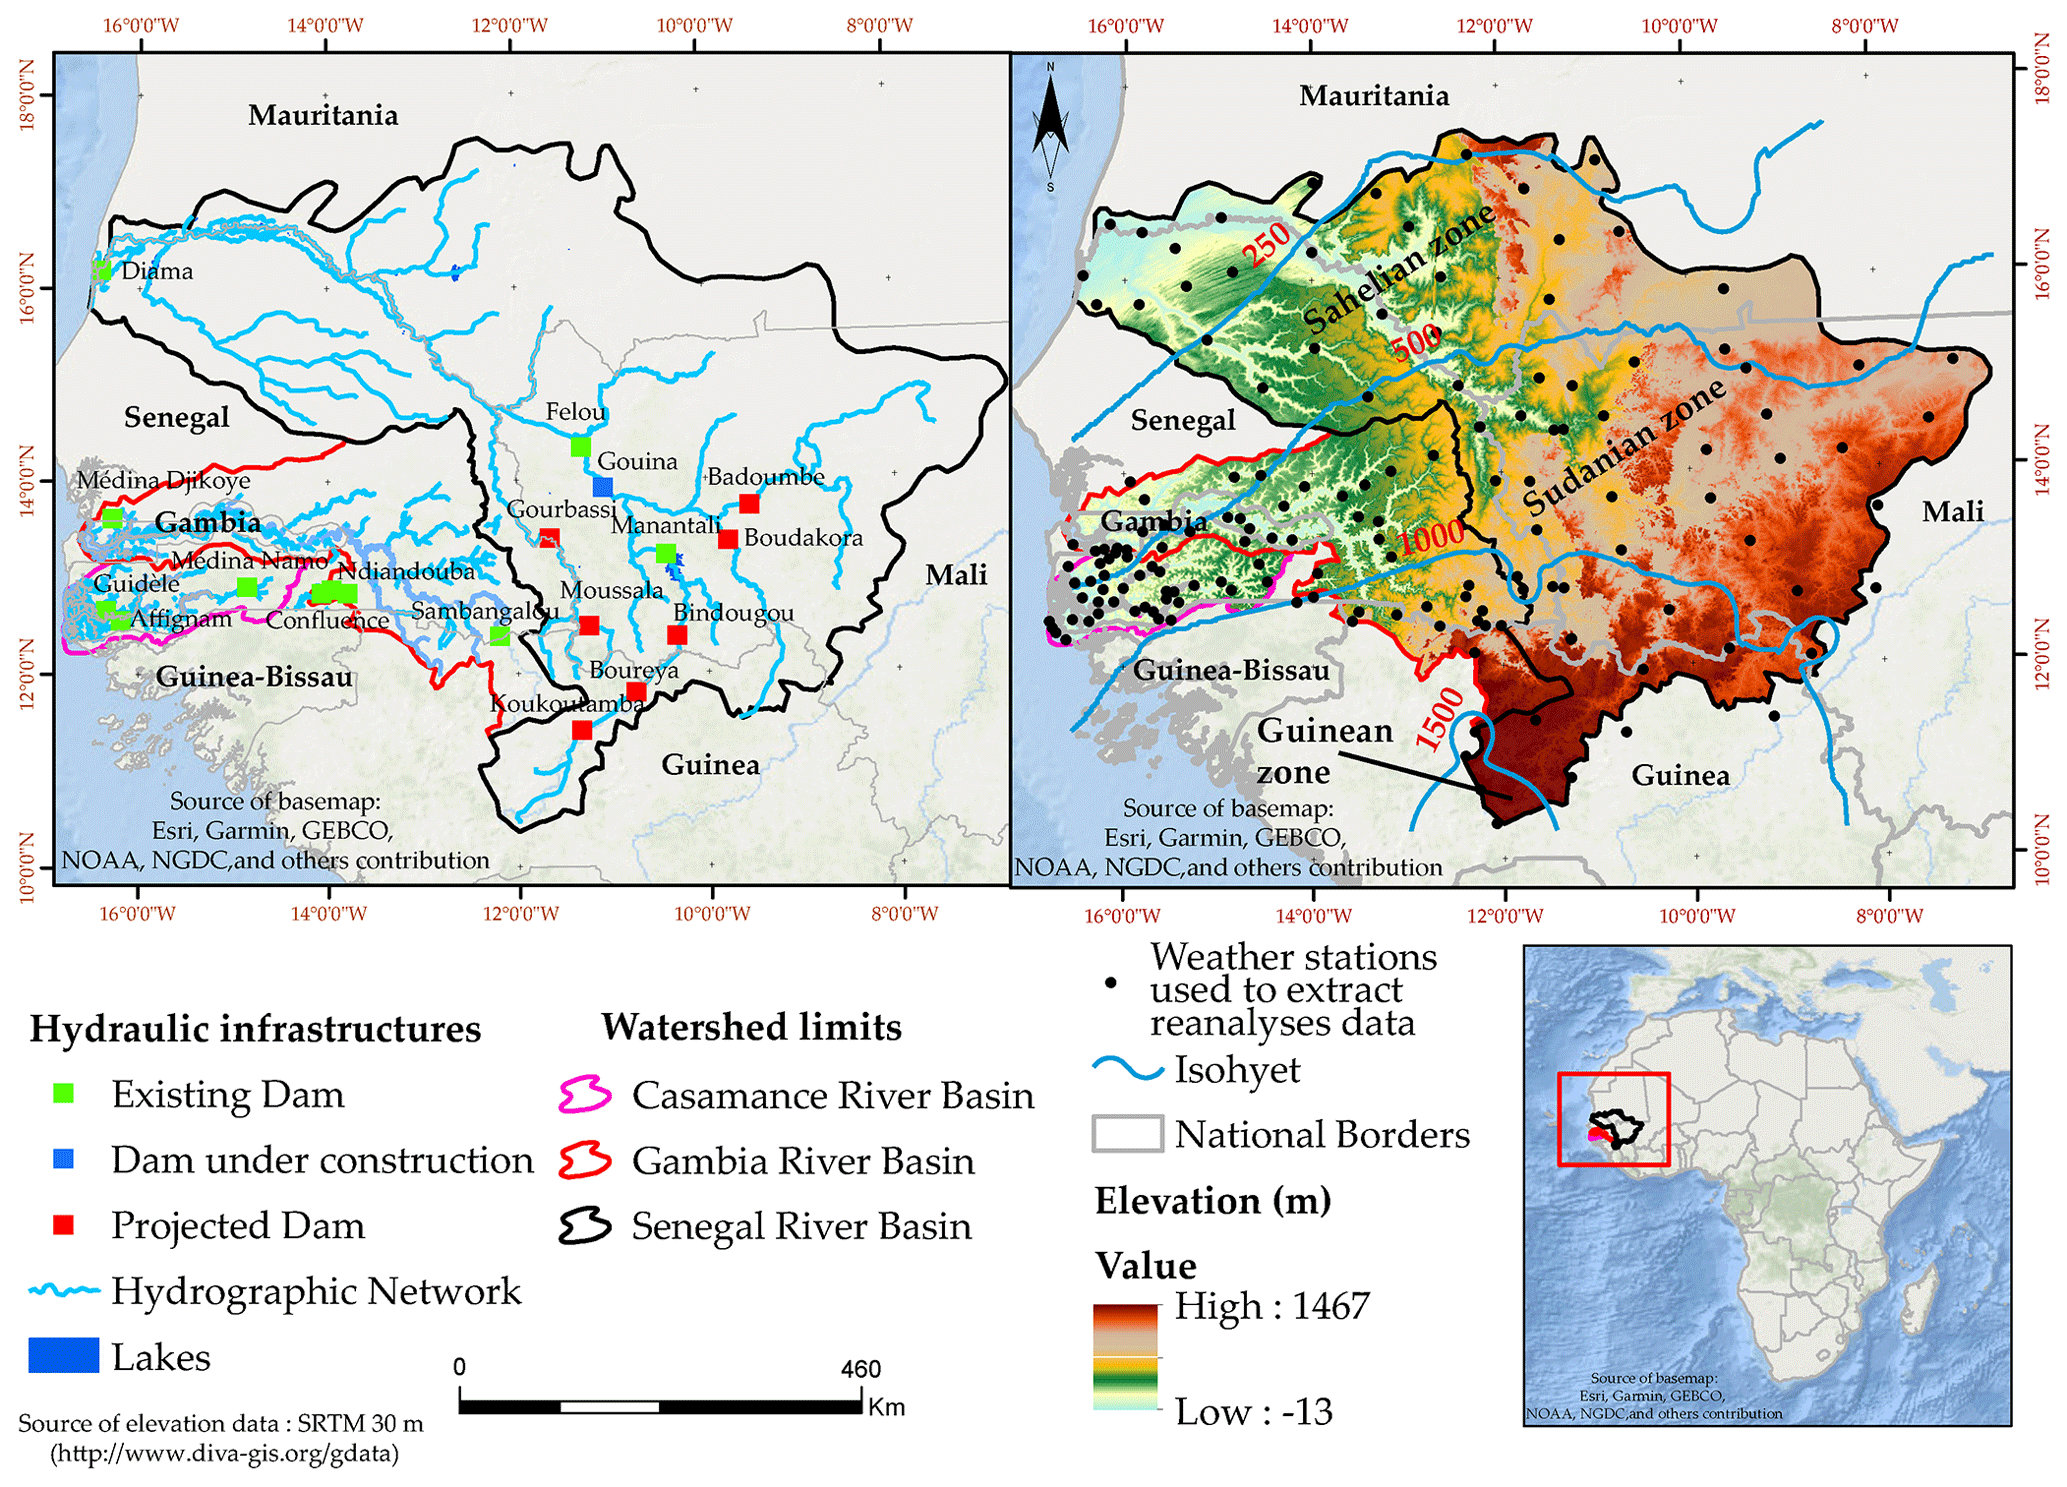
Figure 1Location of the Senegal hydrosystems, hydraulic infrastructures, climate zones, hydrographic network and weather stations used to extract reanalyses data.
2.2 Data
In West Africa, climate data managed by national meteorological services are difficult to access due to their high acquisition cost (Bodian et al., 2020). Added to this is the low density of the observation network, which poses a problem of representativeness at the scale of the catchment area (Ndiaye et al., 2020a). It is for this reason that reanalyses from the NASA Langley Research Center (LaRC) POWER Project funded through the NASA Earth Science/Applied Science Program (https://power.larc.nasa.gov, last access: February 2022) are used as an alternative to observed data generally incomplete and inaccessible (Ndiaye et al., 2020a). The coordinates of 160 stations distributed across the three basins (Fig. 1) are used to extract climate variables on a daily scale over the period 1984–2019. The climatic variables collected are: temperatures (max and min), solar radiation, relative humidity and wind speed at 2 m from the ground.
2.3 Methods
The methodology adopted includes: (i) calculation of reference evapotranspiration, (ii) detection of the trend of ET0 and climatic variables and (iii) sensitivity analysis of ET0 to climatic variables.
Reference evapotranspiration (ET0) was calculated by the Penman-Monteith method (Allen et al., 2005). Mann Kendall's test (Mann, 1945; Kendall, 1975) and Sen's slope (1968) were used for detecting trends in ET0 and climatic variables. As a reminder, this test is based on two hypotheses: the null hypothesis (H0) which assumes an absence of trend and the alternative hypothesis (H1) which indicates the existence of a trend in the time series. The significance of the detected trend is determined by α=0.05. Before applying the Mann Kendall test, the autocorrelation was tested and the results showed a non-significant autocorrelation for more than 80 % of the stations selected. Therefore, the primary version of Mann Kendall's test was applied to the data. ET0 sensitivity to climate variable was estimated by varying each variable individually by ±5 %, 10 %, 15 %, 20 % and 25 %, leaving the other variables constant. The sensitivity coefficient (Svi) is calculated to determine the degree of influence of each climate variable on ET0:
Where Svi is the sensitivity coefficient, ∂ET0 variation of the reference evapotranspiration (ET0) caused by the change of a variable (∂vi), vi being the variable considered. A positive (negative) sensitivity coefficient indicates that the variable increases (decreases) the reference evapotranspiration. The higher the absolute value of the sensitivity coefficient, the greater the influence of the variable on ET0 (Li et al., 2017).
3.1 Annual and seasonal trend of evapotranspiration and climate variables
Figure 2 shows the spatial repartition of ET0 trend in the three basins and Fig. 3 gives the boxplot of Z of Mann Kendall's test. According to the figures a positive trend of ET0 in annual and seasonal (dry season) is observed in the three basins. This positive trend is more marked in the Senegal River basin with an increase in ET0 of 32.6 % on an annual scale and 49 % during the dry season. For the Gambia basins, ET0 increases in about 2 % and 5 % of the basin on annual scale and during the dry season, respectively. During these same periods, a significant increase in ET0 was noted in 4 % and 36 % of the Casamance river basin. A decreasing trend in ET0 was also noted in the three hydrosystems, especially in the rainy season where the three respective basins exhibit a drop in ET0 of 13 % (Senegal basin), 22 % (Gambia basin) and 99 % (Casamance basin) of their area. Over the entire Senegal River basin, the Sen's slope indicates an increase in ET0 of 1.30 and 1.25 mm yr−1 on annual scale and during the dry season and a decrease of 1.13 mm yr−1 during the rainy season. For the Gambia basin, ET0 increases on average by 0.24 mm yr−1 during the dry season and decreases by 0.54 to 0.66 mm yr−1on annual scale and during the rainy season. For all periods, the ET0 of the Casamance basin decreases from 0.15 to 1 mm yr−1.
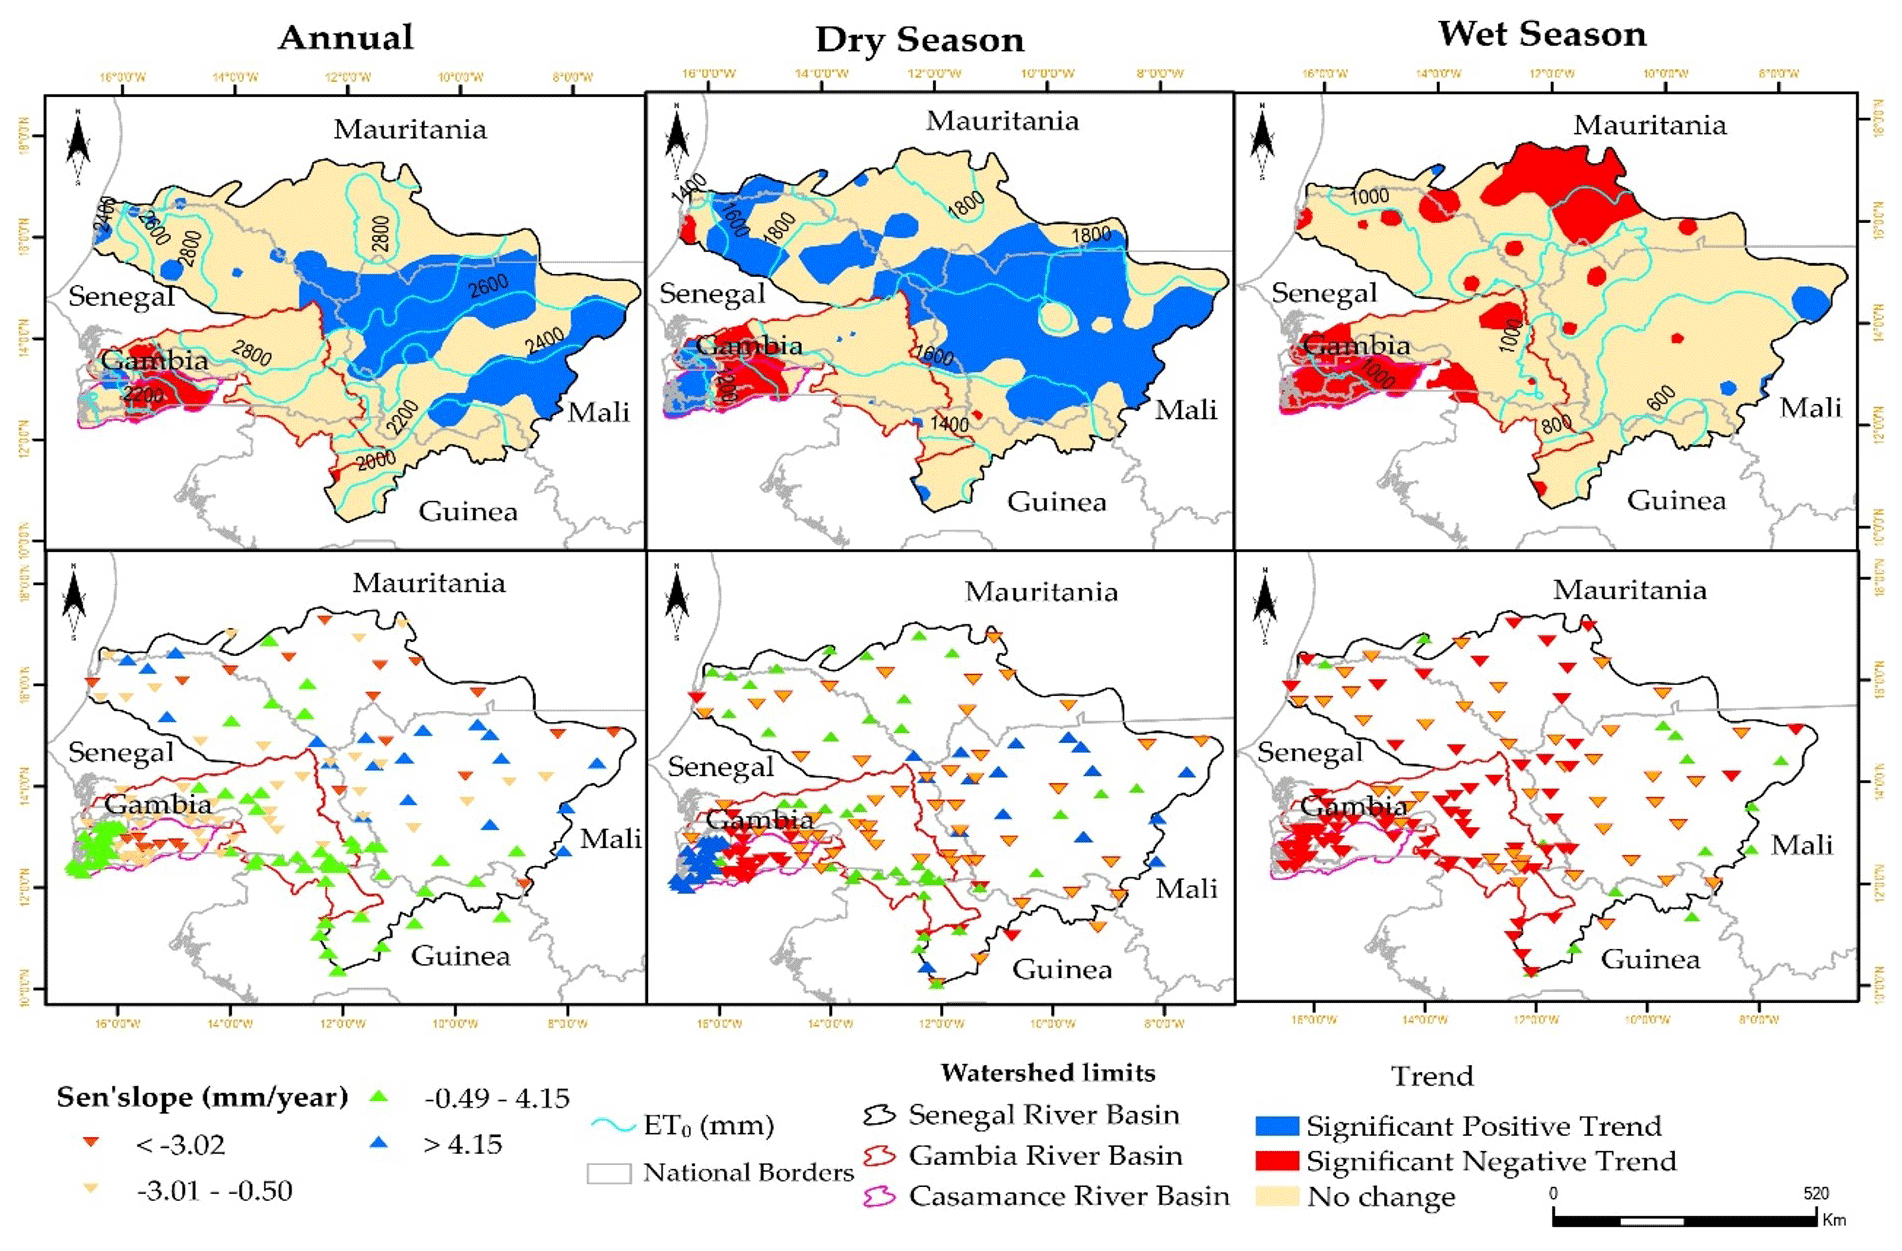
Figure 2Trend of annual and seasonal reference evapotranspiration over the period 1984–2019.
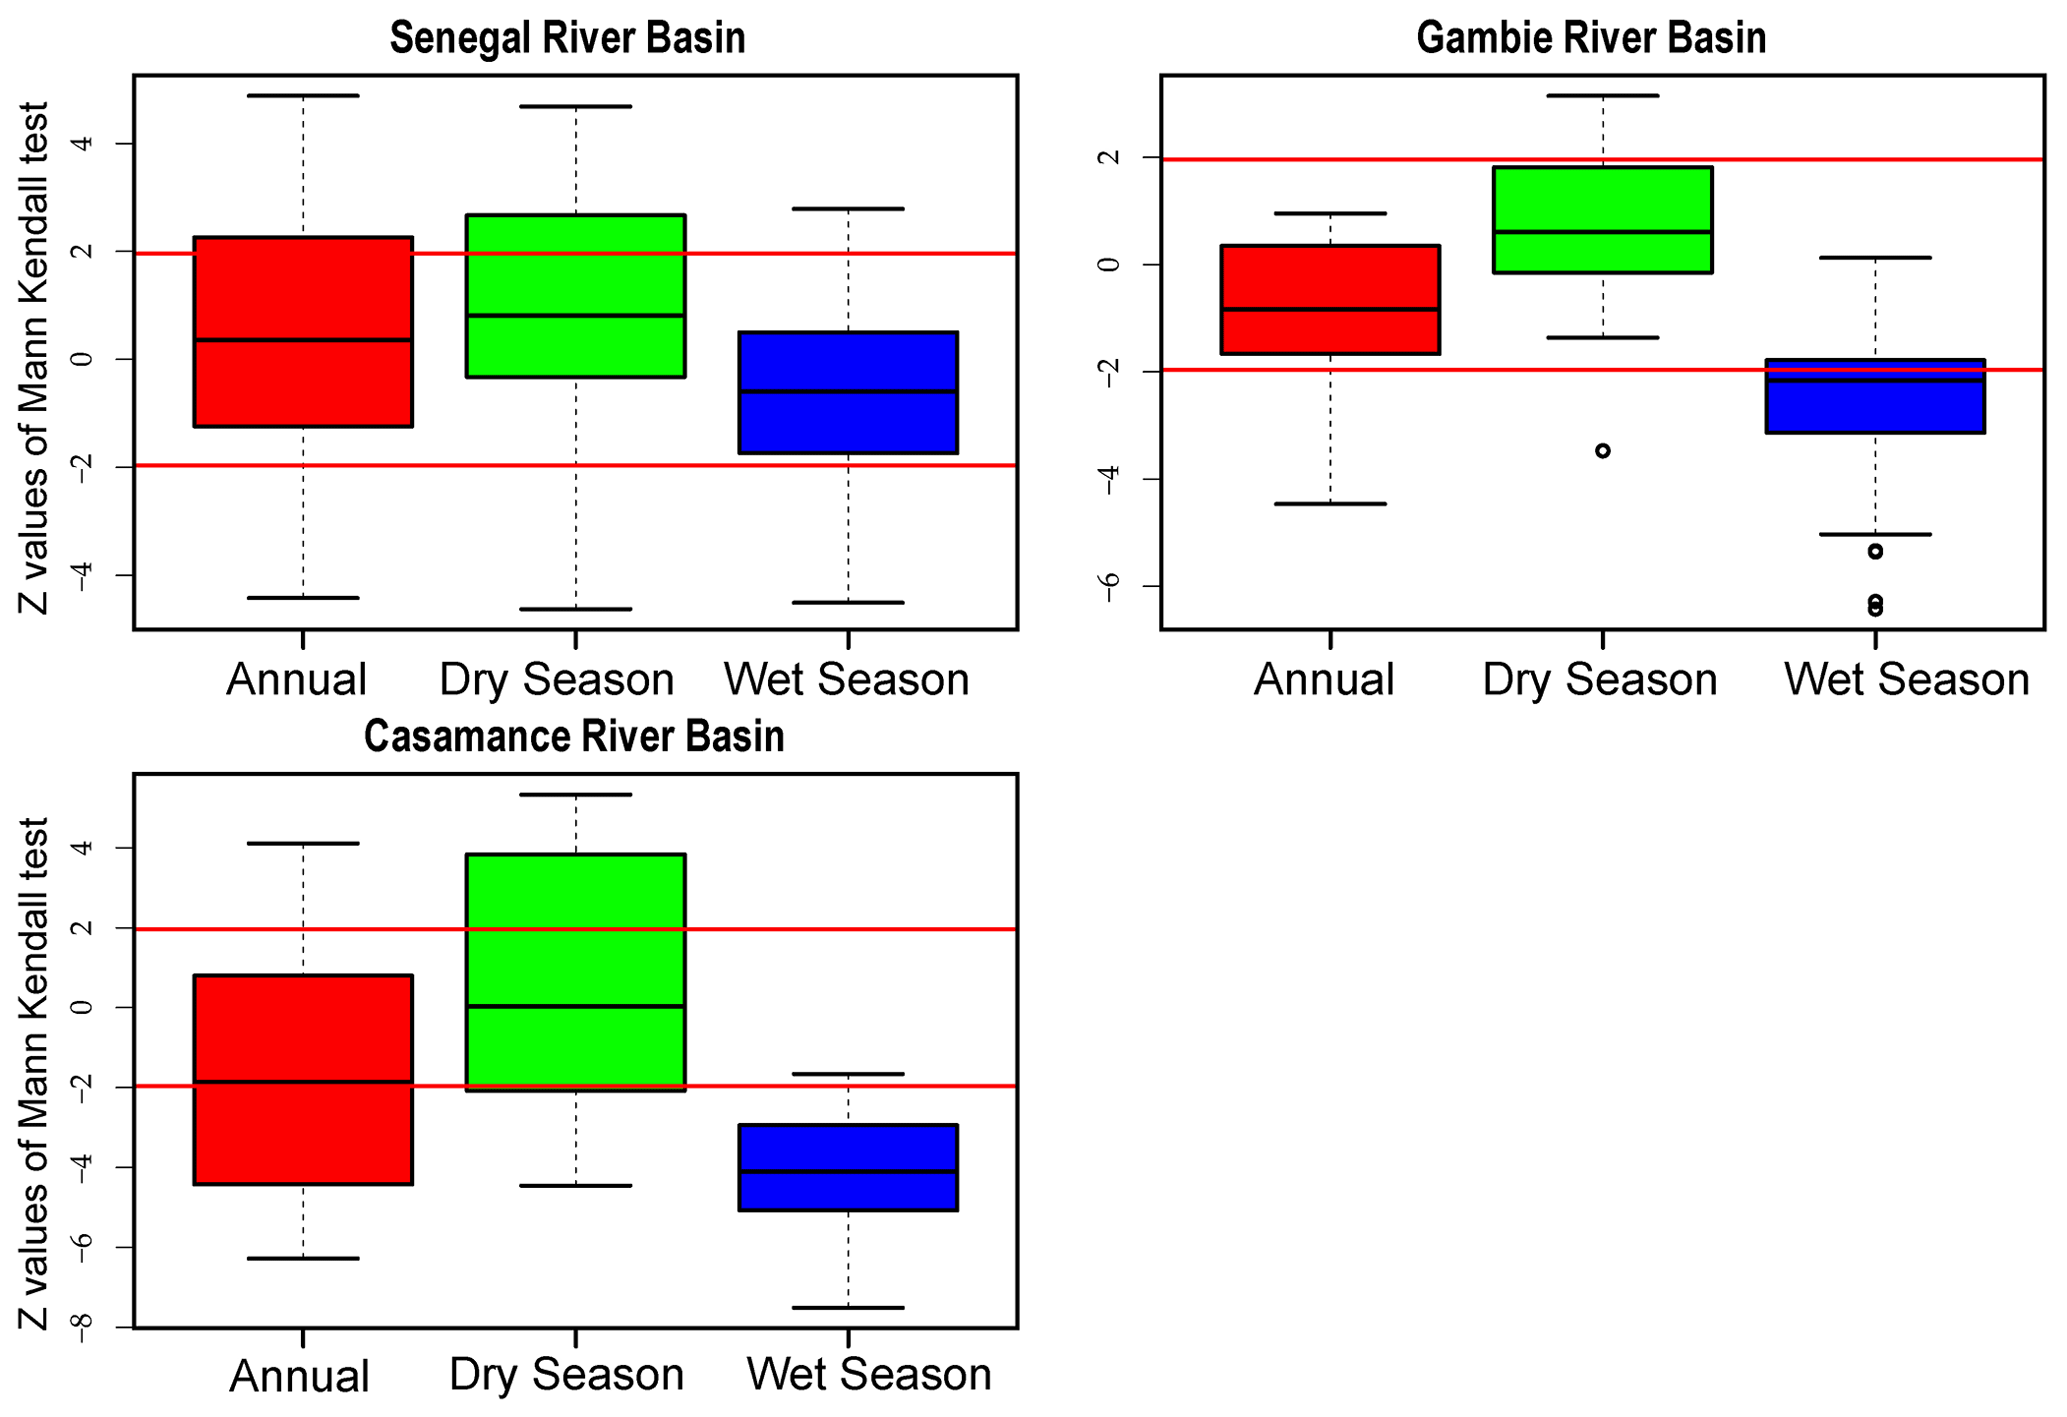
Figure 3Z values of Mann Kendall test of reference evapotranspiration at annual and seasonal scale over the period 1984–2019 (red line is the significant level, α=0.05).
Figures 4 and 5 shows respectively the spatial repartition of the trend of climate variables of the three basins and the boxplot of Z at annual and seasonal scale. Thus, the average annual temperatures globally exhibit a significant increase in the basins of Senegal (Tmax 0.023 °C yr−1 and Tmin 0.021 °C yr−1) and Gambia (Tmax 0.021 °C yr−1 and Tmin 0.044 °C yr−1). On the other hand, for the Casamance basin, maximum temperatures decrease by 0.003 °C yr−1 and minimum temperatures increase by 0.012 °C yr−1. Relative humidity increases significantly on annual scale and during the dry season for the three hydrosystems. This increase in relative humidity is on average 0.10 % yr−1 for the Senegal basin, 0.17 % yr−1 for the Gambia and 0.11 % yr−1 for the Casamance basin. During the rainy season, a non-significant increase in relative humidity (No change) was noted in the Casamance basin. Solar radiation drops significantly during the rainy season in the Casamance basin.
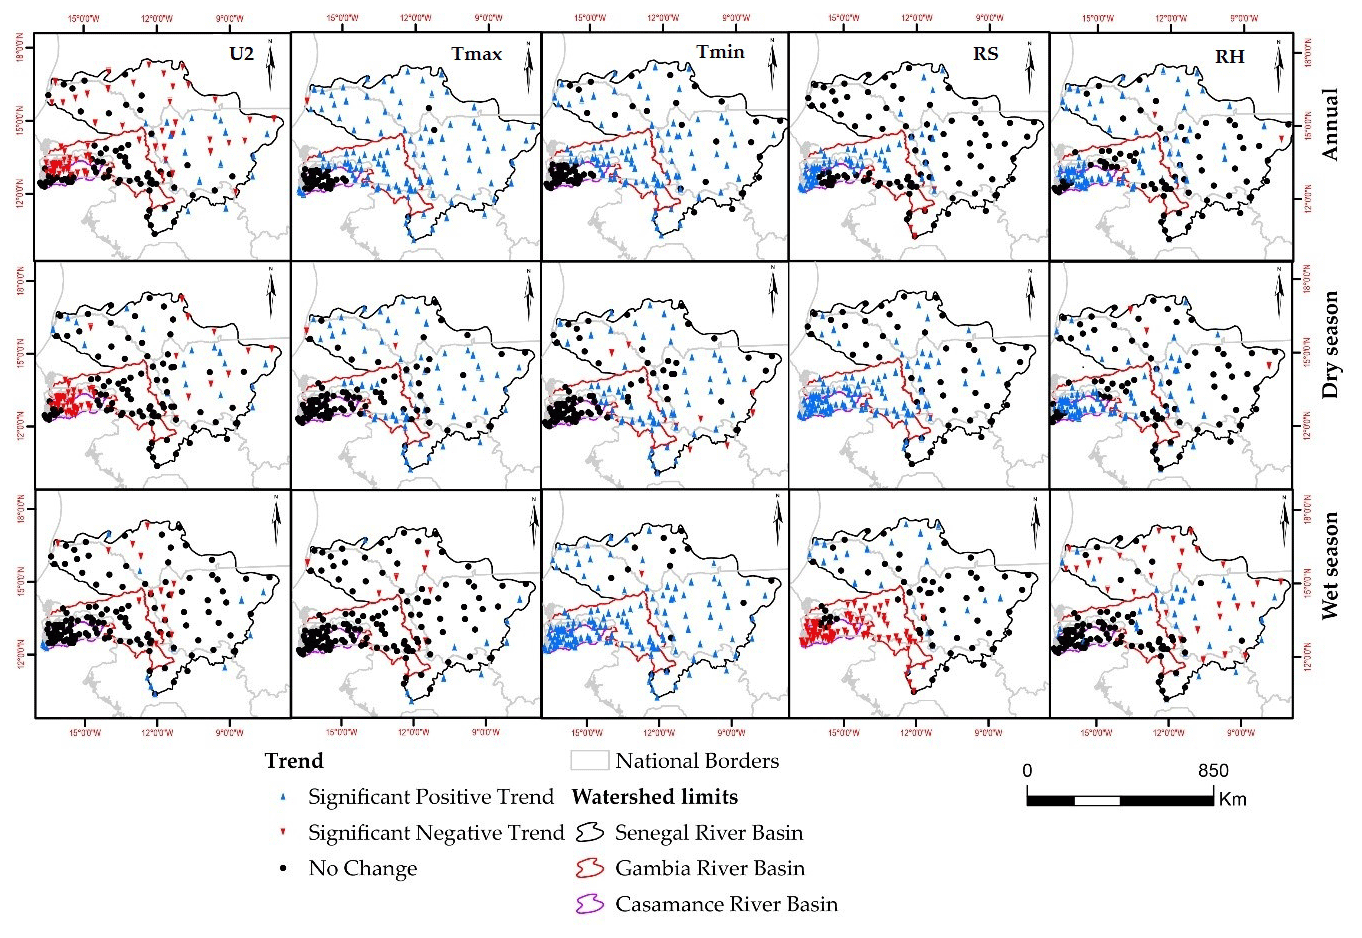
Figure 4Spatial repartition of the trend of climatic variables on annual and seasonal scale over the period 1984–2019 (RH: relative humidity, Tmax: maximum temperature, Tmin: minimum temperature, Rs: Solar radiation and U2: wind speed).
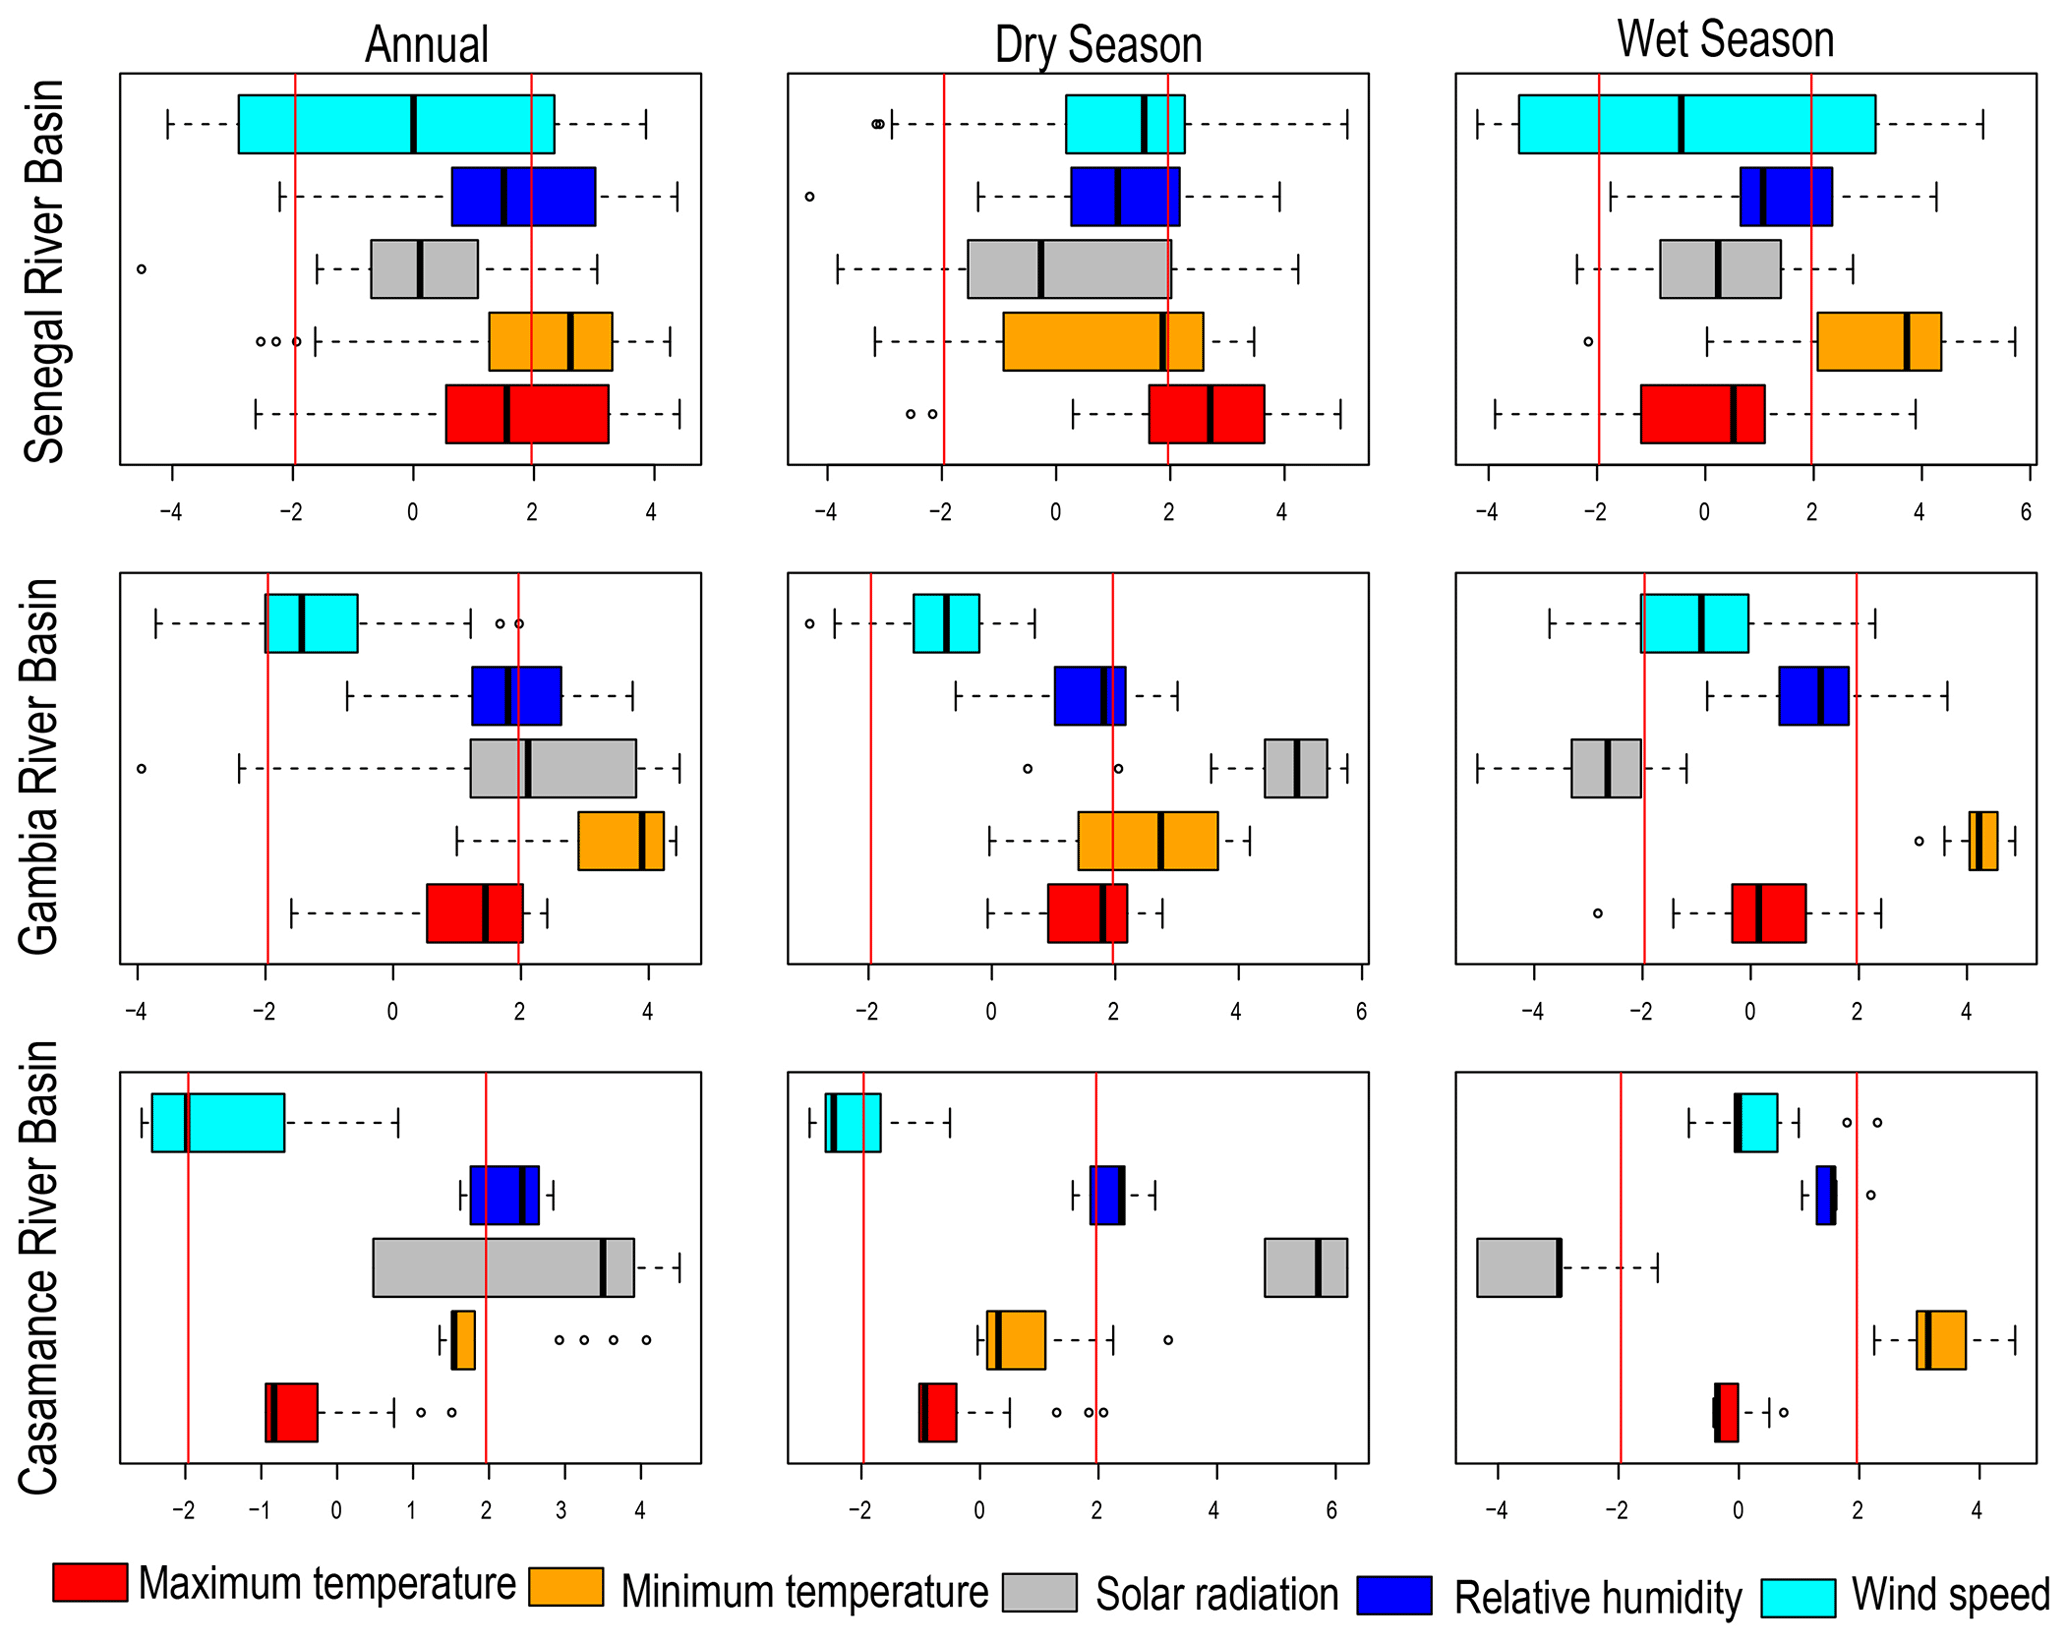
Figure 5Z values of Mann Kendall test of the climate variables at annual and seasonal scale over the period 1984–2019 (red line is the significant level, α=0.05).
3.2 Sensitivity of ET0 to climatic variables
The influence of climatic variables on ET0 was determined by the sensitivity coefficient. The absolute value of this coefficient made it possible to classify the variables according to their degree of influence on ET0 (Fig. 6). Thus, for the Senegal River basin, evapotranspiration is more sensitive to variation in relative humidity, temperature and solar radiation. The influence of wind speed is minimal compared to the other variables. For the Gambia and Casamance basins, ET0 is more sensitive to radiation and maximum temperature on annual scale and during the dry season. On the other hand, in the rainy season, solar radiation and relative humidity have more influence on ET0 than the maximum temperature.
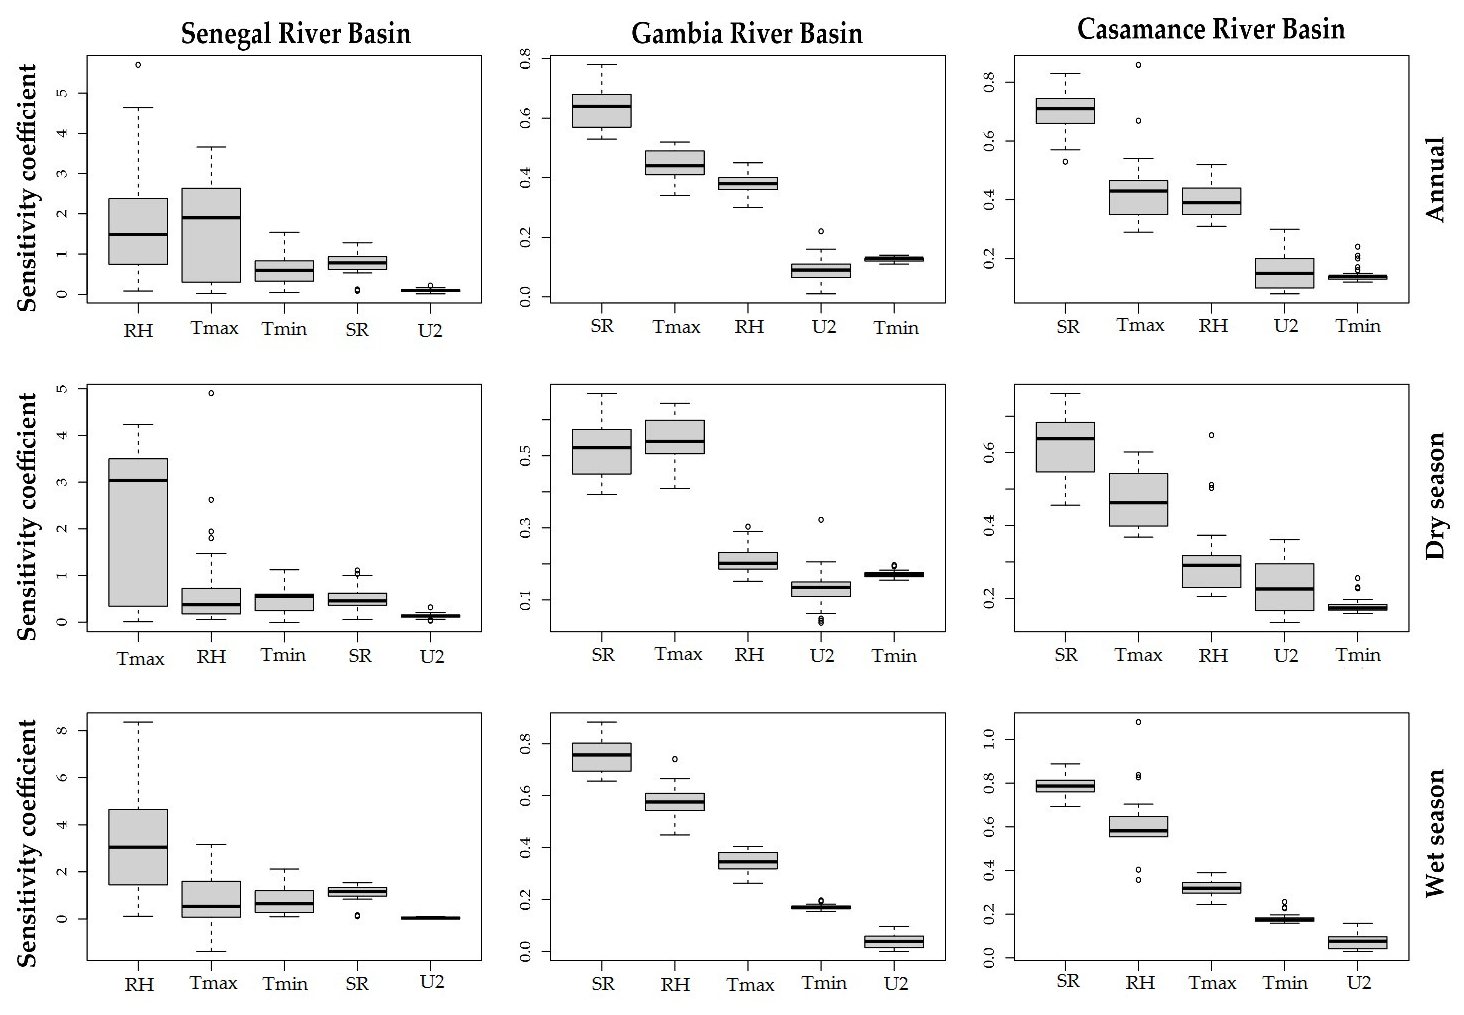
Figure 6Mean sensitivity coefficient of climatic variables over the period 1984–2019 (RH: relative humidity, Tmax: maximum temperature, Tmin: minimum temperature, Rs: Solar radiation and U2: wind speed).
Overall, on the three hydrosystems of Senegal, the ET0 varies slightly. The maximum values of ET0 are observed in the Senegal River basin which extends mainly over the Sahelian and Sudanian zones where the influence of temperatures is more significant. This explains the upward trend in ET0 on annual scale and during the dry season. On the other hand, a downward trend in ET0 was noted in the three hydrosystems, especially during the rainy season. This downward trend in evapotranspiration coincides with a significant increase in annual and seasonal temperatures. This highlights the concept of “evaporation paradox” in the three hydrosystems of Senegal. Because for Mekoya (2020) the decrease in ET0 and the increase in temperature at the same time highlight the existence of evaporation paradox in an area. The decrease in ET0 can be explained by the increase in relative humidity and the decrease in solar radiation and wind speed. In this study, the decrease in wind speed is observed in the three basins on annual scale and during the dry season. Solar radiation decreases significantly in the Gambia and Casamance basins. These results confirm those of Ndiaye et al. (2020b) who showed that the evaporation paradox is linked to the increase in relative humidity and the decrease in solar radiation and wind speed. Similar results were obtained by Qin et al. (2021) who noted that the evaporation paradox is caused by the decreasing in radiation and wind speed in the Huaibei region (China). The significant increase in ET0 in the Sahelian and Sudanian zone can have a negative impact on water resources and vegetation. On the other hand, the downward trend in ET0 may be an indicator of a return to wetter climatic conditions, which improved water availability in the various rivers.
In the three hydrosystems of Senegal, evapotranspiration follows both an upward and downward trend depending on the basins and the periods. The trend of rising temperatures and decreasing ET0 highlights the evaporation paradox in the three hydrosystems of Senegal. This decrease is explained here by the increase in relative humidity and the decrease in radiation and wind speed. Sensitivity analysis reveals that reference evapotranspiration is more sensitive to relative humidity, maximum temperature and solar radiation. The influence of wind speed is not negligible, especially in the Gambia and Casamance basins. However, the reanalysis data used in this study as well as the temporal depth of the series used (1984–2019) may be a source of uncertainty in the results obtained. For a better understanding of ET0 trend, it will be important to investigate the trend of rainfall and the change of landcover/land use in the main hydrosystem of Senegal.
The software R used in this study is freely available (https://www.r-project.org/, last access: April 2023). The code is not publicly accessible. Please contact the authors if you are interested in this research code.
The data of climate variables used in this study are available for public. They come from NASA Langley Research Center (LaRC) POWER Project funded through the NASA Earth Science/Applied Science Program (https://power.larc.nasa.gov/data-access-viewer/, NASA, 2022). Please contact the authors if you are interested in the evapotranspiration data used in this research.
Conceptualization, methodology, software and writing PMN, AB, SBD, review, editing and proofreading LD, AD, AO, and KD. All authors have read and agreed to the published version of the manuscript.
The contact author has declared that none of the authors has any competing interests.
Publisher’s note: Copernicus Publications remains neutral with regard to jurisdictional claims in published maps and institutional affiliations.
This article is part of the special issue “IAHS2022 – Hydrological sciences in the Anthropocene: Variability and change across space, time, extremes, and interfaces”. It is a result of the XIth Scientific Assembly of the International Association of Hydrological Sciences (IAHS 2022), Montpellier, France, 29 May–3 June 2022.
The authors would like to thank ActNao for funding Bassirou Diop's Master's work, the results of which are presented in this document. They are also grateful to SYSTA for according the travel grant to Papa Malick Ndiaye to participate in the 11th Scientific Assembly of the IAHS from 29 May to 5 June 2022 in Montpellier, France.
This paper was edited by Christophe Cudennec and reviewed by Jean-Marie Kileshye-Onema and one anonymous referee.
Allen, R. G., Walter, I. A., Elliot, R. L., Howell, T. A., Itenfisu, D., Jensen, M. E., and Snyder, R.: The ASCE standardized reference evapotranspiration equation, ASCE and American Society of Civil Engineers, 59 pp., https://xwww.mesonet.org/images/site/ASCE_Evapotranspiration_Formula.pdf (last access: March 2022), 2005.
Bodian, A., Diop, L., Panthou, G., Dacosta, H., Deme, A., Dezetter, A., Ndiaye, P. M., Diouf, I., and Vichel Th.: Recent Trend in Hydroclimatic Conditions in the Senegal River Basin, Water, 12, 436, https://doi.org/10.3390/w12020436, 2020.
Chattopadhyay, N. and Hulme, M.: Evaporation and potential evapotranspiration in India under conditions of recent and future climatic change, Agr. Forest Meteorol., 87, 55–74, 1997.
Dacosta, H.: Précipitations et écoulements sur le bassin de la Casamance. Dakar: ORSTOM, 278 pp. multigr. Th. 3e cycle: Géogr. Phys.: Hydrologie, Université Cheikh Anta Diop: Dakar, 1989/07/01, 1989.
Faye, C.: Caractérisation d'un bassin versant par l'analyse statistique des paramètres morphométriques: cas du bassin versant de la Gambie (bassin continental Guineo-Sénégalais), Revue Marocaine de Géomorphologie, 110–127, 2018.
GIEC: Synthèse du rapport AR6 du GIEC publié le 09/08/2021, 1–10, https://theshiftproject.org/article/climat-synthese-vulgarisee-6eme-rapport-giec/ (last access: March 2022), 2021.
Han, S., Xu, D., and Wang, S.: Decreasing potential evaporation trends in China from 1956 to 2005: Accelerated in regions with significant agricultural influence, Agr. Forest Meteorol., 154–155, 44–56, 2012.
Jiao, L. and Wang, D.: Climate Change, the Evaporation Paradox and Their Effects on Streamflow in Lijiang Watershed, Pol. J. Environ. Stud., 27, 2585–2591, https://doi.org/10.15244/pjoes/81290, 2018.
Kendall, M. G.: Rank Correlation Methods, 4th Edition, Charles Griffin, London, 1975.
Li, Y., Feng, A., Liu, W., Ma, X., and Dong, G.: Variation of Aridity Index and the Role of Climate Variables in the Southwest China, Water, 9, 743, https://doi.org/10.3390/w9100743, 2017.
Mann, H. B.: Non-parametric test against trend, Econometrika, 13, 245–259, 1945.
Mekoya, A.: Evaluation of Evaporation Paradox at Tharandt, Environ. Sci. Nat. Resour., 24, 209–214, 2020.
Mjejra, M.: Etude de l'évapotranspiration dans le bassin versant de la Mejerda (Tunisie): Apport de la télédétection satellitaire et des systèmes d'information géographiques, Thèse de doctorat en Géographie, Université de Rennes 2, Rennes. Disponible en ligne: https://tel.archives-ouvertes.fr/tel01281636/document (last access: February 2022), 2015.
NASA: Data Access Viewer, NASA [data set] https://power.larc.nasa.gov/data-access-viewer/, last access: February 2022.
Ndiaye, P. M., Bodian, A., Diop, L., Deme, A., Dezetter, A., and Djaman, K.: Evaluation and Calibration of Alternative Methods for Estimating Reference Evapotranspiration in the Senegal River Basin, Hydrology, 7, 24, https://doi.org/10.3390/hydrology7020024, 2020a.
Ndiaye, P. M., Bodian, A., Diop, L., Deme, A., Dezetter, A., Djaman, K., and Ogilvie, A.: Trend and Sensitivity Analysis of Reference Evapotranspiration in the Senegal River Basin Using NASA Meteorological Data, Water, 12, 1–19, https://doi.org/10.3390/w12071957, 2020b.
Peterson, T. C., Golubev, V. S., and Groisman, P. Y.: Evaporation losing its strength, Nature, 377, 687–688, 1995.
Qin, M., Zhang, Y., Wan, S., Yue, Y., Cheng, Y., and Zhang, B.: Impact of climate change on ”evaporation paradox” in province of Jiangsu in southeastern China, PLOS ONE, 16, 16–26, 2021.
Roderick, M. L. and Farquhar, G. D.: The Cause of Decreased Pan Evaporation over the Past 50 Years, Science, 298, 1410–1411, 2002.
Sen, P. K.: Estimates of the regression coefficient based on Kendall's tau, J. Am. Stat. Assoc., 63, 1379–1389, 1968.
Wilcox, C., Vischela, T., Panthoua, G., Bodian, A., Blancheta, J., Descroix, L., Quantina, G., Casse, C., Tanimoune, B., and Kone, S.: Trends in hydrological extremes in the Senegal and Niger Rivers, J. Hydrol., 566, 531–545, 2018.