the Creative Commons Attribution 4.0 License.
the Creative Commons Attribution 4.0 License.
 | 18 Apr 2024
Estimating the water balance of a small reservoir in the Brazilian semiarid
Ályson B. S. Estácio
Leticia Vieira
Samiramisthais Linhares
Rafaela Alves
Renan Rocha
Eduardo Martins
Small communities in semi-arid regions usually suffer from a lack of data to enable effective water management. This is the case for many rural communities in Brazil that rely on small reservoirs. The aim of this study is to extract information on water storage and water flows of Lagoa Cercada, a small reservoir in the Brazilian semi-arid region. Monthly data series of water levels and water quality were combined with remote sensing information to evaluate water storage in the reservoir. Inflow, withdrawal, and infiltration were calculated using water and salinity balance in the reservoir. The calculated capacity of Lagoa Cercada reservoir was 1.14 million cubic meters. However, using satellite imagery instead of drone imagery resulted in a 51 % difference in the estimation of storage capacity. Additionally, Lagoa Cercada's water withdrawal has not returned to the same amount as before the drought.
- Article
(1320 KB) - Full-text XML
- BibTeX
- EndNote


Water resources data; rural communities; UPH 16; UPH 18
Small communities in semi-arid regions often face not only unreliable water availability but also a lack of sufficient and accurate hydrological data for water management (Jackson et al., 2019; Serrao et al., 2020). The absence of such data (e.g., stored water available, water volume consumption) can have a negative impact on water security and undermine the ability of communities to effectively manage their water resources (Paul et al., 2021; Alazard et al., 2015). This is the situation for many small reservoirs in the Brazilian semi-arid region (BSAR), which, despite being an important source of water for rural communities, are largely unmanaged.
Remote sensing has been a powerful tool to provide or complement information for water management (Wang and Xie, 2018; Garrido-Rubio et al., 2020). In the BSAR, it has been used for mapping weirs and water surfaces (FUNCEME, 2021). Remote sensing can be particularly useful for regions where on-site monitoring is not possible. However, the accuracy of different remote sensing techniques typically requires on-site data to be validated.
Only strategic reservoirs in BSAR have been consistently monitored. For instance, in the state of Ceará (in BSAR) 155 strategic reservoirs are monitored daily out of a total of 100 000 reservoirs. Then, most small reservoirs suffer from data scarcity.
Water balance is a powerful tool for obtaining relevant data for reservoir management (e.g. Arsiso et al., 2017).
Even when limited data is available, the use of appropriate techniques can provide useful estimates of water availability.
In this study, we evaluate the uncertainty of the storage curve, estimate the stored volumes, and water flows, including inflow, withdrawal, and infiltration, using a water balance combined with remote sensing techniques.
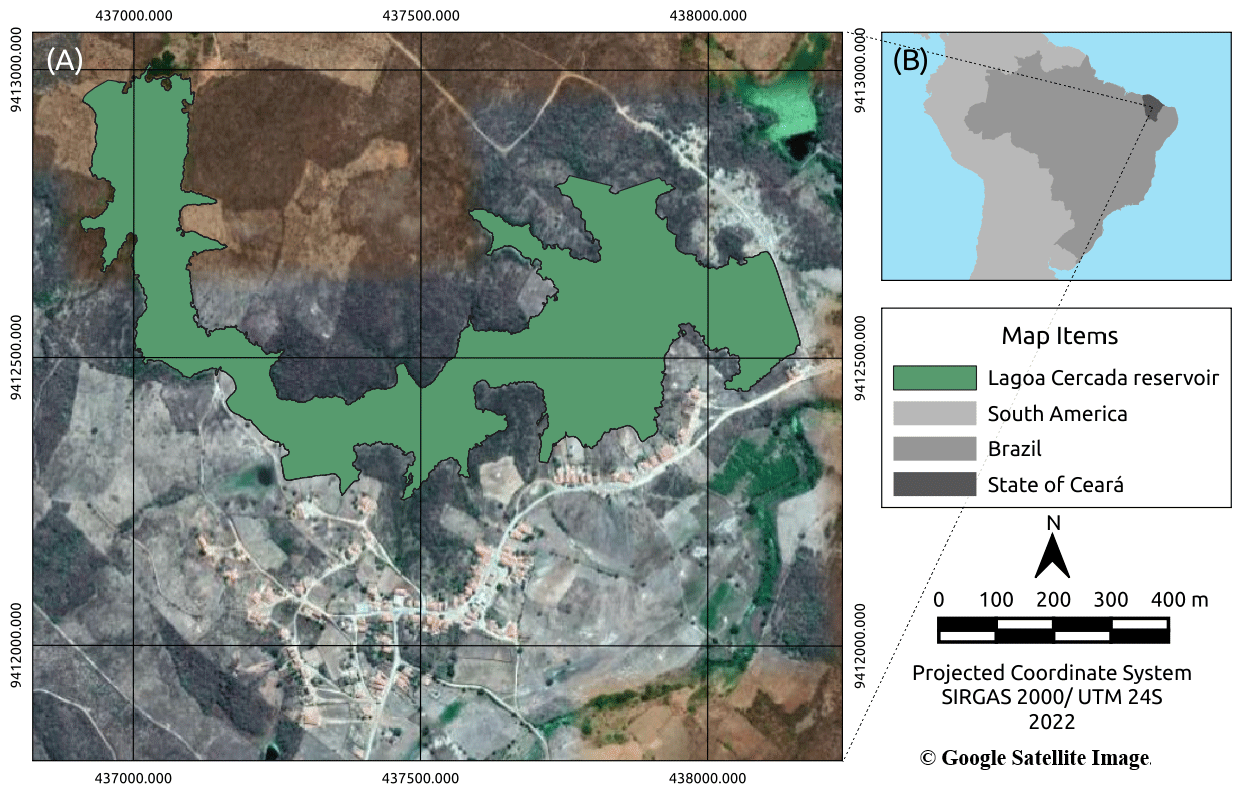
Figure 1Study area. (a) Location of the study area. (b) Lagoa Cercada Community and reservoir. © Google Satellite Image.
Lagoa Cercada is a reservoir located in a rural community in the municipality of Quixeramobim, in the state of Ceará, Brazil (see Fig. 1) That region is characterized by a semi-arid climate, with average annual rainfall of around 810 mm, dropping to less than 600 mm in the inland areas (Werner and Gerstengarbe, 2003). Actual evapotranspiration is about 78 % of annual precipitation (SUDENE, 1980). The rainy season occurs mainly between February and May, accounting for routhly 70 % of the total annual rainfall.
Lagoa Cercada is one of the 100 000 weirs mapped in Ceará, where only 155 strategic reservoirs are monitored daily. Although Lagoa Cercada is not considered a strategic reservoir, the 100-family community located near it uses its water for agriculture and household activities. Fundação Cearense de Meteorologia e Recursos Hídricos (FUNCEME) has been monitoring the water level and quality of Lagoa Cercada on a monthly basis since 2010.
In this study, remoting sensing is used to estimate the storage curve of Lagoa Cercada. This information was combined with monthly data of water level and water quality to perform the water and salinity balances and estimate inflow, withdrawal and infiltration.
The methodology was divided into four steps related to the estimation of (i) storage curve, (ii) stored volumes, (iii) reservoir inflow, and (iv) reservoir withdrawal and infiltration. The steps are described as follows.
3.1 Estimation of the storage curve
Two remote sensing techniques, drone imagery and a satellite product, were used to estimate the storage curve for the reservoir.
Drone images of the reservoir bottom were obtained from an aerial survey carried out in January 2022, when the reservoir was dry. Contour lines (0.2 m) were calculated from the drone images.
Additionally, we used the Digital Elevation Model (DEM) Alos Palsar 12.5 m, which is a satellite product, to directly calculate contour lines (1.0 m).
We considered the relative highs for both storage curves, and the lower high of each storage curve was referred to as high zero.
The differences between both estimations of storage curve were used to quantify the uncertainty of the volume estimations.
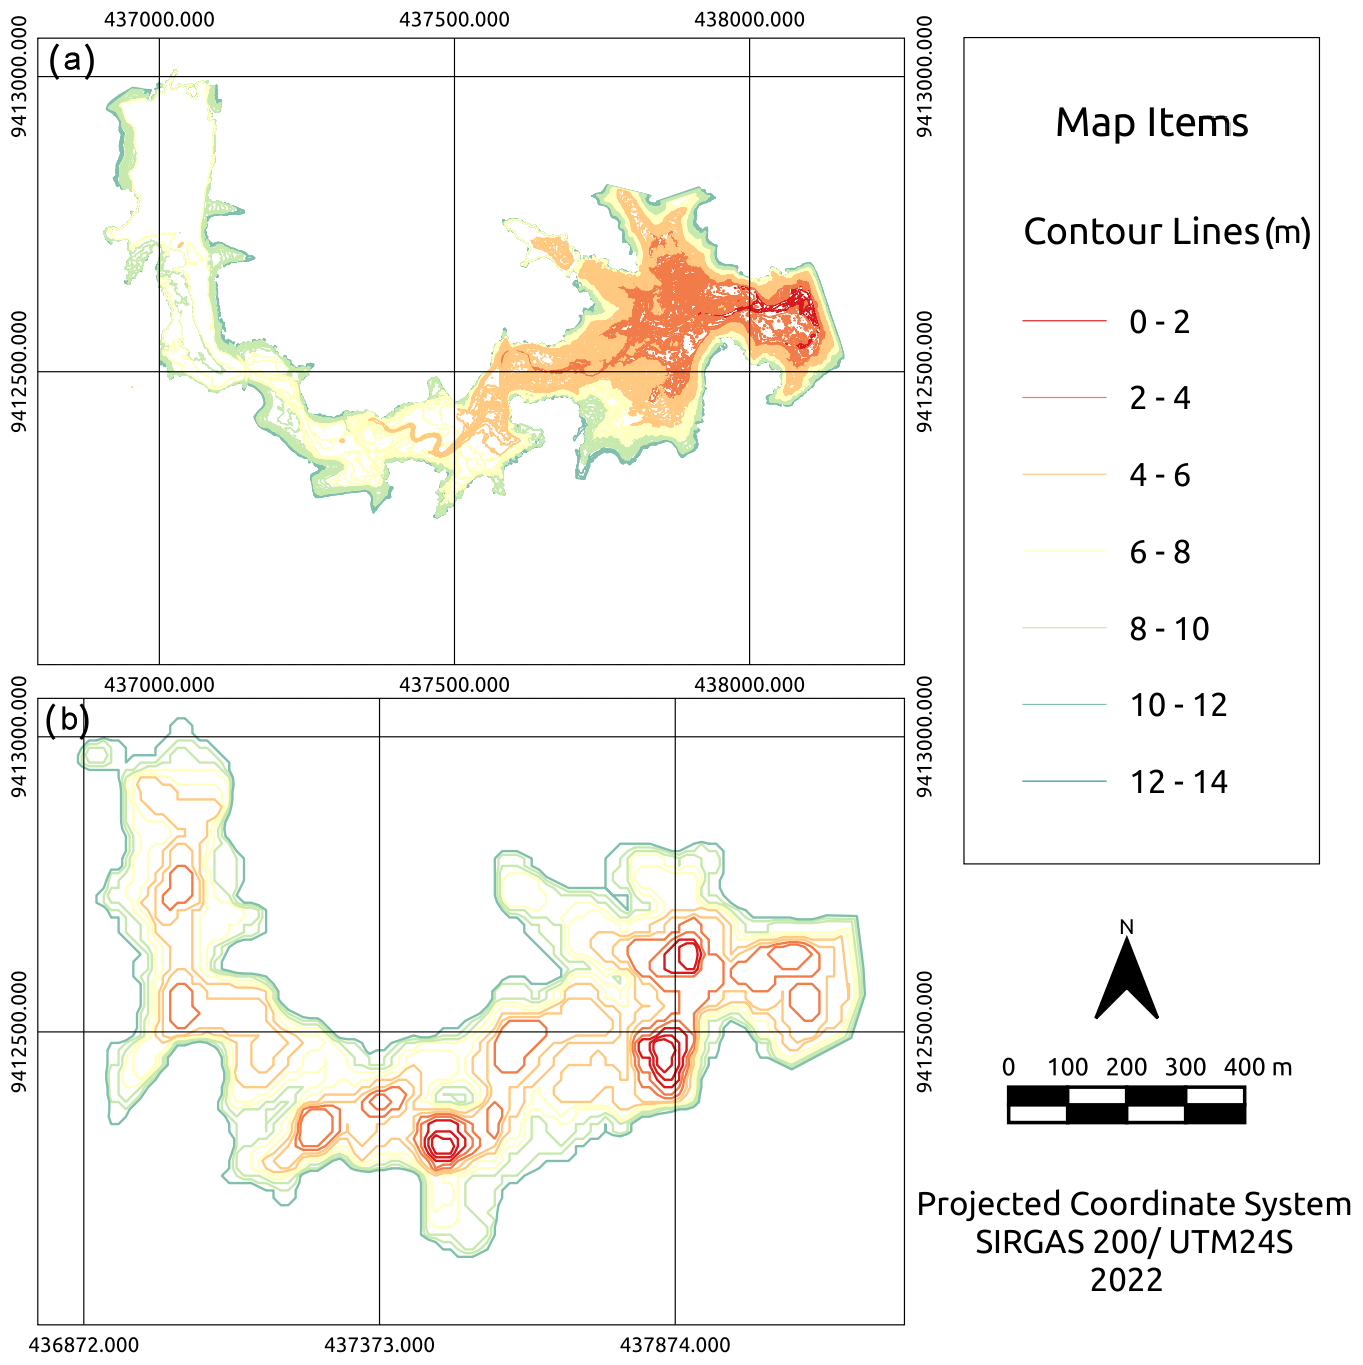
Figure 2Contour lines from (a) drone imagery, and (b) DEM Alos Palsar satellite product.
3.2 Stored volumes estimation
The stored volumes were calculated from water level measurements taken at the end of each month between September 2010 and December 2019. The storage curves, which were estimated in the previous step, was used to convert water level measurements into stored volume estimates. If the measured water level fell between two discrete levels of the storage curve (0.2 or 1.0 m), linear interpolation was used to estimate the volume. The use of different storage curves estimated from drone imagery or satellite products resulted in different estimations of stored volumes. The difference between the stored volume estimations were assessed.
3.3 Water balance and inflow estimation
Monthly inflow volume in the reservoir was calculated using the water balance equation. The water balance between the end of month (i) and the end of the previous month (i−1) was represented by Eq. (1):
where ΔVi is the variation of stored volume during the period, Ii is the inflow volume, Ei is the volume of water evaporated, and Wi is the volume of water withdrawn or lost through lateral infiltration.
The terms Ii, Ei and Wi are incoming or outgoing volumes during the month and correspond numerically to the average flows at the monthly scale (i.e. in units of volume per month).
Water inflow is calculated from Eq. (1) only in the first semester of the hydrological year (December to May), when inflow is expected to occur due to direct precipitation over the reservoir, streamflow, and lateral inflow (superficial and underground). For the rest of the year, inflow is considered null since it is the dry season.
In addition, Wi can be ignored in the first semester. During this period, withdrawal is negligible because rain usually supplies the local demand for water. Rainfed agriculture is the dominant activity in the wet semester, while cisterns fed by rooftop runoff supply household consumption. Therefore, the community conserve Lagoa Cercada's reserve in the wet semester. Furthermore, lateral infiltration losses (i.e., groundwater leaving the reservoir) are also negligible in this period. In the wet period the lateral fluxes in the hydraulic basin tend to be towards the reservoir, i.e., in the opposite direction of infiltration losses. That incoming volume of groudwater is computed together with Ii. This direction of the underground fluxes is due to the shallow soils of the region. Because of that, groundwater levels surrounding the reservoir tend to be higher than the water level in the reservoir during the wet season.
Ignoring Wi in Eq. (1), monthly estimations of Ii were computed for the months of December to May, from December 2010 to December 2019, using stored volumes estimations calculated in the previous step to calculate ΔVi, and using an estimation of Ei.
Ei was estimated from the average monthly evaporation, calculated from the direct measures of an evaporimeter tar in the municipality of Quixeramobim.
Because of the different estimations of stored volumes (i.e. derived from the drone and the satellite storage curves), two estimations of inflow were obtained. We compared both.
3.4 Withdrawal and infiltration
Withdrawal and infiltration are both estimated in an aggregated way within Wi, using Eq. (1).
Wi is only calculated in the second semester of the hydrological year (June to November), when infiltration and withdrawal might be relevant, whereas Ii can be ignored during this period.
Then, to calculate Wi in the second semester, the estimations of ΔVi, and Ei are sufficient, just as in the calculation of Ii in the first semester.
Nevertheless, we were able to calculate Wi independently of an external estimation of Ei, thanks to different effects of Ei and Wi on the reservoir salinity.
Ei is an outflow that preserve the salt mass in the reservoir, while Wi decrease the salt mass. Then, the salinity balance can be used to differentiate Ei and Wi.
In fact, Wi can be calculated by dividing the outgoing salt mass during the month by the average salinity of Wi in the period. Spatial variations of salinity across were not considered. Therefore, salinity of Wi for a specific month is considered equal to the salinity in the reservoir. Additionally, we considered that salinity is proportional to the electrical conductivity, which is also measured during with water level campaigns. Then, Wi was computed for the months June to November, from October 2010 to November 2019 using Eq. (2):
where Vi and Vi−1 are the storage volumes at the end of the month i and (i−1), respectively; and ci and ci−1 are the electrical conductivity at the same dates.
Two different results were obtained for Wi, which are related to the volumes estimated from drone and satellite storage curves.

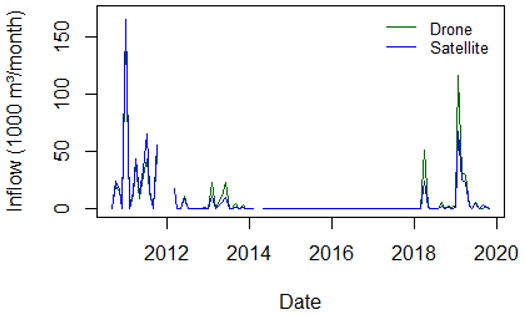
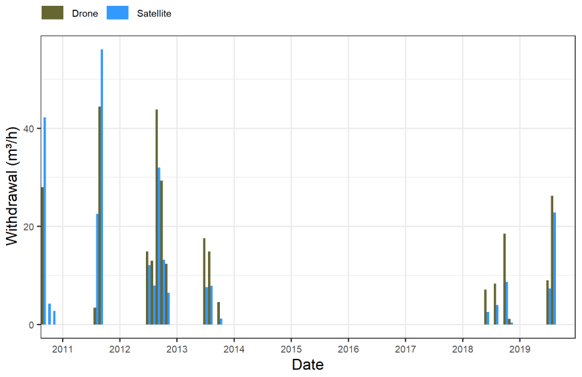
Figure 6Estimated monthly W (withdrawal and infiltration) during the second semester of the hydrological year (June–November) for Lagoa Cercada reservoir.
4.1 Storage curves
The contour lines obtained from drone imagery and satellite product (see Fig. 2) differ in precision, with the former being more precise at 0.2 m and the latter at 1.0 m. As a result, the storage curves shown in Fig. 3 also differ.
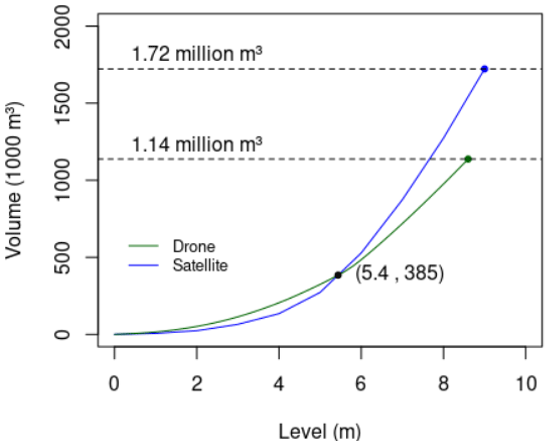
Since the storage curve derived from the drone imagery is considered more reliable due to the precision of its contour lines, the uncertainty associated with the use of the storage curve derived from the satellite DEM can be estimated by comparison.
The storage curve from satellite product underestimates lower volumes (i.e. volumes under 385 000 m3) and overestimates higher one. The difference is smaller for low volumes.
The total capacity of Lagoa Cercada is estimated to be 1 140 000 m3, according to the drone imagery.
However, the storage curve derived from the satellite DEM indicates a 51 % larger maximum volume (i.e. 1 720 000 m3).
4.2 Stored volumes
The time series for the stored volume according to both storage curves is depicted in Fig. 4, with the discontinuity of the lines due to missing monitored data.
Both time series shows the rapid drying up of the reservoir in 2012 and the continuity of null volumes until 2018, corresponding to the recent drought in the state of Ceará (Pontes Filho et al., 2020).
The volumes derived from satellite storage curve are lower than those estimated from drone storage curve, which is used as reference due to its higher precision.
This result is due to the underestimation of volumes under 385 000 m3 presented in the previous section. Throughout the analysis period, the volumes never exceeded that threshold.
Excluding the completed dry period 2014–2017, the mean absolute difference between drone- and satellite-derived volumes is 32 000 m3. This represents only about 10 % of the higher volume in the assessed period.
4.3 Inflow
Figure 5 shows the estimated inflow series based on the two different storage curves. The difference between the estimations is related to the precision of the storage curves used to calculate the stored volumes for the water balance.
Since the storage curve derived from drone images is more precise, the inflows derived from it are considered as a reference in this analysis, as no inflow measurements are available.
The inflow calculated using the satellite storage curve underestimates the reference inflow until 2012 and overestimates it since 2013. The mean absolute difference between the two estimations was 3600 m3 per month (i.e. 120 m3 d−1), excluding the period 2012–2017, when there was no inflow.
4.4 Withdrawal and infiltration
In Fig. 6, the evolution of the withdrawal and infiltration (i.e. Wi) during the second semester is presented.
Wi was lower in the period 2018–2019 than in the period 2012–2013. Nevertheless, the stored volumes were similar in both periods (i.e. in the beginning the drought and after it). Using the hypothesis that infiltration losses are strongly related to the water level in the reservoir, one could state that the reduction of Wi is due to a reduction in withdrawal.
This result indicates that even if the reservoir volume has recovered to a level like the one observed in 2012–2013, the water consumption has not returned to the same amount. That means that water consumption may have been affected by the recent history of the local water system, which is an effect called hysteresis (Souza Filho et al., 2018).
Remote sensing and water balance techniques, combined with on-site data, were used to obtain information on the capacity of Lagoa Cercada reservoir and its water fluxes.
The main findings were:
-
The capacity of Lagoa Cercada reservoir is 1.14 million m3
-
DEM Alos resulted in a 51 % difference in the estimation of storage capacity of Lagoa Cercada reservoir.
-
Lagoa Cercada's water withdrawal has not returned to the same amount as before the drought.
-
Drone imaging and water balance techniques can enable monthly reservoir monitoring to provide information on stored volume, inflow, withdrawal, and infiltration.
The framework proposed in this paper can be replicated in other reservoirs of similar size in the Brazilian semiarid region, which might be the main source of water for a local rural community, such as Lagoa Cercada reservoir.
Code and data can be made available upon request directly to the authors.
The authors confirm contribution to the paper as follows: conceptualization, formal analysis, methodology, and writing: ÁBSE; aerial survey and data treatment: LV; data collection: SL and RA; supervision and validation: RR and EM.
The contact author has declared that none of the authors has any competing interests.
Publisher’s note: Copernicus Publications remains neutral with regard to jurisdictional claims in published maps and institutional affiliations.
This article is part of the special issue ”IAHS2022 – Hydrological sciences in the Anthropocene: Variability and change across space, time, extremes, and interfaces”. It is a result of the XIth Scientific Assembly of the International Association of Hydrological Sciences (IAHS 2022), Montpellier, France, 29 May–3 June 2022.
The authors would like to thank Fundação Cearence de Meteorologia e Recursos Hídricos (FUNCEME), ARID as a researchers’ network and French Agricultural Research Centre for International Development (CIRAD).
This paper was edited by Christophe Cudennec and reviewed by two anonymous referees.
Alazard, M., Leduc, C., Travi, Y., Boulet, G., and Ben Salem, A.: Estimating evaporation in semi-arid areas facing data scarcity: Example of the El Haouareb dam (Merguellil catchment, Central Tunisia), J. Hydrol., 3, 265–284, https://doi.org/10.1016/j.ejrh.2014.11.007, 2015.
Arsiso, B. K., Tsidu, G. M., Stoffberg, G. H., and Tadesse, T.: Climate change and population growth impacts on surface water supply and demand of Addis Ababa, Ethiopia, Climate Risk Management, 18, 21–33, https://doi.org/10.1016/j.crm.2017.08.004, 2017.
Funceme: Mapeamento das barragens dos pequenos reservatórios d'água situados no Estado do Ceará, Technical report, Funceme, Fortaleza, 2021.
Garrido-Rubio, J., González-Piqueras, J., Campos, I., Osann, A., González-Gómez, L., and Calera, A.: Remote sensing-based soil water balance for irrigation water accounting at plot and water user association management scale, Agr. Water Manage., 238, 106236, https://doi.org/10.1016/j.agwat.2020.106236, 2020.
Jackson, M., Stewart, R., Fielding, K., Cochrane, J., and Beal, C.: Collaborating for Sustainable Water and Energy Management: Assessment and Categorisation of Indigenous Involvement in Remote Australian Communities, Sustainability-Basel, 11, 427–456, https://doi.org/10.3390/su11020427, 2019.
Paul, M., Rajib, A., Negahban-Azar, M., Shirmohammadi, A., and Srivastava, P.: Improved agricultural Water management in data-scarce semi-arid watersheds: Value of integrating remotely sensed leaf area index in hydrological modeling, Sci. Total Environ., 791, 148177, https://doi.org/10.1016/j.scitotenv.2021.148177, 2021.
Pontes Filho, J. D., Souza Filho, F. A., Martins, E. S. P. R., and Studart, T. M. C.: Copula-Based Multivariate Frequency Analysis of the 2012–2018 Drought in Northeast Brazil, Water-Sui, 12, 834–855, https://doi.org/10.3390/w12030834, 2020.
Serrao, L., Molinos-Senante, M., Bezzi, M, and Ragazzi, M.: Assessment of wastewater reuse potential for irrigation in rural semi-arid areas: the case study of Punitaqui, Chile, Clean Technol. Envir., 22, 1325–1338, https://doi.org/10.1007/s10098-020-01874-3, 2020.
Souza Filho, F. A., Formiga-Johnsson, R. M., de Carvalho Studart, T. M., and Abicalil, M. T.: From Drought to Water Security: Brazilian Experiences and Challenges, in: Water Resources Development and Management, Springer, Singapore, 233–265, https://doi.org/10.1007/978-981-10-7913-9_10, 2018.
Sudene: Plano de Aproveitamento Integrado de Recursos Hídricos do Nordeste do Brasil, Plan, Sundene, Recife, 1980.
Wang, X. and Xie, H.: A Review on Applications of Remote Sensing and Geographic Information Systems (GIS) in Water Resources and Flood Risk Management, Water-Sui, 10, 608–618, https://doi.org/10.3390/w10050608, 2018.
Werner, P. C. and Gerstengarbe, F. W.: The climate of Piauí and Ceará, in: Global Change and Regional Impacts, edited by: Gaiser, T., Krol, M., Frischkorn, H., and De Araújo, J. C., Springer, Berlin, Heidelberg 81–86, https://doi.org/10.1007/978-3-642-55659-3_5, 2003.