the Creative Commons Attribution 4.0 License.
the Creative Commons Attribution 4.0 License.
 | 18 Apr 2024
Rainfall risk over the city of Abidjan (Côte d'Ivoire): first contribution of the joint analysis of daily rainfall from a historical record and a recent network of rain gauges
Modeste Kacou
Ehouman Serge Koffi
Amidou Dao
Clément Dutremble
Maurice Guilliod
Bamory Kamagaté
Jean-Louis Perrin
Christian Salles
Luc Neppel
Jean-Emmanuel Paturel
Eric Pascal Zahiri
Luc Séguis
Every year, rains cause material damage and human losses, in Abidjan (Côte d'Ivoire). The objective of this study is to contribute to the characterization of the rain hazard in the District of Abidjan. The available data are made up of daily rainfall from a historical station “Abidjan airport” (1961–2014) and an academic network of rain gauges (21) progressively implemented in Abidjan since 2015. A descriptive analysis (date of occurrence, rainfall depth, mean wet days intensity and number of rainy days) on the Highest Cumulative Rainfall Periods (HCRP: 60 d) is conducted on the long-term station. The periods of highest risk of flooding during the long and short rainy seasons are characterized. The Experimental variograms of extreme rainfalls derived from the current network, allow to evaluate their extensions according to the rainy season.
- Article
(3314 KB) - Full-text XML
- BibTeX
- EndNote


SDG11; Field observation; Rainfall risk; Abidjan; Côte d'Ivoire
Globally, climate change has increased the occurrence of natural disasters, primarily floods, resulting in loss of life and property (Alfieri et al., 2017). In African metropolises, stormwater drainage infrastructure rarely matches the rapid urbanisation associated with high population growth rates in cities (Amoako and Inkoom, 2018). Imperviousness and poor drainage systems combine to increase flood risk (Duan et al., 2016). In terms of climate change, increased rainfall is also likely to lead to increased flooding. In the Sahel, the contribution of extreme rainfall days to annual totals has increased in recent decades (Panthou et al., 2018). Further South, on the edge of Gulf of Guinea and in particularly in Côte d'Ivoire, the rainfall estimation product CHIRPS, Didi et al. (2020) show the absence of a significant increase in rainfall intensity in agreement with the results of the study by Goula et al. (2012) based on the Côte d'Ivoire rainfall network.
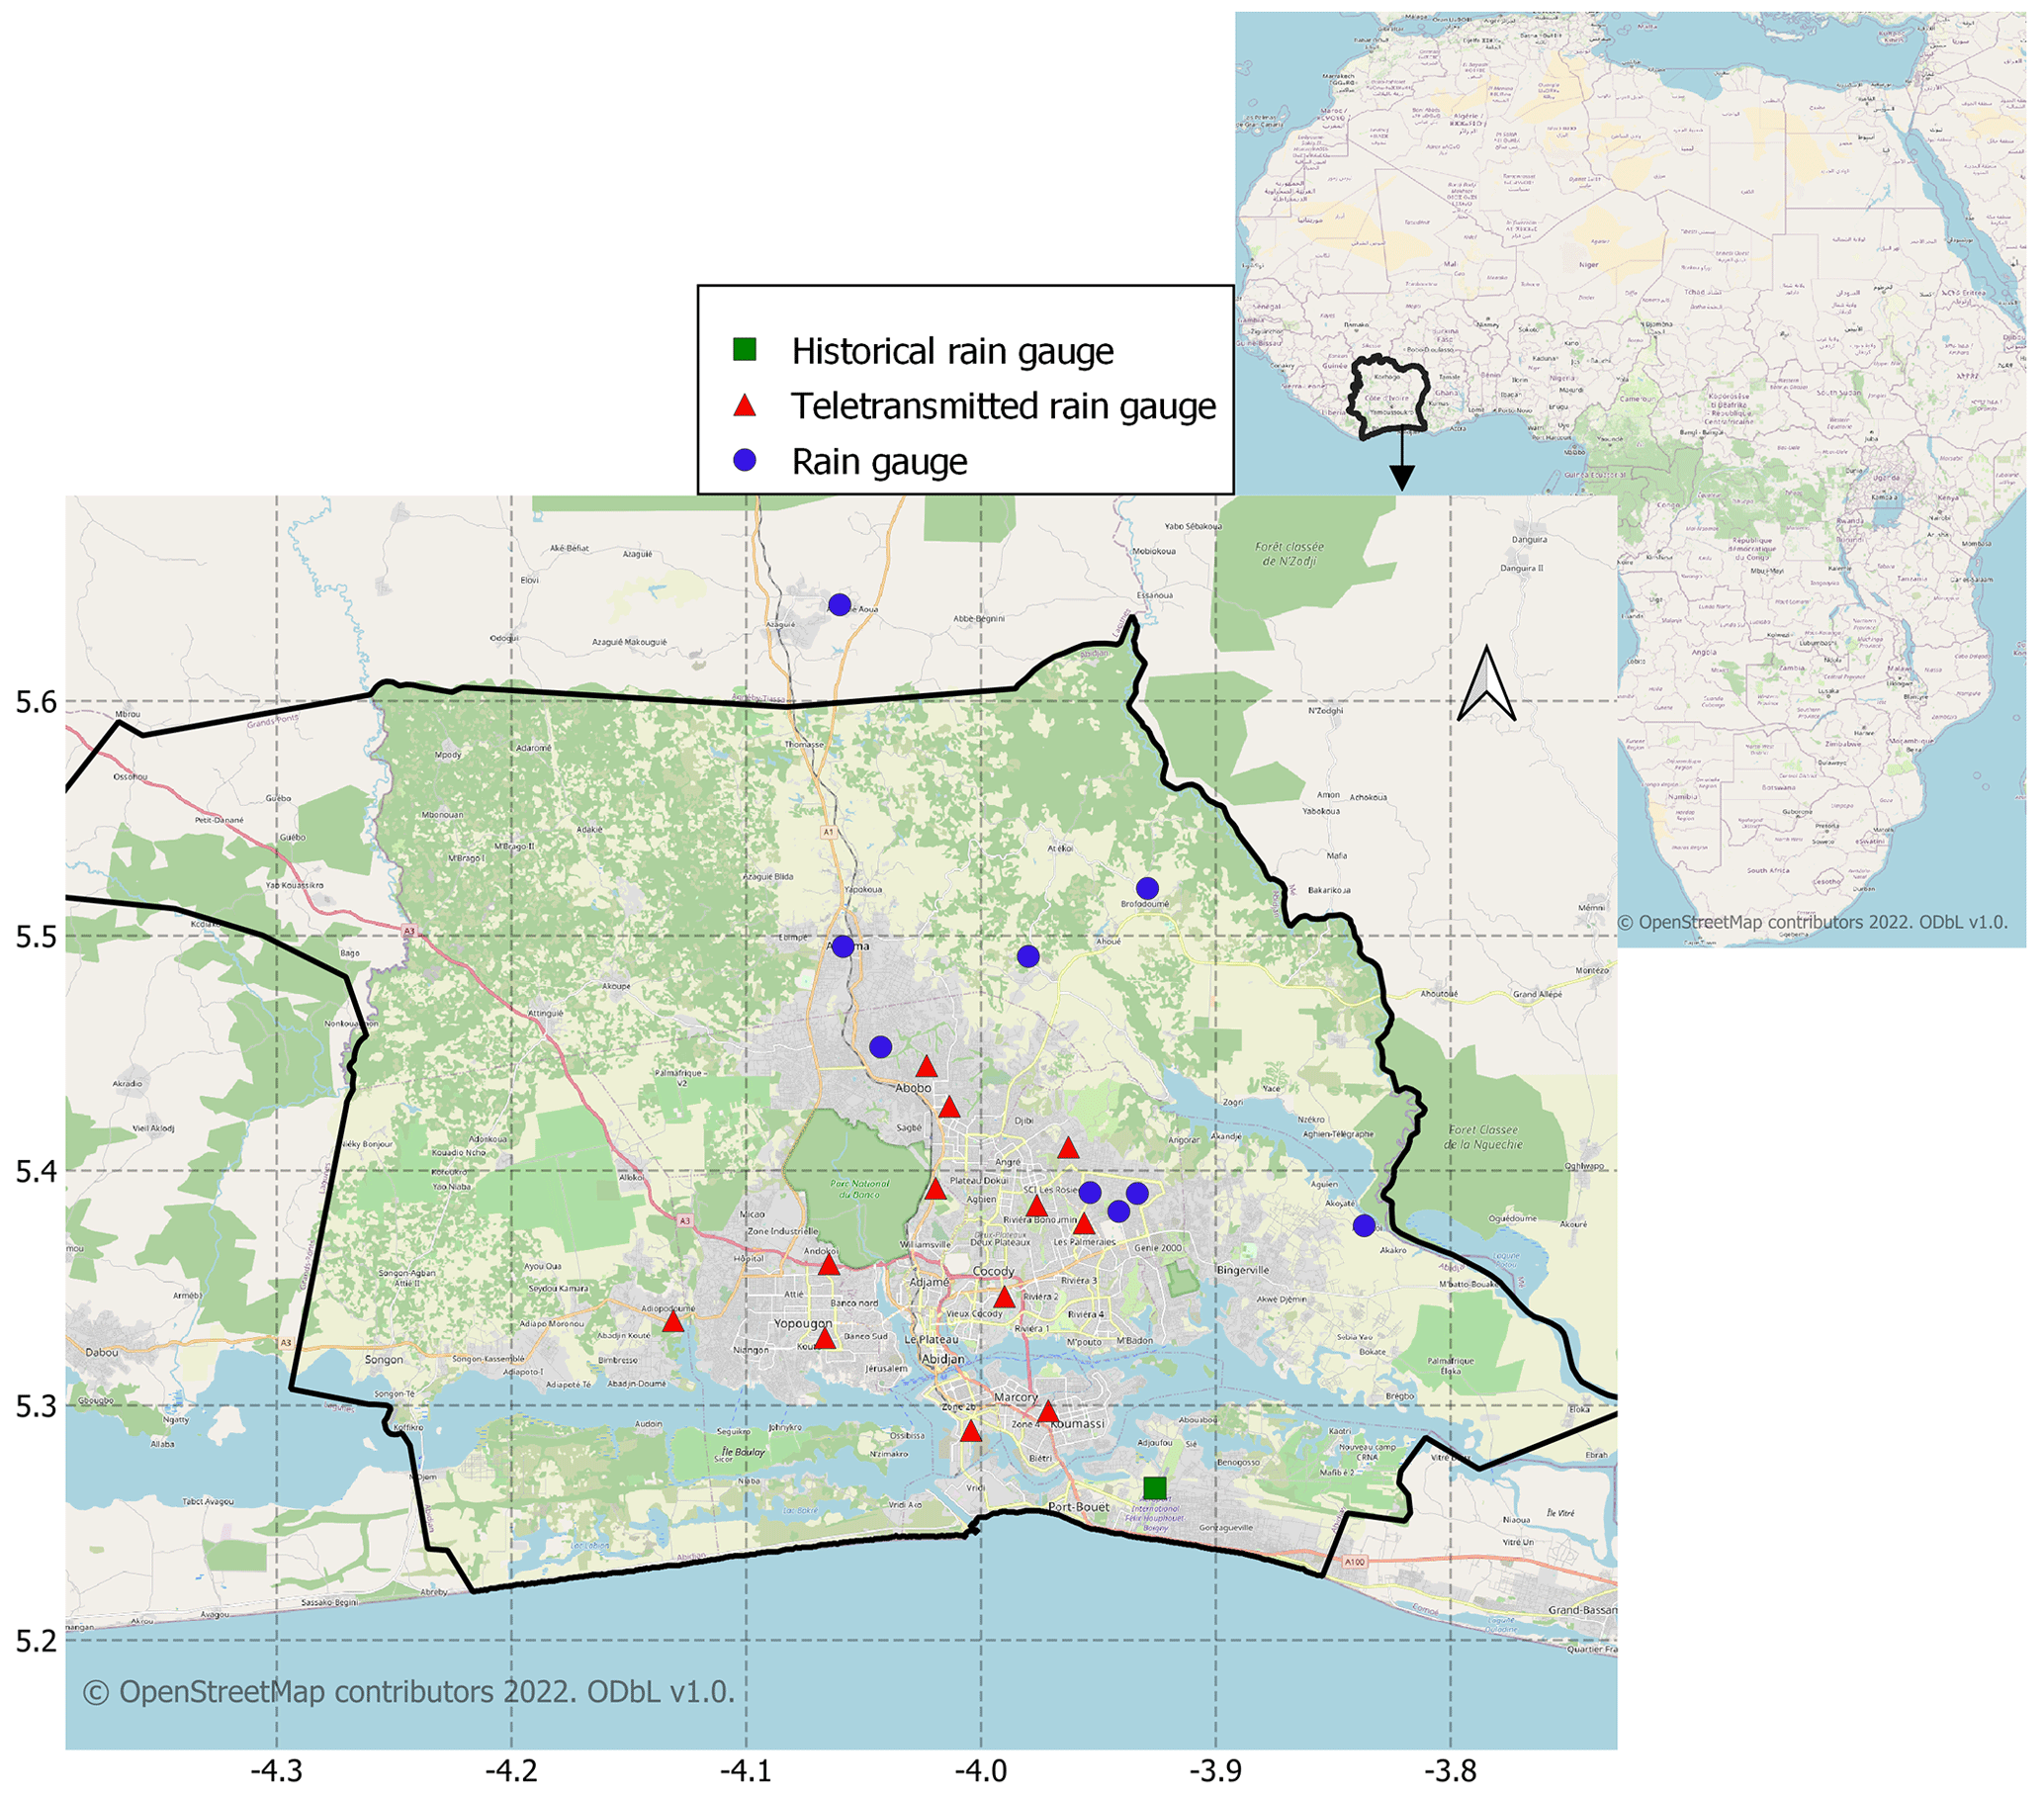
Figure 1University network of rain gauges deployed in Abidjan since 2015 and historical rain gauge of the National Meteorology. © OpenStreetMap contributors 2022. Distributed under the Open Data Commons Open Database License (ODbL) v1.0.
In order to provide more relevant information for policy makers in terms of local flood risk, this study focuses on rainfall in the city of Abidjan. Every year, about ten people lose their lives due to flooding (OCHA, 2013). While previous studies have characterised rainfall over fixed periods (annual or seasonal), this study deals with the Highest Cumulative Rainfall Periods (HCRP 60 d) likely to generate floods, using data from the Abidjan airport long-term station and an academic network of rain gauges progressively installed since 2015 (Fig. 1). Specifically, the temporal stationarity, rainfall indices qualifying the risk of flooding, the distribution of heavy rainfall and their spatial variations will be analysed on the HCRPs.
2.1 Presentation of the study area
The climate in Abidjan is sub-equatorial, hot and humid. It has a Long Rainy Season (LRS, generally from May to July) and a Short Rainy Season (SRS, generally from September to November). The average annual rainfall is 1819 mm from 1961 to 2015 (Météorologie Nationale).
2.2 Daily rainfall data
2.2.1 The academic rain gauge network
21 Precis Mécanique® tipping bucket rain gauges are distributed mainly in the urbanised area of Abidjan district with a higher density in the most flood-prone area of the Cocody commune. The criticised daily rainfall (Zahiri et al., 2021) shows a gap rate of about 12 % between 2015 and 2021. They were filled, for each station, by linear regression with neighbouring stations without gaps (this work is not described in this study).
2.2.2 Abidjan Airport Station
The Airport station is a National Meteorological station with a daily rainfall record from 1961 to 2015 with gaps for the years 2002, 2003 and 2004. This historical series constitutes the reference climatological data for this study.
2.3 Methods
2.3.1 Calculation of the Highest Cumulative Rainfall Periods (HCRP)
The HCRPs are calculated for the Abidjan airport series, taking the highest values of 60 d moving sums, before and after August. They are determined separately for the Long and Short Rainy Seasons (LRS and SRS). The significance of the trends is assessed using the Mann Kendal test. The Kolmogorov-Smirnov test is used to see to what extent the daily rainfall distributions during the LRS, SRS and the rest of the year are significantly different or not.
2.3.2 Calculation of climate change detection indices
ETCCDI (Expert Team on Climate Change Detection and Indices, Zhang et al., 2011) indices such as total rainfall (PRCPTOT), number of rainy days (RR1), average daily rainfall (SDII) and daily rainfall not exceeded 90 % of the time (R90) were calculated in the HCRP at the historical station and at each station in the academic network on rainy days (≥1 mm) (Nkrumah et al., 2019). These indices describe a set of parameters that can characterise the occurrence or non-occurrence of flooding.
2.3.3 Spatial analysis
The variogram is used to study the spatial variability of observations in a data set. It is calculated as follows:
where γ(h) is the variogram; N(h) is the number of pairs separated by the distance h; xi is the position in space of the value z and z the quantity studied (R90 in the HCRP).
These variograms are constructed using the rainy days during which at least one station in the network recorded a cumulative rainfall greater than or equal to 47 mm. The 47 mm threshold represents the 90th quantile (recurrence 10 times a year) of daily rainfall not exceeded from 1961 to 2015 at the Abidjan airport station. This value is close to the 50 mm used by Goula et al. (2012) to characterise extreme rainfall in Côte d'Ivoire.

Figure 2Interannual and spatial variability of annual rainfall of the academic network (median and annual extremes) plotted on the annual rainfall cumulative distribution function curve of the historical station Abidjan Airport.
3.1 Temporal and spatial variability of annual rainfall
The annuals rainfalls (average and extremes) of the network stations are plotted on the cumulative frequency distribution of the annual rainfall series at the historical station (Fig. 2). The 6 years (2016–2021) of observations in the network already allow us to approach the extremes of the long-term chronicle. There is significant variability from one year to the next. 2016 was a dry year with an inter-station average of 1508 mm exceeded in about one year out of five. 2017 was very wet (2458 mm), exceeded only once in the Abidjan airport series. The other years show average inter-station rainfall close to the inter-annual average for Abidjan airport.
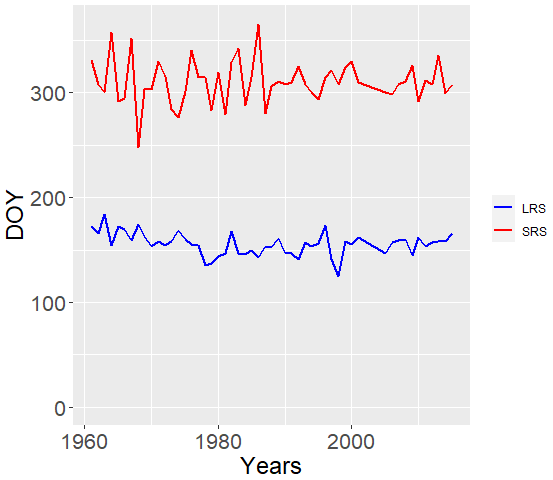
Figure 3DOY of HCRP during LRS and SRS on the long-term daily rainfall series of Abidjan Airport.
3.2 Dates of occurrence of HCRPs in the historical series
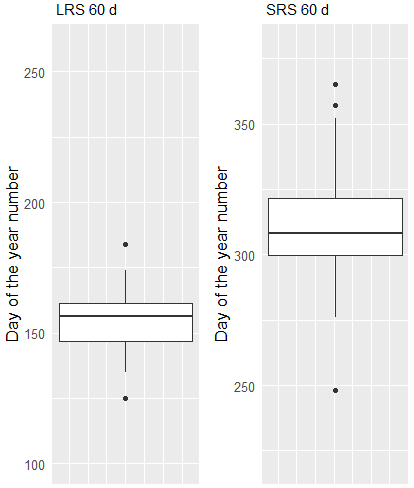
Figures 3 and 4 show respectively the central dates of occurrence (in DOY) of the HCRP from 1961 to 2015 and the associated boxplots. In both figures, there is a higher variability of the HCRP during the short rainy season than during the long rainy season.
The Mann Kendal test shows that there is no trend in the dates of occurrence of HCRPs during the long and short rainy seasons (with p-values of 0.16 and 0.85 respectively).

Figure 5Temporal evolution of rainfall indices of the 10-year moving averages of total rainfall (PRCPTOT) (a, b); mean intensity of wet days (SDII) (c, d); number of wet days (RR1) (e, f), and 90th percentile (R90) (g, h) during the Highest Cumulative Rainfall Periods of Long Rain Season (LRS) and Short Rain Season (SRS).
3.3 Rainfall indices during HCRPs
In absolute values, the HCRP indices of the long and short rainy seasons (Fig. 5) are strongly differentiated: PRCPTOT is more than twice as strong during the long rainy season (954 mm versus 366 mm). This is also the same ratio for SDII, the average daily rainfall (28 mm d−1 versus 16 mm d−1). R90 is equal to 68 mm (interannual average of annual R90) during the long rainy season for about 30 mm during the short rainy season.
At the scale of the whole series, the deficit signal of the years 1983–1995 is particularly visible on PRCPTOT, SDII and R90 of the HCRP of LRS. This deficit period is not present on the same indices describing the HCRP of SRS.
In terms of trends from 1961 to 2015, the following points can be noted for each season:
-
No significant trend for the SRS indices,
-
Significant decreases in PRCPTOT and RR1 accompanied by a less significant decrease in SDII for the LRS. There is also no trend for R90.
Table 1Trends (slope and p-value) for cumulative rainfall (PRCPTOT), number of rainy days (RR1), mean rainfall (SDII) and daily rainfall of quantile 0.90 (R90) during the HCRPs of the 2 rainy seasons.

Significant (p-value ≤5 %). * Weakly significant. – not significant (p-value >20 %).

Figure 6Distribution of daily rainfall during the HCRP 60 of both rainy seasons (LRS and SRS) and during the rest of the year (dry period).
3.4 Distribution of daily rainfall
The non-parametric Kolmogorov Smirnov test carried out in pairs between the 3 distributions (LRS, SRS and rest of the year) gave p-values in the order of 10−10 well below the significance level of 10−2 (Fig. 6). The 3 distributions are significantly different. It is during the HCRP of the LRS that the daily rainfall is the highest.
Over the year, intense, extreme and very extreme daily rainfall occurs from 77 % to 100 % during the HCRPs of LRS (Table 2).
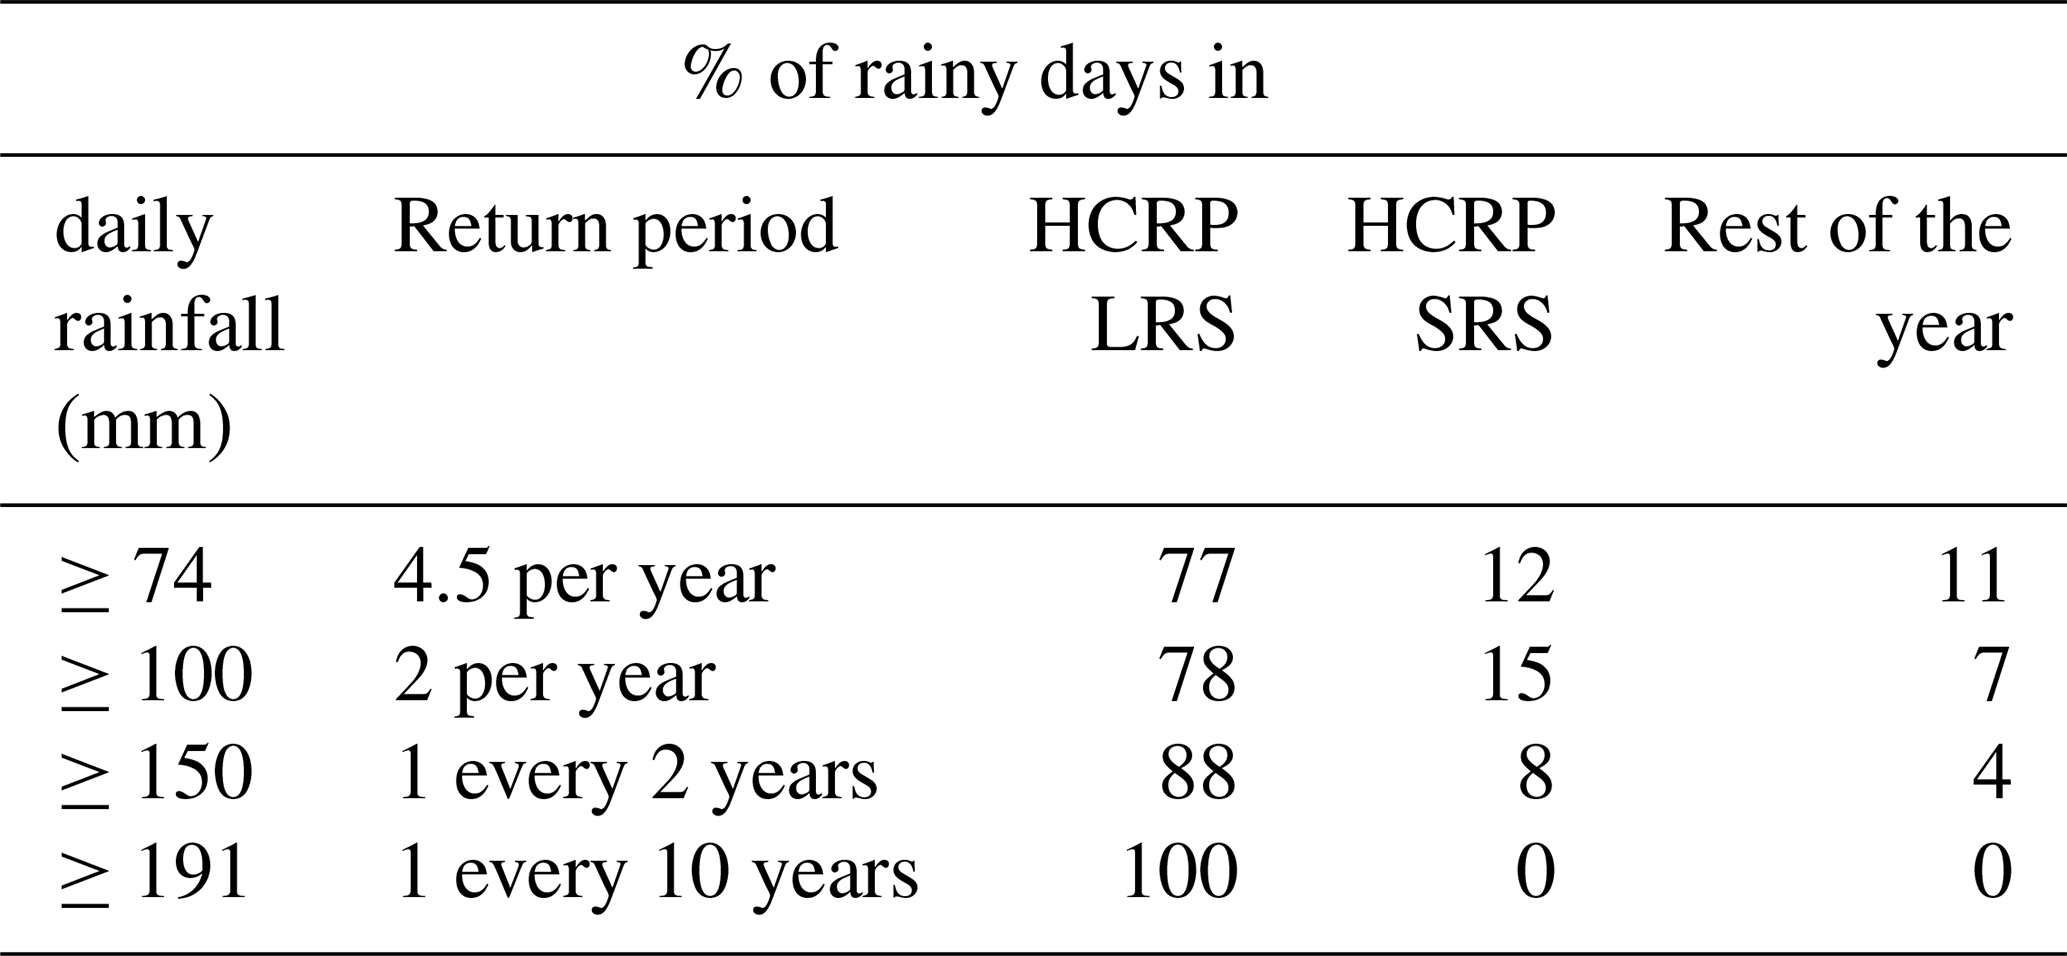
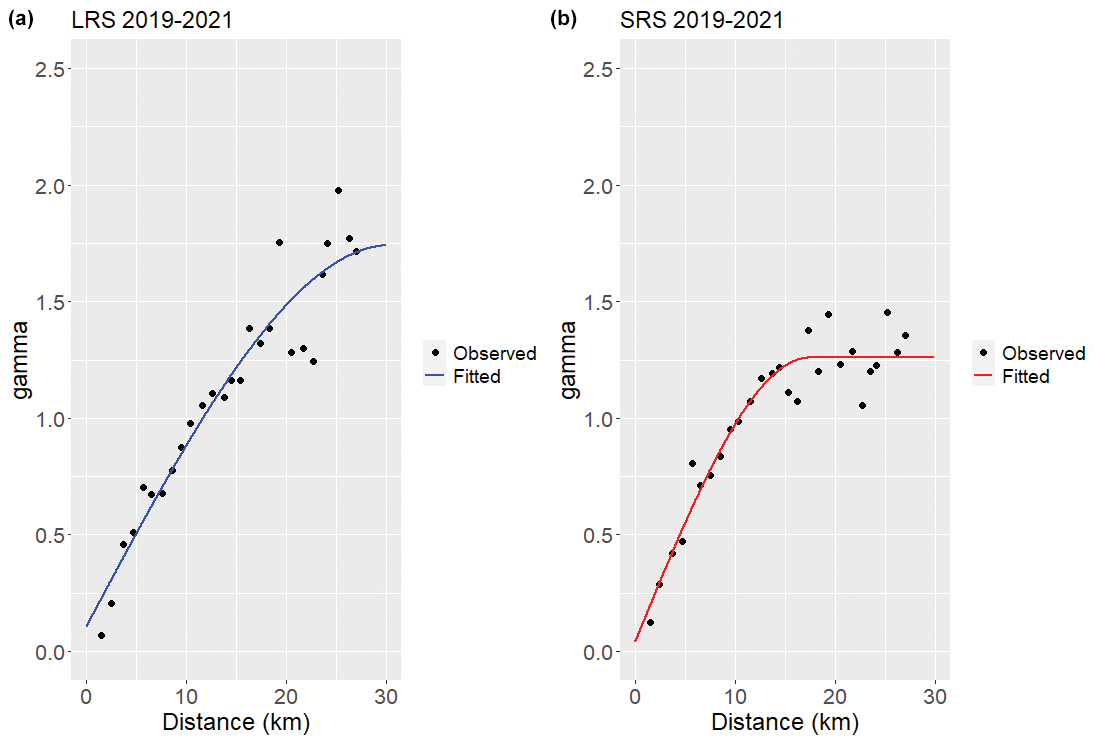
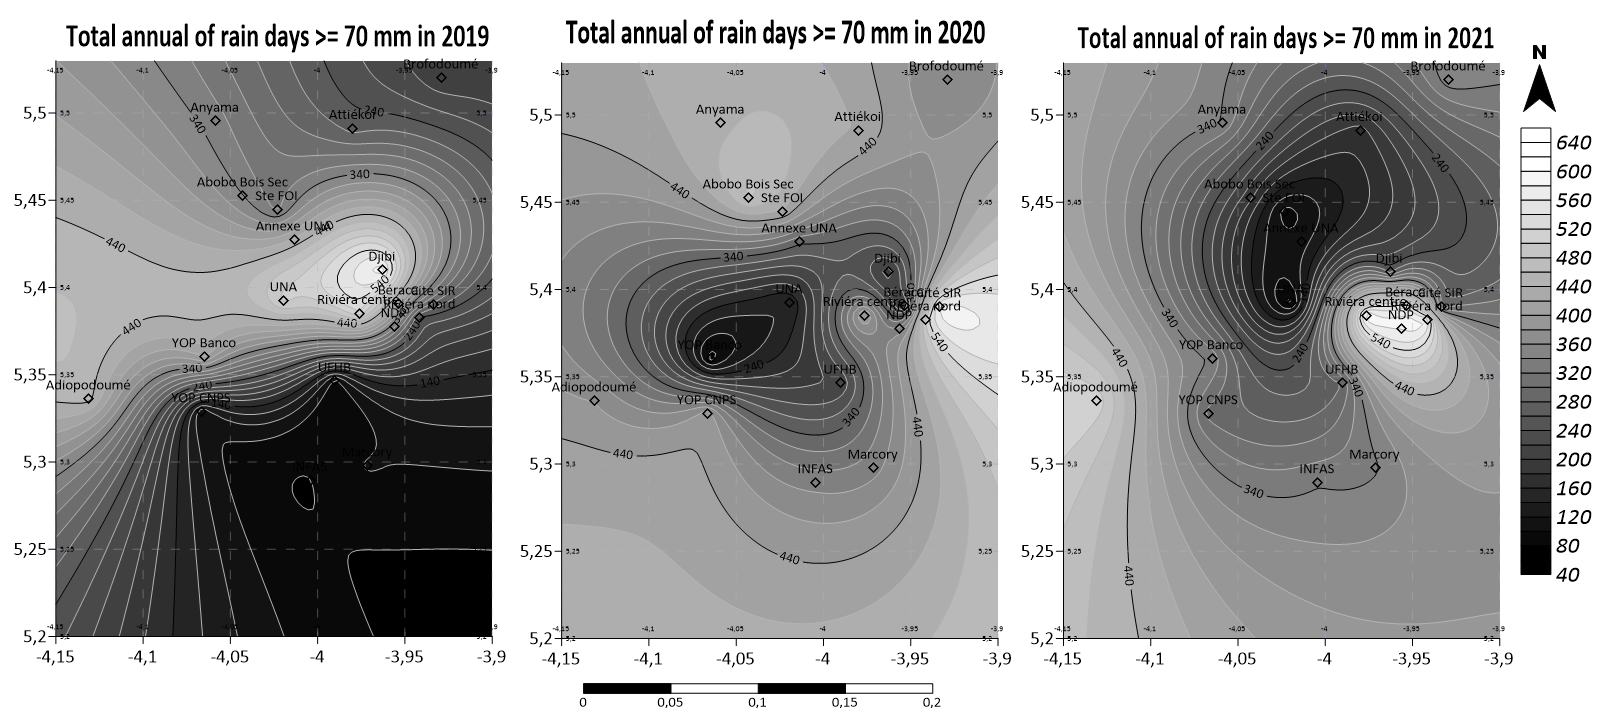
Figure 8Spatial distribution of annual cumulative of daily rainfall greater than or equal to 70 mm over the Abidjan district.
3.5 Spatial variability
3.5.1 Variographic analysis of heavy rainfall
Figure 7a and b show the variograms of rainfall greater than 47 mm at least one network station during the HCRPs 2019–2021 of the LRS and SRS.
Both variograms show low nugget effects with 0.1 for the LRS variogram and 0.125 for the SRS variogram. This reflects a weak discontinuity in the small-scale data. There is no spatial dependence beyond 22.5 km during the LRS and 15 km during the SRS. The asymptotic sill reached beyond 36 km (equivalent to the extent of the network) during the LRS shows less spatial variability of rainfall than during the SRS where the sill is reached at about 17 km. These results show that rainfall is more widespread during the LRS than the SRS over the Abidjan district.
3.5.2 Spatial analysis of rainfall totals
The annual rainfall over the academic network in 2019, 2020 and 2021 does not show a directional gradient over the district (result not shown). The same is true for the cumulative extreme rainfall (above 70 mm) per year (see Fig. 8).
The results show great differences between the HCRPs, which are the real rainy heart of the rainy seasons, and this has consequences for the risk of flooding. Soils are wetter and more prone to runoff during the HCRP of the LRS than during the HCRP of the SRS. The risk of flooding is also more limited in time during the LRS than during the SRS.
Another factor aggravating the risk of flooding lies in the distribution of daily rainfall. Rainfall is heavier during the HCRP of the LRS, especially the extremes. The tendency of the LRS HCRP to cause flooding is confirmed by the register of accidents and disasters kept by the military fire brigade group of Côte d'Ivoire. Over the period 2014 to 2021, 100 % of the floods recorded occur during the main rainy season between 28 April and 12 July – the bounds of the 50 % occurrence interval of the LRS's HCRP.
The variograms of heavy rainfall over the last 3 years of network operation indicate a greater spatial extent of rainfall events during the HCRPs of the LRS. Flooding can occur in a larger number of catchments at the same time, making Civil Protection responses more challenging.
The increase in urban flooding observed in Abidjan over the long term (since 1961) is not attributable to climate change through an intensification of rainfall but rather to urbanisation and the organisation of drainage networks.
The strong differences observed between the HCRPs of the LRS and the SRS are certainly to be found in the origin of the two rainy seasons. According to Bichet and Diedhiou (2018), the two rainy seasons clearly visible in Abidjan correspond to two different phases of the West African Monsoon. The first phase from April to June is oceanic (linked to the surface temperature of the ocean in the Gulf of Guinea) and the second phase which is continental appears from July to November.
This study has shown the key role of the long rainy season and in particular the highest cumulative rainfall periods over 60 d in the risk of flooding. It is also shown that extreme rainfall is less severe during the short rainy season. The ETCCDI parameters calculated on the HCRPs show that the increase in flooding in Abidjan District is not due to an intensification of daily rainfall. Soil sealing linked to urbanisation and the weaknesses of drainage infrastructures certainly contribute to increase flooding, but other rainfall factors should be explored, such as the number of rainy periods (for n consecutive days) in the HCRPs, and above all, the analysis of rainfall intensities within the events should be carried out, provided that a historical chronicle with high temporal resolution is available.
The next step will be to determine the characteristics of rainfall events at the sub-daily scale in order to update the intensity-duration-frequency curves and the design storm, which is a prerequisite for a better estimation of floods.
Daily data from the rain gauge network are freely available at https://doi.org/10.23708/AN9SKZ (Zahiri et al., 2021). The historical data of the airport station was provided by the national meteorological agency SODEXAM.
LS, MK and EPZ defined the frame of the paper. CY carried out the study. Rainfall from the raingauge academic network were collected and criticized by ESK, AD, CD, MG, JLP and LS. CY prepared the manuscript with contributions from all co-authors.
The contact author has declared that none of the authors has any competing interests.
Publisher’s note: Copernicus Publications remains neutral with regard to jurisdictional claims in published maps and institutional affiliations.
This article is part of the special issue “IAHS2022 – Hydrological sciences in the Anthropocene: Variability and change across space, time, extremes, and interfaces”. It is a result of the XIth Scientific Assembly of the International Association of Hydrological Sciences (IAHS 2022), Montpellier, France, 29 May–3 June 2022.
We acknowledge EVIdENCE Project and SODEXAM for providing dataset used in the framework of this research. Christian Yao benefits from an IRD doctoral grant.
This research has been supported by the “Partenariat rénové pour la Recherche au Service du Développement de la Côte d'Ivoire” (grant no. D18.64/JMH/kf; 6 mars 2018, project EVIdENCE).
This paper was edited by Christophe Cudennec and reviewed by two anonymous referees.
Alfieri, L., Bisselink, B., Dottori, F., Naumann, G., de Roo, A., Salamon, P., Wyser, K., and Feyen, L.: Global projections of river flood risk in a warmer world: RIVER FLOOD RISK IN A WARMER WORLD, Earth's Future, 5, 171–182, https://doi.org/10.1002/2016EF000485, 2017.
Amoako, C. and Inkoom, D. K. B.: The production of flood vulnerability in Accra, Ghana: Re-thinking flooding and informal urbanisation, Urban Stud., 55, 2903–2922, https://doi.org/10.1177/0042098016686526, 2018.
Bichet, A. and Diedhiou, A.: Less frequent and more intense rainfall along the coast of the Gulf of Guinea in West and Central Africa (1981–2014), Clim. Res., 76, 191–201, https://doi.org/10.3354/cr01537, 2018.
Didi, S. R. M., Ly, M. , Kouadio, K., Bichet, A., Diedhiou, A., Coulibaly, H. S. J., Kouadio, K. C. A., Coulibaly, T. J. H., Obahoundje, S., and Savané, I.: Using the CHIRPS Dataset to Investigate Historical Changes in Precipitation Extremes in West Africa, Climate, 8, 84, https://doi.org/10.3390/cli8070084, 2020.
Duan, W., He, B., Nover, D., Fan, J., Yang, G., Chen, W., Meng, H., and Liu, C.: Floods and associated socioeconomic damages in China over the last century, Nat. Hazards, 82, 401–413, https://doi.org/10.1007/s11069-016-2207-2, 2016.
Goula, B. T. A., Soro, E. G., Kouassi, W., and Srohourou, B.: Trends and breaks in extreme daily rainfall in Côte d'Ivoire (West Africa), Hydrolog. Sci. J., 57, 1067–1080, https://doi.org/10.1080/02626667.2012.692880, 2012.
Nkrumah, F., Vischel, T., Panthou, G., Klutse, N. A. B., Adukpo, D. C., and Diedhiou, A.: Recent Trends in the Daily Rainfall Regime in Southern West Africa, Atmosphere, 10, 741, https://doi.org/10.3390/atmos10120741, 2019.
OCHA: Côte d'Ivoire: Flood and cholera risk zones, http://www.unocha.org/cotedivoire (last access: 18 April 2022), 2013.
Panthou, G., Lebel, T., Vischel, T., Quantin, G., Sane, Y., Ba, A., Ndiaye, O., Diongue-Niang, A., and Diopkane, M.: Rainfall intensification in tropical semi-arid regions: the Sahelian case, Environ. Res. Lett. 13, 064013, https://doi.org/10.1088/1748-9326/aac334, 2018.
Zahiri, É., Séguis, L., Kacou, M., Kamagaté, B., Dao, A., Perrin, J.-L., Koffi, S. E., and Guilliod, M.: Daily rainfall in Abidjan district (Côte d’Ivoire) (2015–), IRD/DataSuds [data set], V7, https://doi.org/10.23708/AN9SKZ, 2021.
Zhang, X., Alexander, L., Hegerl, G. C., Jones, P., Tank, A. K., Peterson, T. C., Trewin, B., and Zwiers, F. W.: Indices for monitoring changes in extremes based on daily temperature and precipitation data, WIREs Clim. Change, 2, 851–870, https://doi.org/10.1002/wcc.147, 2011.