the Creative Commons Attribution 4.0 License.
the Creative Commons Attribution 4.0 License.
 | 18 Apr 2024
Assessment of Hydrological Changes in Godavari River Basin Under the Impacts of El-Niño
Kasiapillai Sudalaimuthu Kasiviswanathan
Claudia Teutschbein
Bankaru-Swamy Soundharajan
M M Diwan Mohaideen
Venkatesh Budamala
El Niño–Southern Oscillation (ENSO) is the most prominent driver of the inter-annual variability of Indian summer monsoon rainfall (ISMR). This study focuses on understanding the hydrological variations in Godavari River Basin (GRB) due to the weakening of ISMR during El Niño years (1980–2008), using the variable infiltration capacity (VIC) model. The entire basin was discretized into 1325 uniform grids of resolution 0.15°×0.15° (about 16.65 km), and hydrological parameters of the basin were analysed at each grid level for various El Niño events. Based on the Oceanic Niño Index (ONI), obtained from National Oceanic and Atmospheric Administration (NOAA), El Niño events occurred in the past were subclassified into weak (2004 and 2006), moderate (1986, 1994 and 2002), strong (1987 and 1991) and very strong (1982, 1987) events. For this study, VIC model was run for the period 1980–2008 and a composite of El Niño and normal years (1981, 1985, 1989, 1990, 1992, 1993, 1996, 2001 and 2003) was prepared to assess the impacts of El Niño events on the hydrology of GRB. Our results showed a negative correlation of precipitation, abstractions and soil moisture with the increasing magnitude of El Niño events. The quantum of precipitation was reduced during El Niño years compared to normal years, which showed the basin's exposure to more frequent droughts during El Niño events.
- Article
(2589 KB) - Full-text XML
- BibTeX
- EndNote


El Niño impacts (SDG 13.1); ISMR variability; hydrological changes (UPH 01); VIC
Indian summer monsoon rainfall (ISMR), also known as Southwest monsoon falls between the months of June and September and accounts for 70 %–90 % of the annual rainfall in India (Varikoden and Preethi, 2013). The inter-annual variability of ISMR has a profound impact on Indian agriculture and economy, being the principal source of rainfall for the Indian subcontinent. El Niño–Southern Oscillation (ENSO), a recurring inter-annual phenomenon caused by sea surface temperature (SST) anomalies over the equatorial Pacific Ocean, is identified as the most prominent climate driver of ISMR (Ihara et al., 2007; Rajeevan and Pai, 2007; Varikoden and Preethi, 2013; Schulte et al., 2020; Lenka et al., 2022). Scientific progress and ongoing research on ISMR have revealed the manifestation of droughts across India due to the occurrence of El Niño events (Varikoden et al., 2015; Duhan et al., 2018; Singh and Shukla, 2020; Dixit and Jayakumar, 2021; Rajbanshi and Das, 2021). Kumar et al. (2006) analysed a 132-year historical rainfall record and observed that El Niño events accompanied the majority of the meteorological droughts over India. In addition, numerous researchers reported a reduction in rainfall during El Niño years resulting in the weakening of ISMR with few exceptions (Geethalakshmi et al., 2009; Varikoden et al., 2015). The most recent El-Niño event during 2015–2016 ranked among the strongest three events in the past 65 years. With an ONI of 2.6, it was categorized as “very strong” and had enormous effects on rainfall and water resources in South Asia. During the 2015 monsoon season, negative rainfall anomalies were responsible for deficits of monsoon rainfall over the southeast Indian ocean (Kakatkar et al., 2018). In addition, the observed deficit in ISMR was 16 % in 2015, and the year turned out to be a drought year with adverse effects on water resources and agricultural productivity (Kulkarni et al., 2016). Hence, it is essential to investigate rainfall reductions to understand potential changes to the hydrological system during El-Niño events. We believe that such an investigation is crucial for a sustainable development of South Asian regions given the importance of reservoirs and dams for a continuous year-round water supply, irrigation and hydropower generation.
Specifically, for a country like India with rapid economic development, a crucial assessment of El Niño on hydrological processes can assist in monitoring water resources for long-term sustainability. Therefore, the present study considered the Godavari River basin (GRB), India's second-largest river basin and significant breadbaskets. In support of this study, Dixit et al. (2021) performed a frequency analysis of drought events in GRB for future scenarios and demonstrated the basin's exposure to more frequent droughts in the future (2053–2099). This calls for an urgent need to understand the impacts of El Niño events on the GRB hydrological phenomena. The inferences of the present investigation can be utilized to foster new policies in GRB to cope with future El Niño events in balancing the competing demands of the water and food sectors. In this study, the VIC model was employed to assess the catchment response of El Niño events. The modelling framework was tested using the data collected from the Godavari River Basin (GRB), located in the southern part of India.
2.1 Description of the study area
The GRB lies between the longitudes 73°21′–83°09′ E and latitudes 16°07′–22°50′ N, as shown in Fig. 1. GRB is the largest peninsular river, and the catchment accounts for 9.5 % of India's geographical area (i.e., 312 812 km2). The catchment area extends over the states of Maharashtra, Madhya Pradesh, Andhra Pradesh, Chhattisgarh, Orrisa, and Karnataka. The basin receives 80 % of its annual rainfall from ISMR, with an average annual rainfall of about 1097 mm (1971–2005). However, GRB has a tropical climate with temperatures varying between 26 and 44 °C (1969–2004) (Mishra et al., 2020). Also, GRB has more than 15 major water infrastructures built across the river with a combined storage capacity of more than 21 BCM to serve irrigation, water supply, and hydropower production. Moreover, the installed hydropower generation capacity is more than 2.7 GW, and the total irrigated area is around 6000 km2. Similar to many large river basins which experience the impacts of extreme climate events, GRB is also vulnerable to extreme calamities. For instance, the downstream regions of GRB has been experiencing the floods while severe droughts were reported in the significant portion of the upstream of the basin.
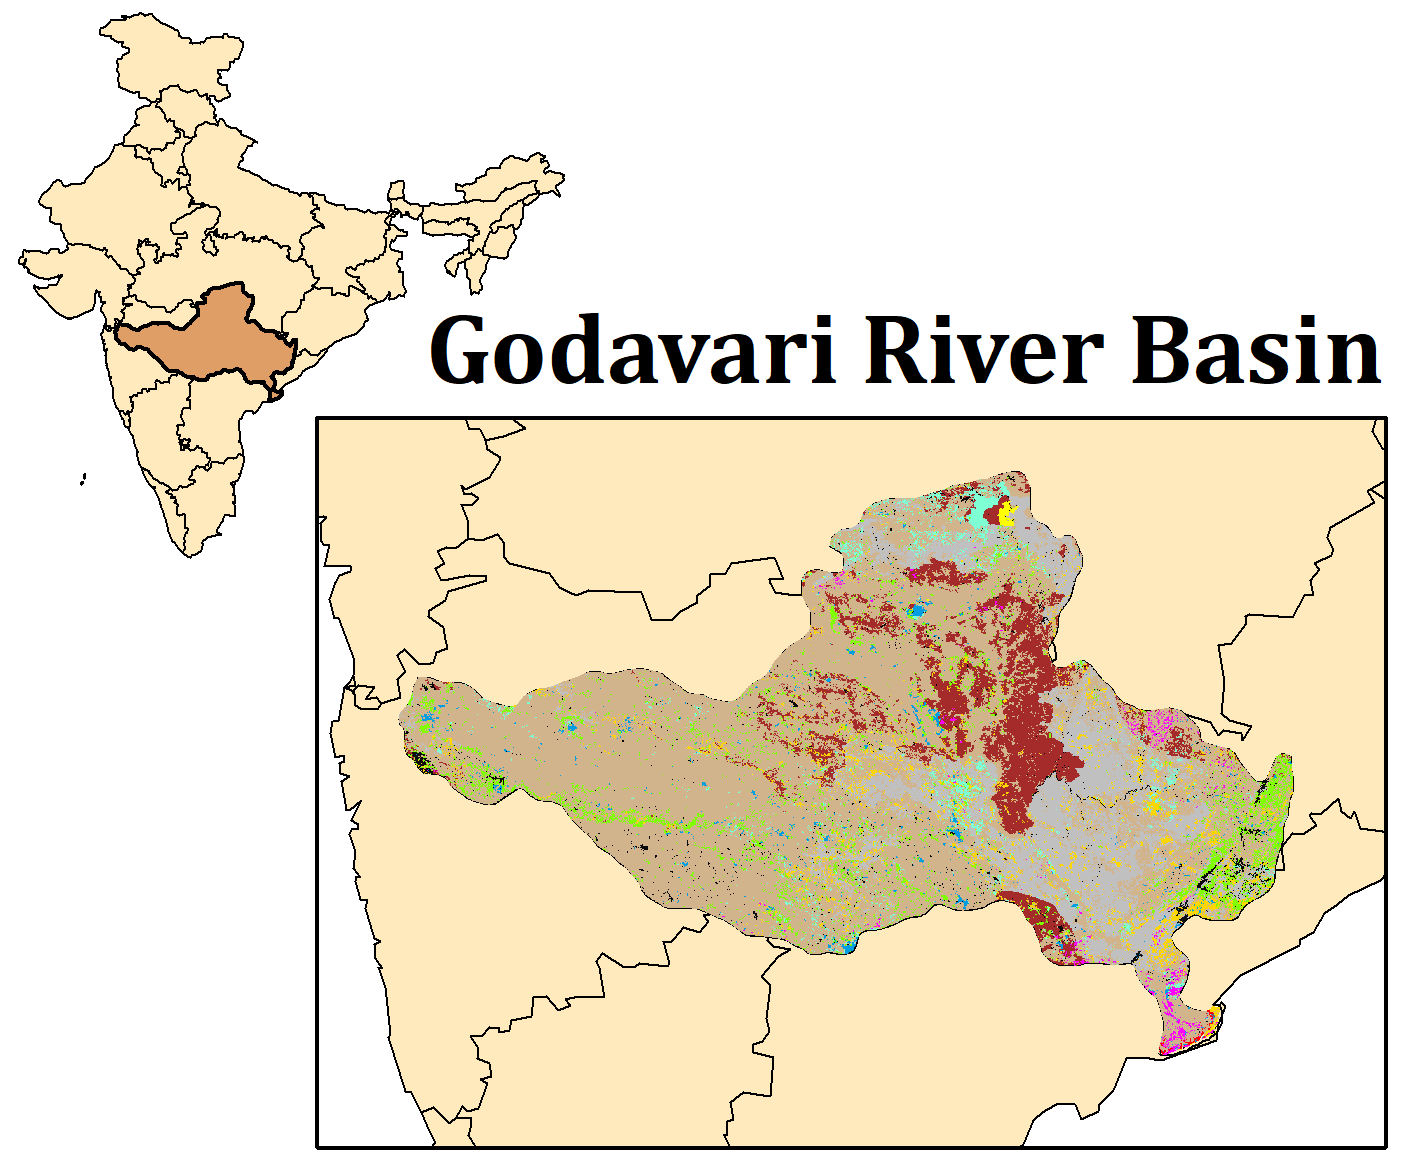
Figure 1Map showing location of GRB in India.
2.2 Datasets
A wide range of inputs, such as meteorological forcing and physiographic features (i.e., elevation, soil, land cover and vegetation information), are necessary to setup and run the VIC model. Meteorological forcing variables such as rainfall, minimum temperature (Tmin), and maximum temperature (Tmax) were obtained from India Meteorological Department (IMD). The gridded rainfall datasets with a spatial resolution of 0.25°×0.25° (Pai et al., 2014), daily minimum and maximum air temperature datasets of 1°×1° resolution (Srivastava et al., 2009) were used as the observed forcing to simulate VIC model.
Digital Elevation Model (DEM) of 30 m spatial resolution developed by Shuttle Radar Topographic Mission (SRTM) was used to delineate and extract terrain-related information of GRB. The Decadal Land Use Land Cover (LULC) map of 100 m spatial resolution for 2005 was obtained from NASA's ORNL DAAC portal. The soil information was extracted from a 30 arcsec Harmonized World Soil Database (HWSD), obtained from the Food and Agriculture Organization (FAO). HWSD raster comprising of soil attributes up to a depth of one meter, bifurcating the soil layer into topsoil (0–30 cm) and subsoil (30–100 cm) was used. The observed daily streamflow data for GRB was obtained from 1980 to 2008 from the Central Water Commission (CWC), Government of India, to validate the VIC model simulations. ENSO conditions were defined based on the mean monthly ONI values from National Oceanic and Atmospheric Administration (NOAA) (https://origin.cpc.ncep.noaa.gov/products/analysis_monitoring/ensostuff/ONI_v5.php, last access: 15 April 2022).
2.3 Variable Infiltration Capacity Model (VIC)
VIC model is a macroscale and physically-based semi-distributed model which simulates water and energy fluxes independently at each grid cell (Liang et al., 1994). Prominent features of the model include (a) simulation of each grid cell independently, (b) explicit representation of sub-grid vegetation and elevation heterogeneity, and (c) consideration of non-linear baseflow. The water balance at each time step in the VIC model is based on the continuity equation (Liang et al., 1994) as described below:
where is the change in water storage, P is precipitation, E is evapotranspiration and R is runoff. The units of all the above-mentioned variables are mm within chosen timestep (daily scale was adopted in this paper).
VIC curve accounts for the spatial heterogeneity of runoff generation in the model, whereas baseflow generation is based on the Arno Model conceptualization (Franchini and Pacciani, 1991). The Penman-Monteith equation estimates the evapotranspiration (ET) for each vegetation type defined in the model. The simulated runoff and baseflow fluxes from each grid cell are utilized by a separate routing model based on the linearized Saint–Venant equation to get the total discharge at the selected gauge stations (Lohmann et al., 1996, 1998).
2.4 Modelling framework
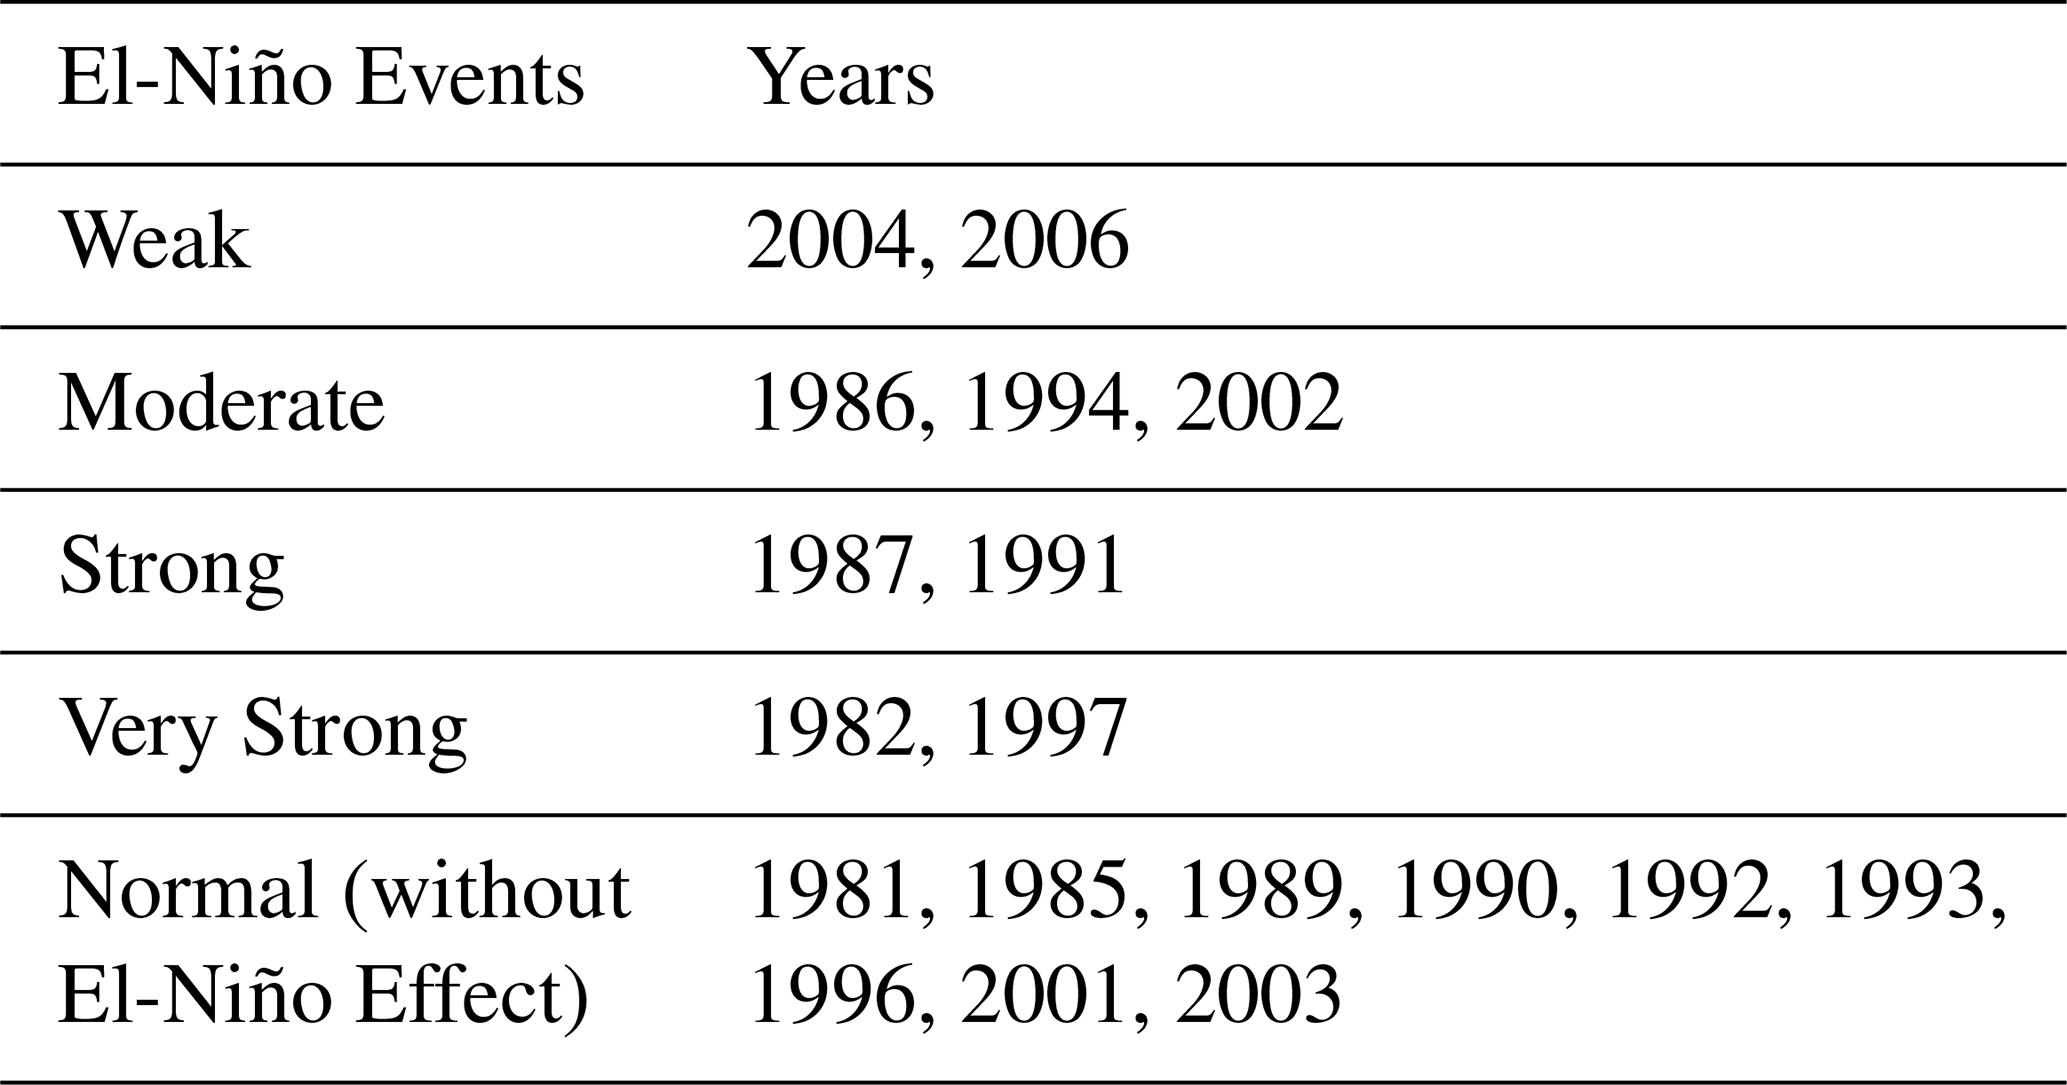
The flowchart (Fig. 2) represents the methodology adopted in this study. The VIC model was employed in the study for hydrological modelling of GRB. The total area of the basin is 312 812 km2 and discretized into uniform grids of resolution 0.15°×0.15° (about 277.22 km2, a total of 1325 grids) and all input parameters were established at each grid level. Genetic algorithm (GA) optimization was employed for finding the optimal parameter set of VIC model (Whitley, 1994). Parameterization at each grid level was derived from thematic layers such as LULC map, FAO-HWSD global soil map, and DEM to obtain model parameters in the prescribed format (ASCII file format). Grid-wise flux outputs computed from VIC-3L were fed to a standalone routing model to simulate daily streamflow at the outlet (Polavaram). Different performance metrics like the coefficient of determination (R2) and Nash–Sutcliffe Efficiency (NSE), with a threshold limit of above 0.75, were adopted to analyse the model behaviour for calibration and validation. After calibration of the VIC model, grid-wise flux outputs, namely surface runoff, baseflow, soil moisture, and evapotranspiration, were analysed for various El Niño episodes. The present study applied the ONI, which represents the running 3-month mean of sea surface temperature (SST) anomalies for the Niño 3.4 region to identify El Niño years. El Niño events were defined as five consecutive overlapping 3-month periods at or above the +0.5 anomaly, and the events were further subclassified into weak (with a 0.5 to 0.9 SST anomaly), moderate (1.0 to 1.4), strong (1.5 to 1.9) and very strong (≥2.0) events (Table 1). Finally, the percentage change in water balance components of GRB, namely precipitation, soil moisture and abstractions, were compared with normal years for various classes of El Niño events.
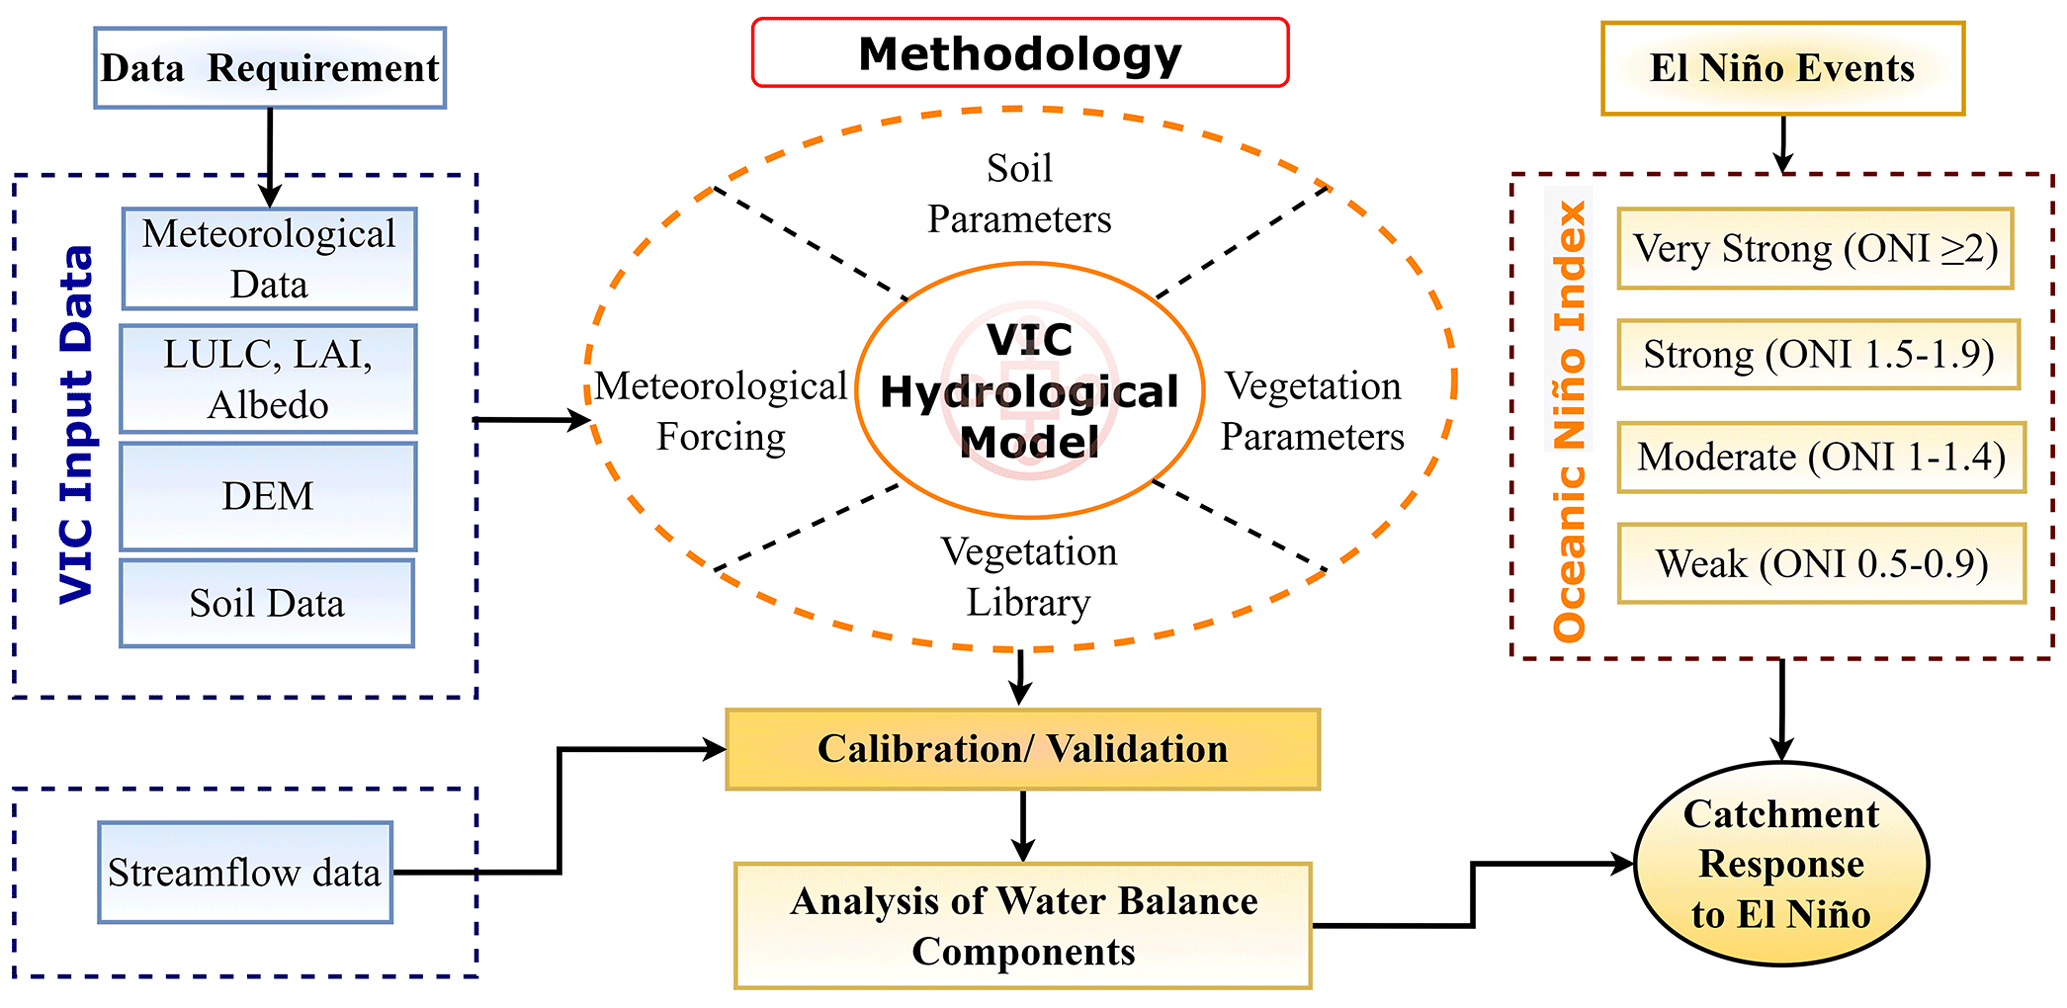
Table 1El-Niño classification based on ONI and corresponding years (1980–2008).
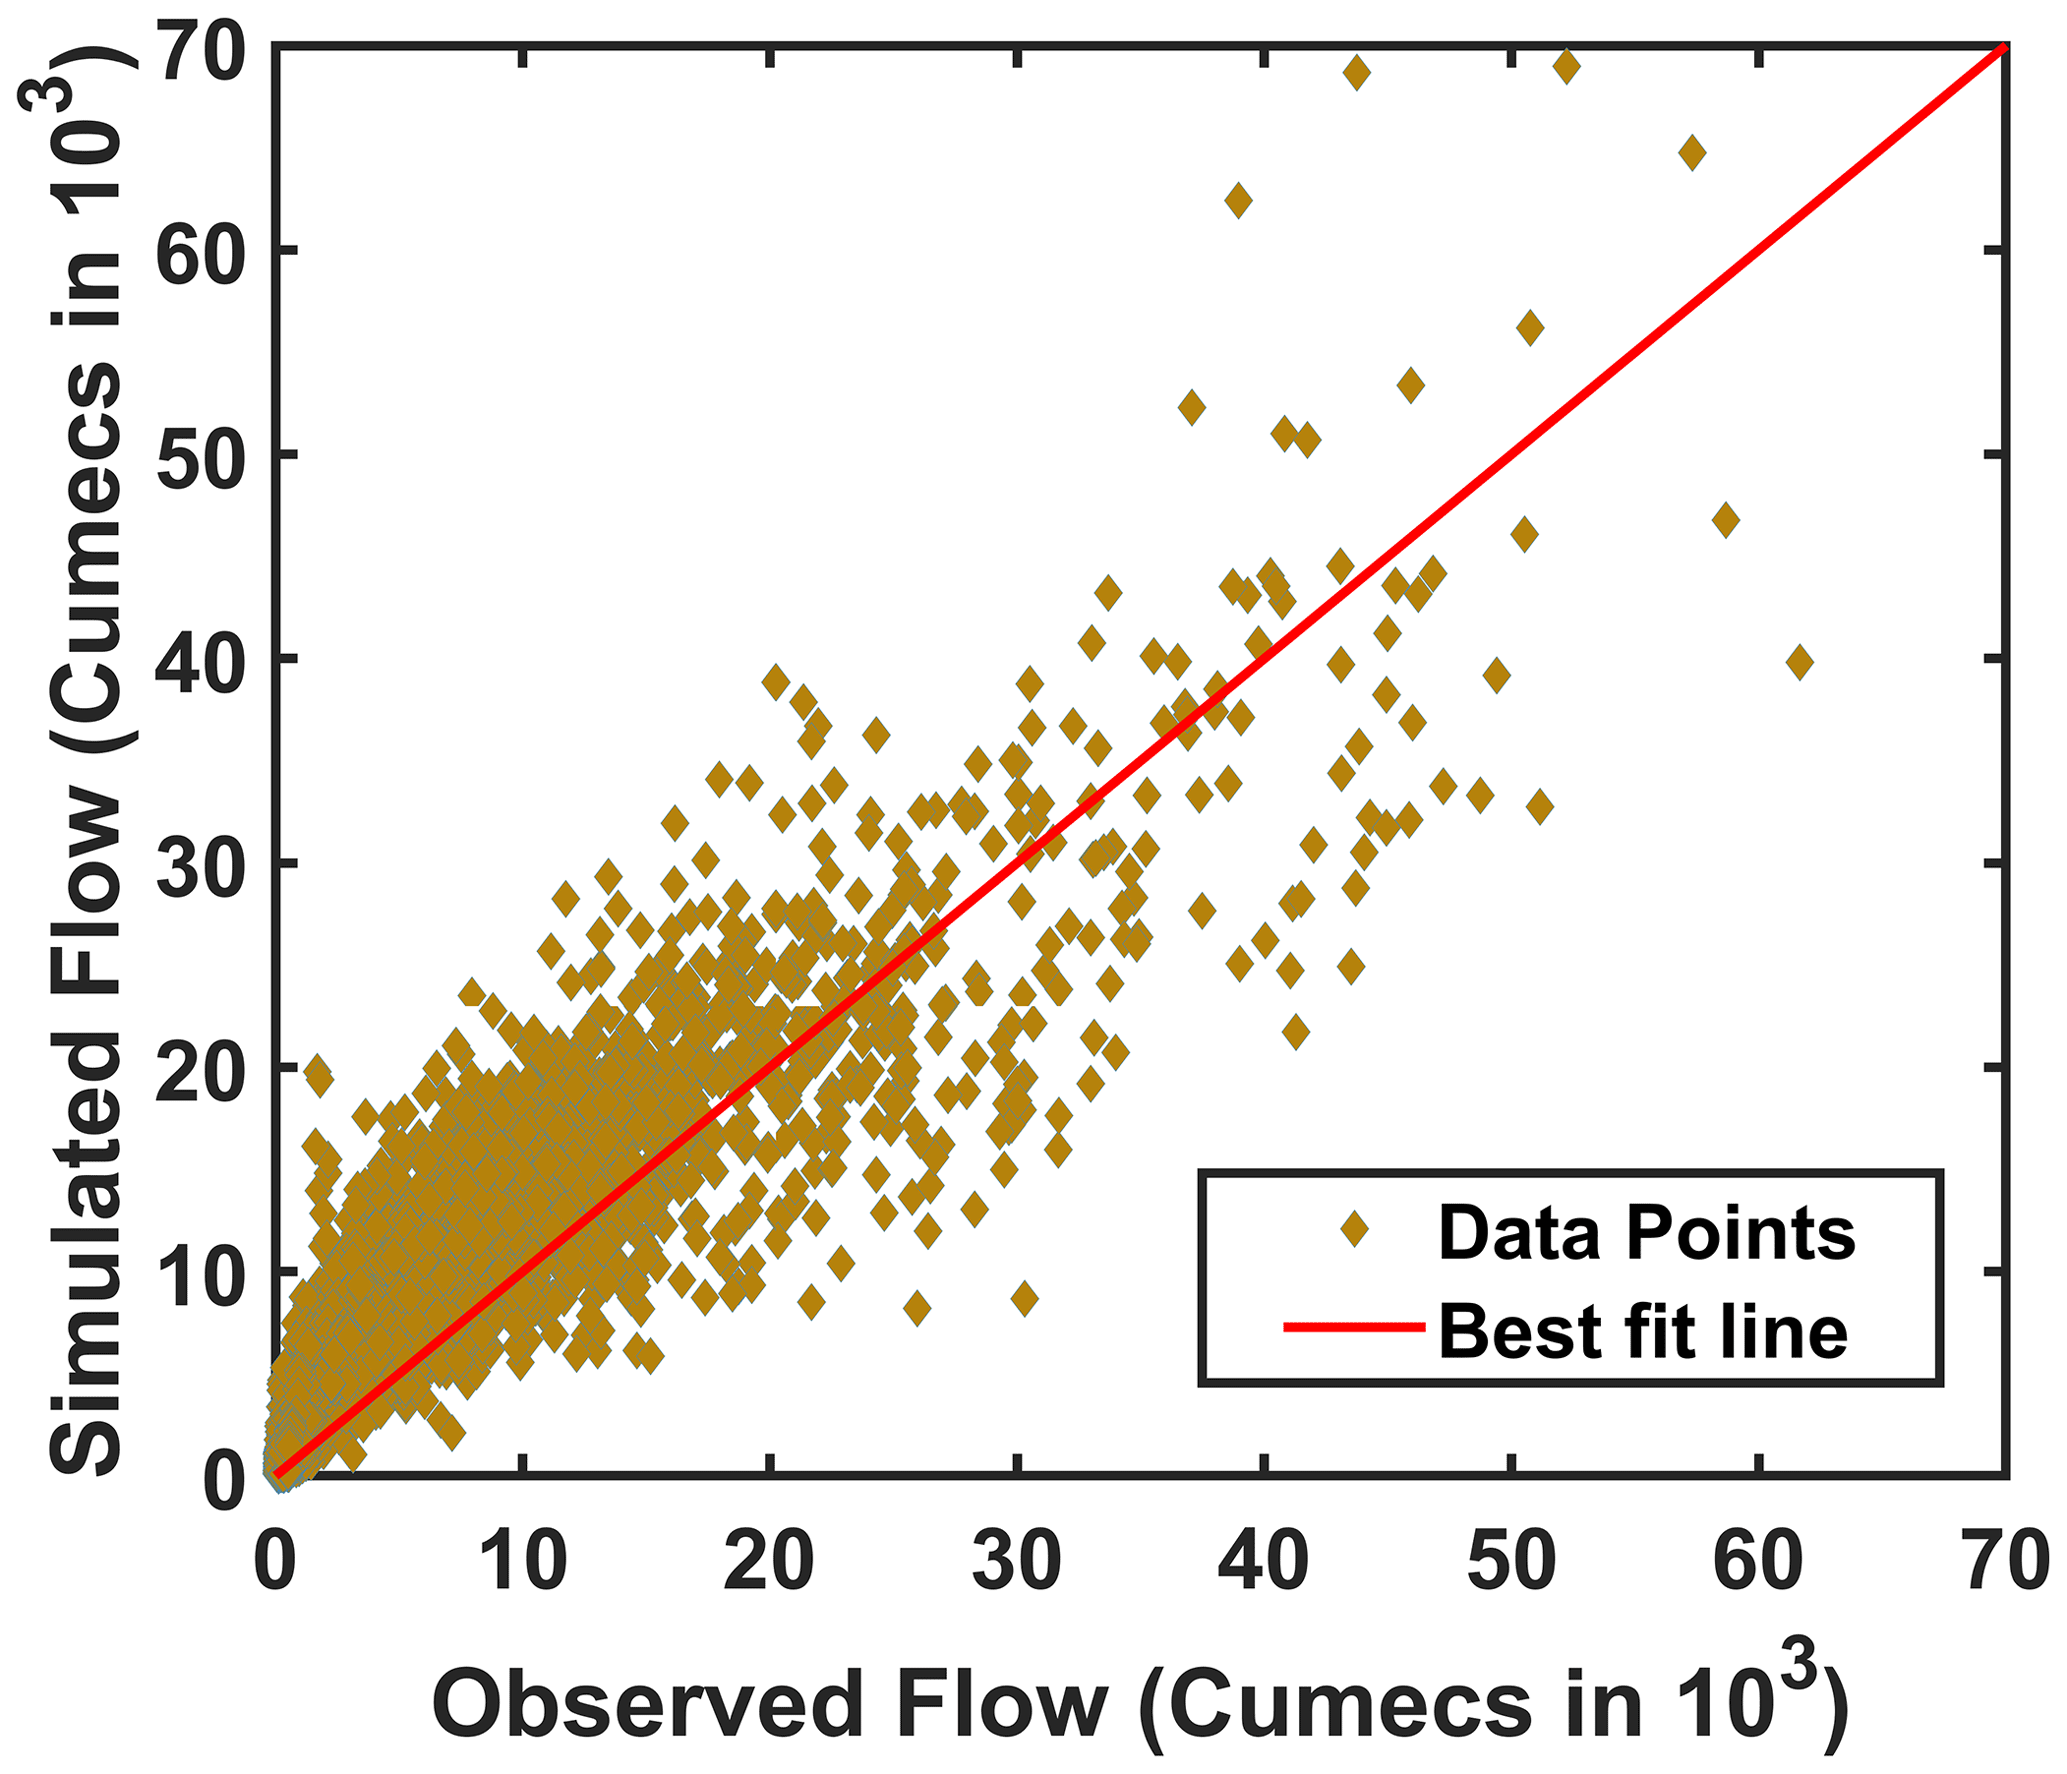
The model parameters were calibrated using GA and the results are not presented here for brevity. After that, simulations were performed and compared with observed streamflow. The observed daily streamflow data collected for the period 1980–2008 was used to develop the model. The first 21 years of data were used for the calibration (1980–2000) and the remaining 8 years (2001–2008) of data were used for validation of the model. The R2 and NSE for model calibration resulted 0.85 and 0.78 respectively. In the model validation, the values were 0.83 and 0.76 respectively. By looking at the similar values of NSE and R2, it is clear that the overall model generalization is very good, which is also clear from the scatter plot (Fig. 3). A composite of weak, moderate, strong, and very strong El-Niño and normal years was prepared from calibrated VIC model simulations for various hydrological components at each grid level. Percentage of change (POC) in precipitation, abstractions and soil moisture for El Niño years was computed and compared to normal years which is explained in subsequent sections.
3.1 Precipitation: El-Niño years vs. Normal years
An inverse relationship between the average precipitation and El Niño intensity from moderate to very strong was noticed for GRB during 1980–2008 (Fig. 4). The positive correlation in average precipitation for weak El-Niño years could be due to spatial variations in impacts of the events in different basin regions, resulting in an overall increase of precipitation in the basin. POC in precipitation was observed with the index of −0.74 for weak El-Niño years, and a significant increase in POC was noticed with increasing ONI. This implies that the amount of precipitation received during El Niño years was lower than normal years, and the total precipitation would have been even less with the increasing magnitude of El Niño events. These findings very well match with previous studies (Ihara et al., 2007; Rajeevan and Pai, 2007).

Figure 4Percentage change of precipitation for various El Niño events comparing with normal years.
Spatial variation of precipitation over the basin revealed that the upstream region of GRB was less influenced during weak El Niño episodes than the middle and downstream regions. In contrast, the POC in precipitation was noticeably higher for upstream and middle Godavari regions for moderate El Niño episodes. Furthermore, the impact of El Niño events was becoming more prominent when there was an increasing magnitude of the event. However, POC was observed lower for strong El Niño than the very strong El Niño episodes. It may be noted that the study did not quantify the relative impacts of tropical climate patterns such as the Indian Ocean Dipole (IOD), and the tropical Atlantic variability (ATL) on the ISMR. Therefore, a possible reason for lower POC in the case of a strong ENSO than the very strong ENSO for precipitation may be due to the co-occurrence of the El Niño and IOD events in the Indo-Pacific Ocean sector or over India. Ashok et al. (2004) showed that IOD significantly reduces the impact of ENSO on the ISMR whenever IOD and ENSO events co-occur. Cherchi and Navarra (2013) also showed large anomalies in the characteristics of ISMR due to the occurrence of ENSO and IOD events.
3.2 Abstractions: El-Niño years vs. Normal years
An apparent increase in POC for abstractions was observed with the increasing intensity of El Niño from moderate to very strong (Fig. 5). In contrast, POC in abstractions was observed to be −6.10 for weak El-Niño years due to increased precipitation indicating more water available for losses. A significant increase in POC for abstractions was noticed with increasing ONI from moderate to very strong El Niño. This can be attributed to the fact that there was less soil moisture availability during the El Niño years due to the reduction in precipitation, which resulted in decreased evapotranspiration and other losses.
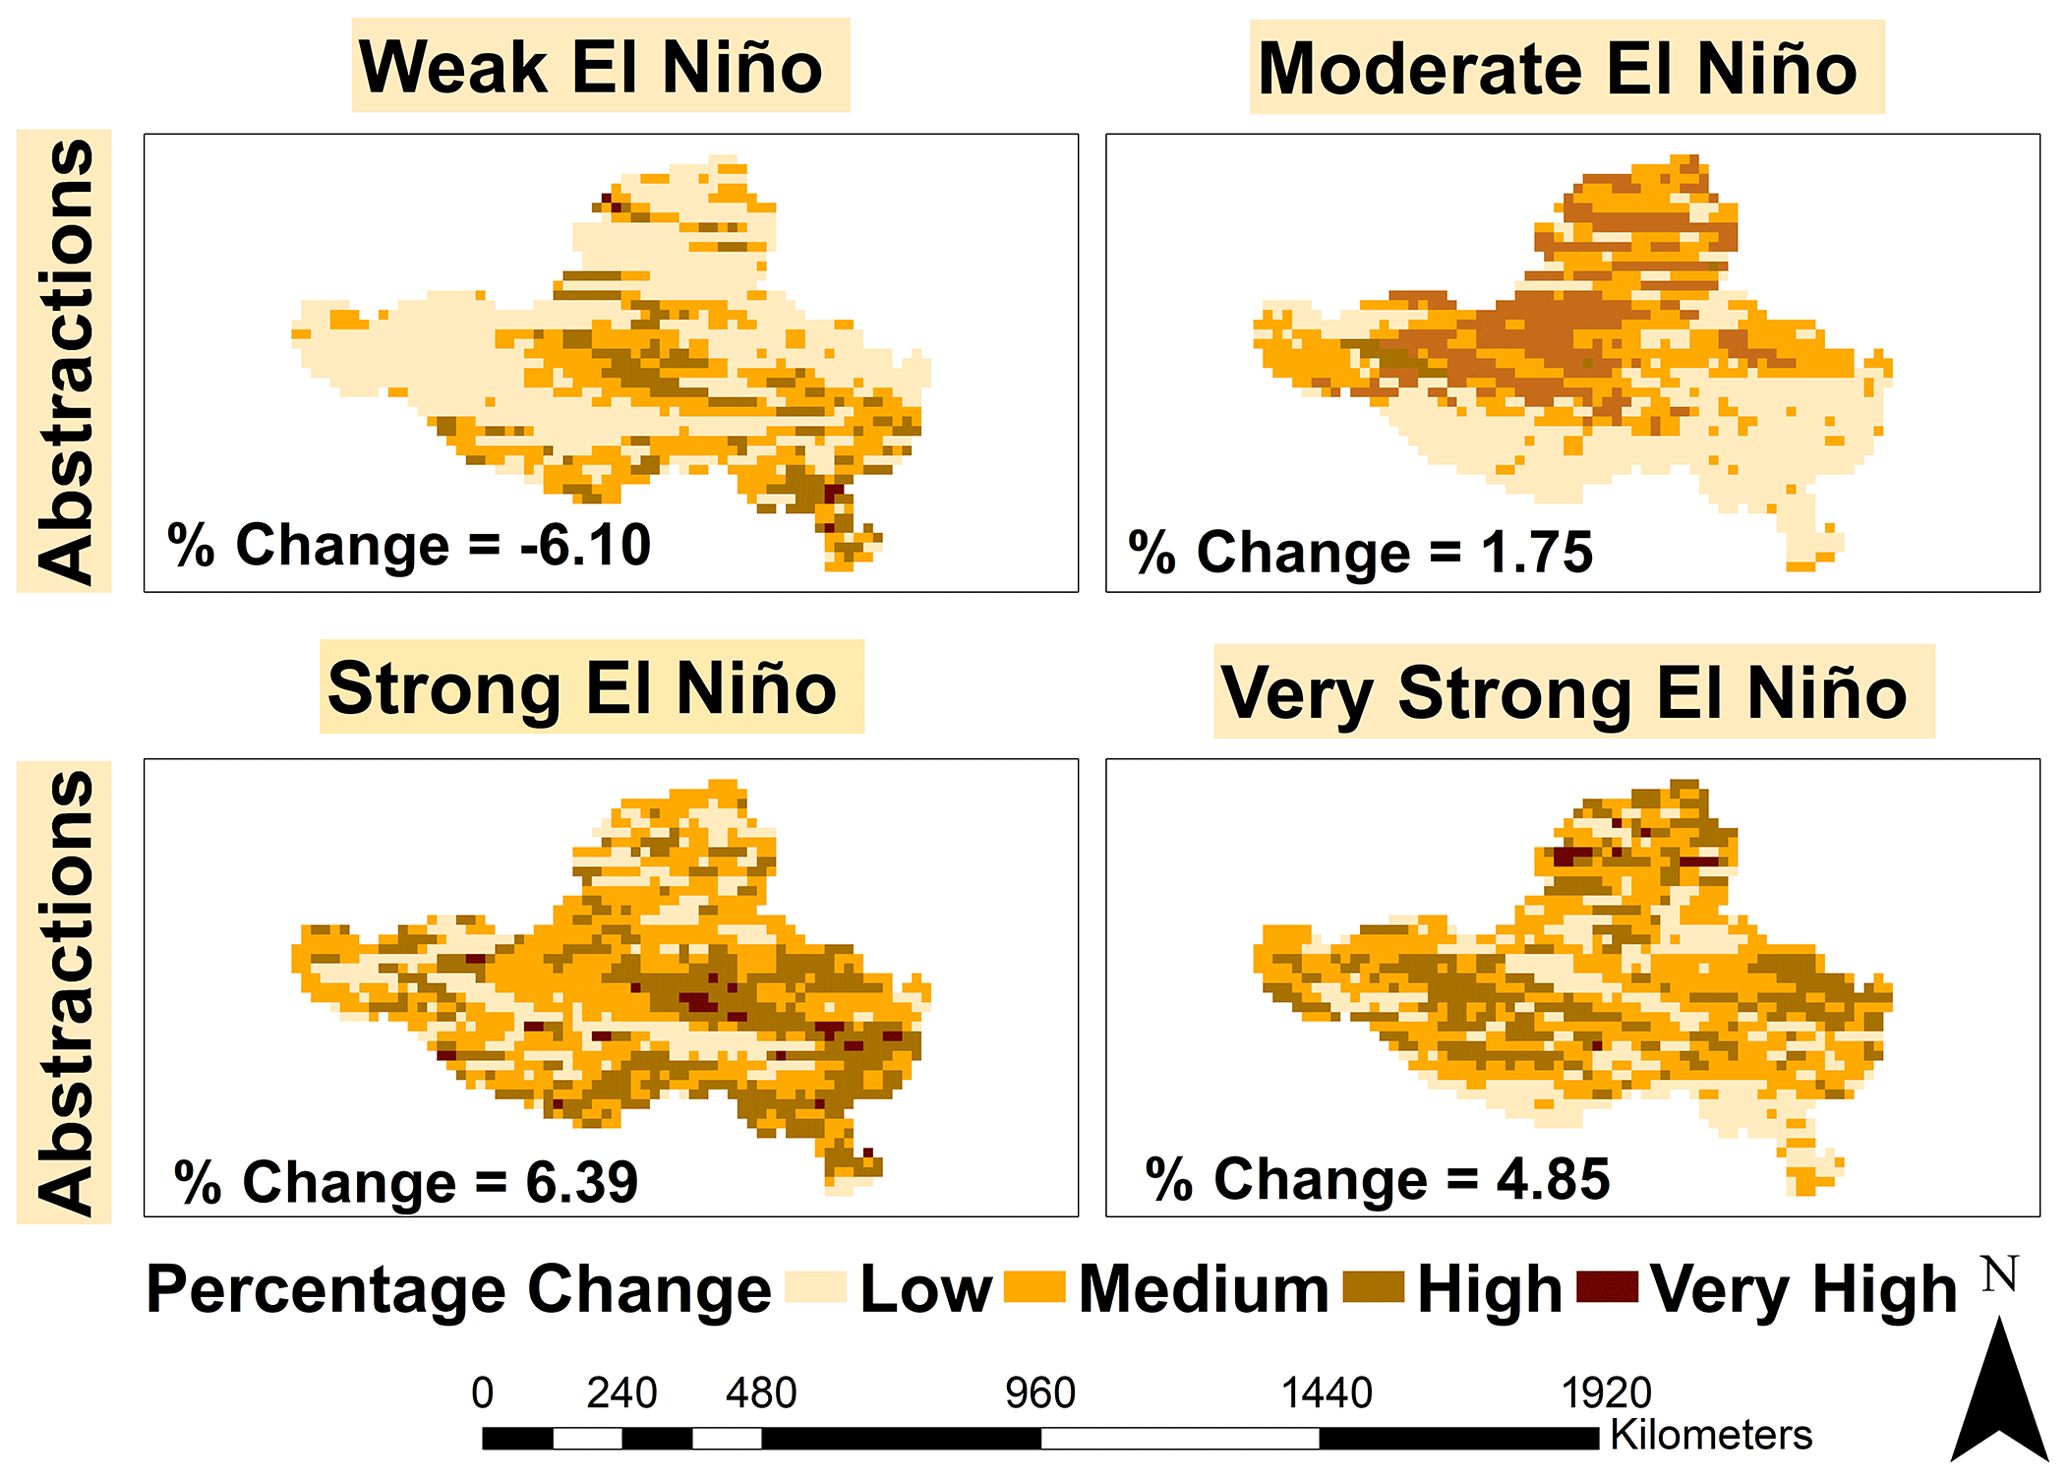
Figure 5Percentage change of abstractions for various El Niño events comparing with normal years.
3.3 Soil Moisture: El-Niño years vs. Normal years
POC in soil moisture was highest for very strong El Niño, which means soil moisture availability is reduced during El Niño years (Fig. 6). This can be explained relating the low quantum of precipitation for the El-Niño years, which resulted in the reduction of soil water recharge, less percolation, and hence less soil moisture availability in soil layers. A similar finding in the spatial variability of soil moisture was observed in various regions of GRB. Overall, it was found that El Niño-induced impacts were high for intense El Niño episodes throughout the basin.
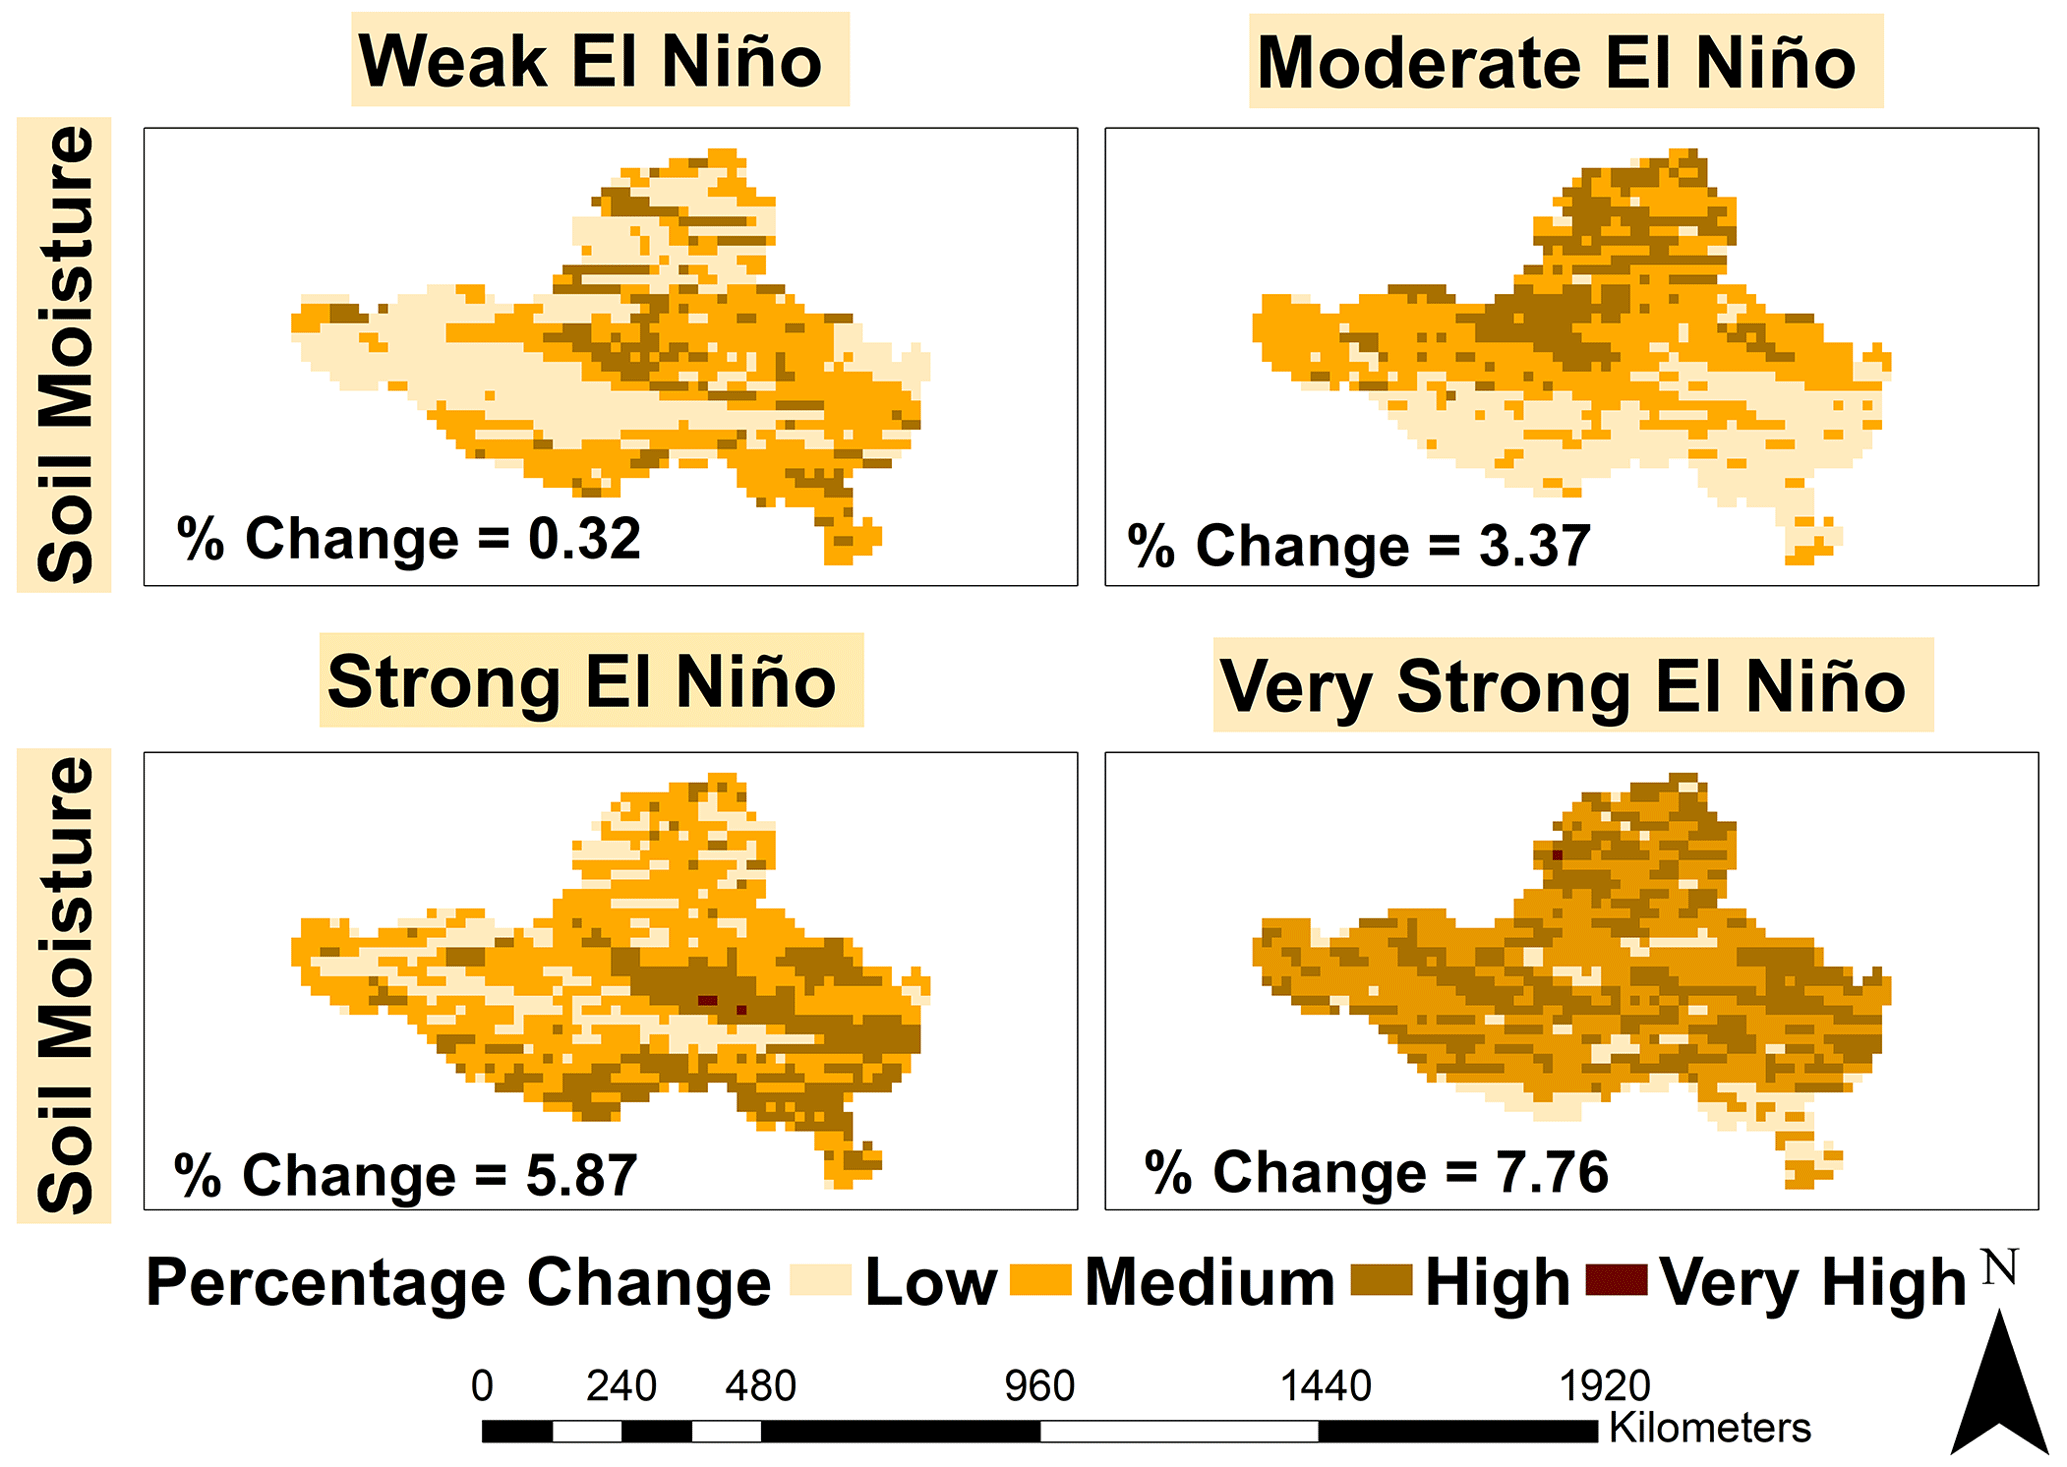
Figure 6Percentage change of soil moisture for various El Niño events comparing with normal years.
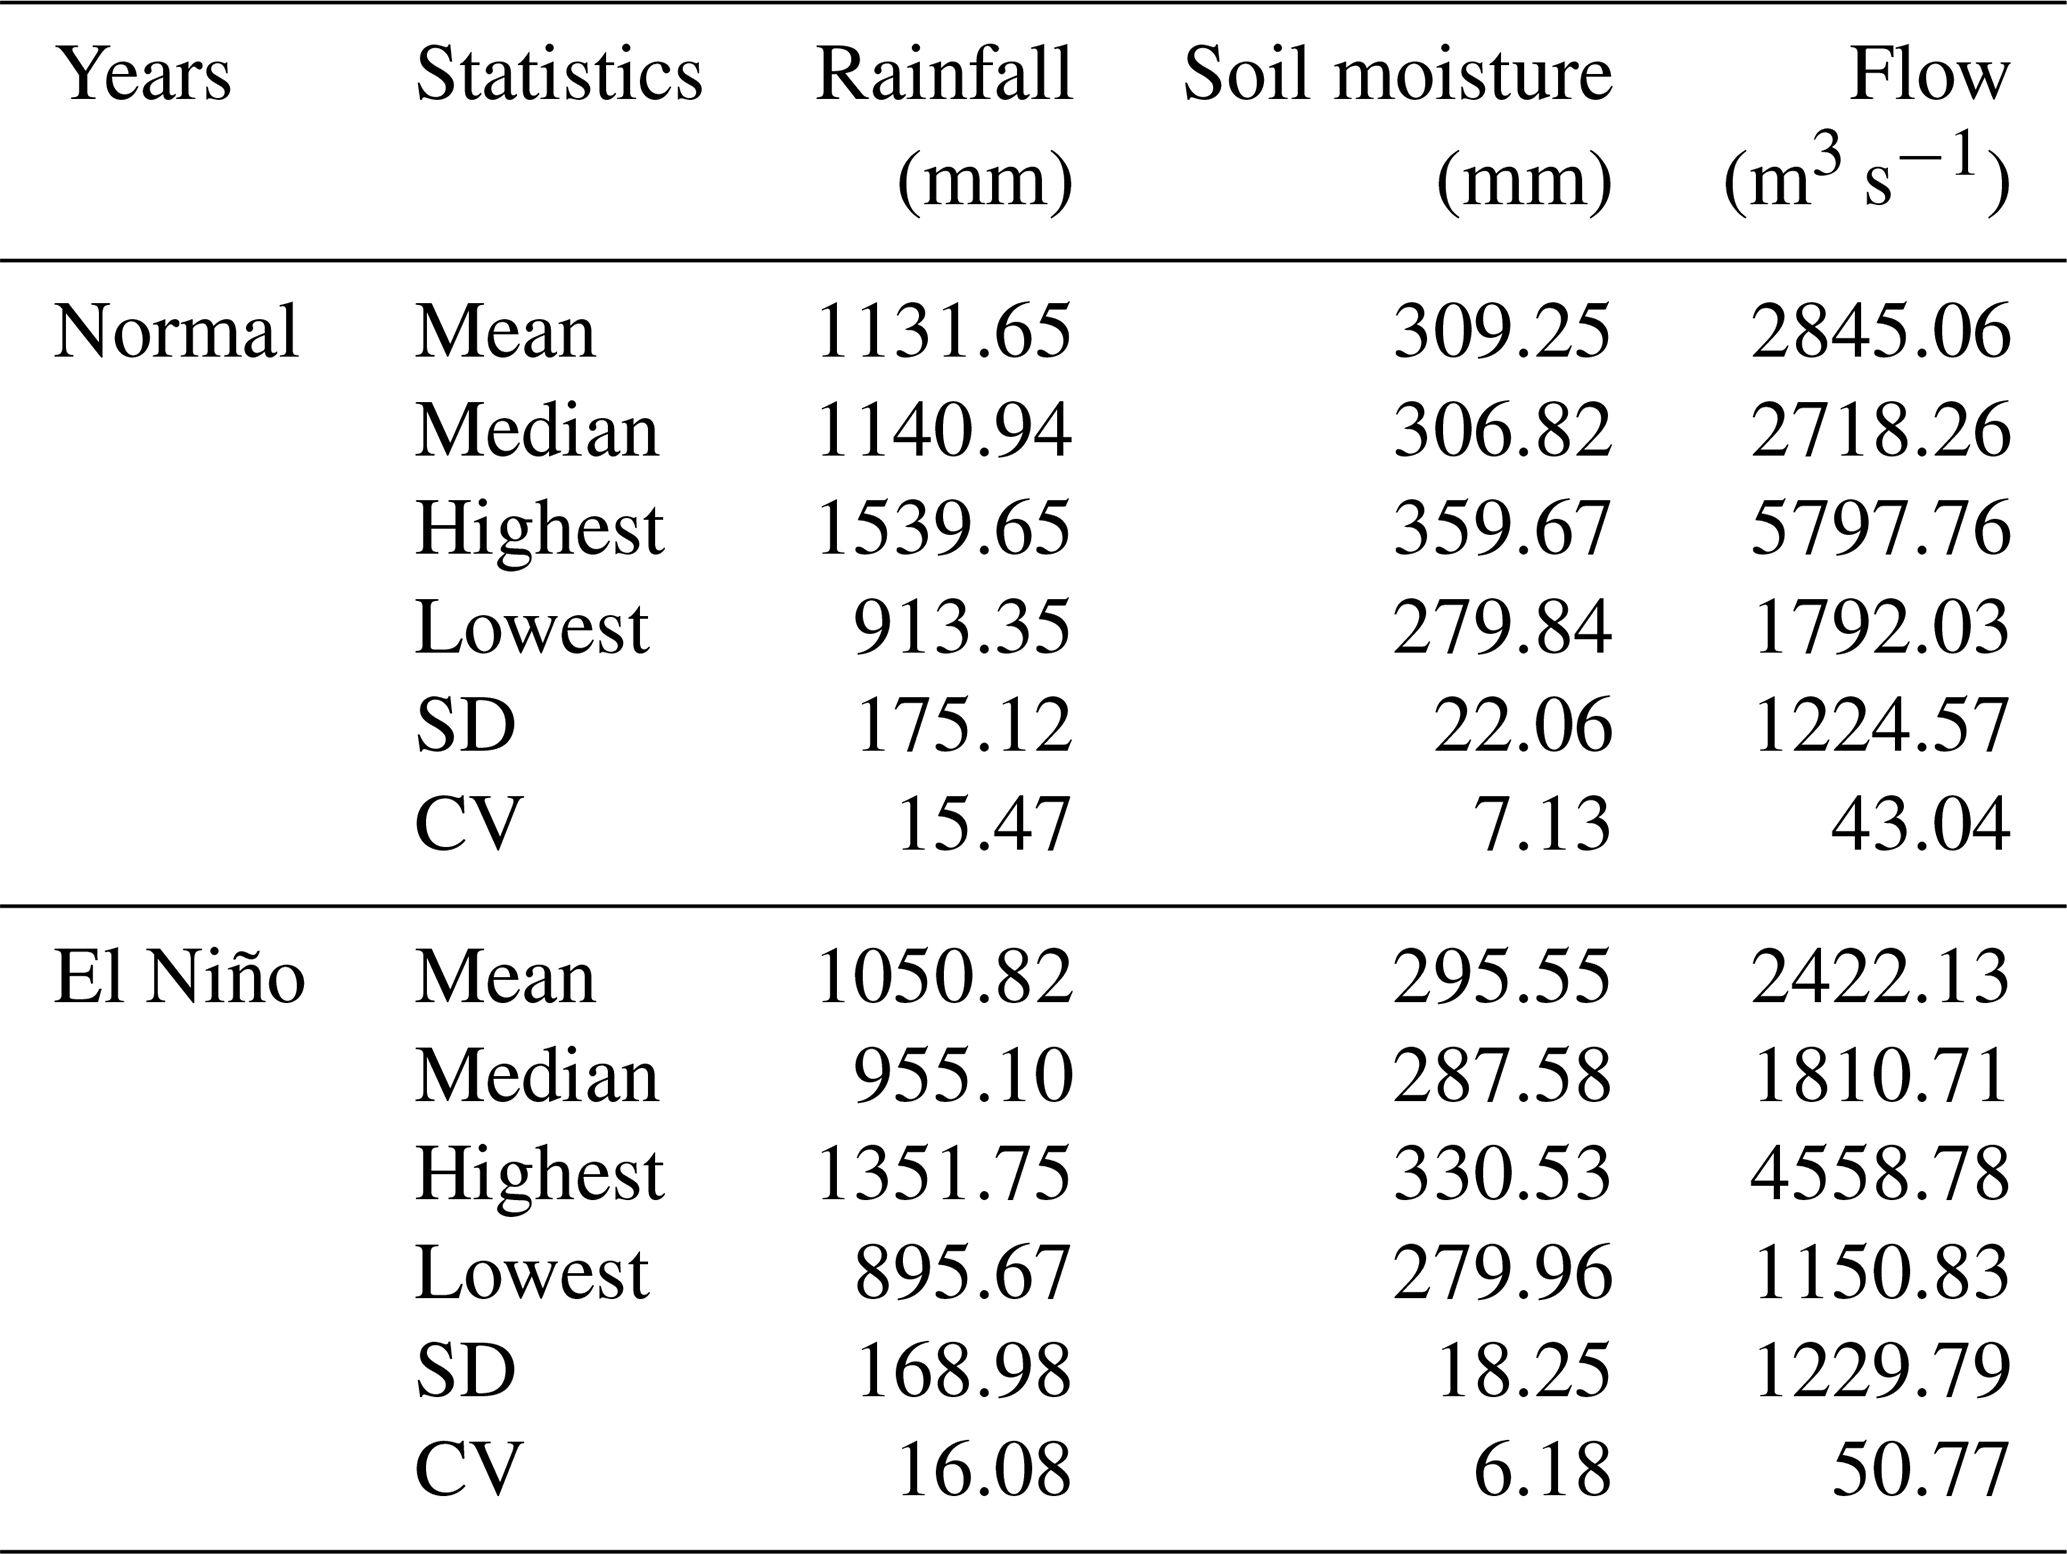
3.4 Summary statistics of hydrological components: El-Niño years vs. Normal years
The analysis of summary statistics computed from the model simulations corresponding to the normal as well as ENSO years (Table 2) revealed that the average annual precipitation for El Niño years (1050.82 mm) is lesser than normal years (1131.65 mm). Similar to our findings, Bothale and Katpatal (2016) showed a precipitation deficit during El Niño years over the Pranhita catchment (a sub-catchment of GRB). Our analysis also highlighted a significant reduction in annual average streamflow from 2845.06 m3 s−1 in normal years to 2422.13 m3 s−1 during El-Niño years (Table 2). Additionally, we compared the rainfall intensity obtained from 1 and 3 d rainfall depths for El Niño and normal years from 1980–2008. For normal years, the mean and standard deviation of maximum daily rainfall intensity was found to be 121.56 and 86.10 mm d−1, respectively, while 87.21 and 26.47 mm d−1 were reported for El-Niño years. Similarly, the mean and standard deviation of maximum 3 d rainfall intensity was found to be 61.87 and 51.72 mm d−1 (normal years), respectively, while 46.59 and 18.82 mm d−1 were reported for El-Niño years. In addition, the number of rainy days were computed for El Niño and normal years from 1980–2008. The mean and standard deviation of rainy days was found to be 81 and 4.83 d for normal years, respectively, while 70 and 13.01 d were observed during El-Niño years. The results showed the reduction in rainfall intensity and the associated number of rainy days for El-Niño years than normal years. Furthermore, the analysis revealed that rainfall deficits during El Niño years could be the major reason for the reduction in soil water recharge, less percolation, and hence less soil moisture availability in soil layers. Consequently, insufficient soil moisture during the crop season has a high risk of leading to agricultural drought and crop failure (Sai et al., 2016). Numerous researchers have shown the occurrence of droughts in GRB due to El Niño events, particularly in the Marathwada region of Maharashtra (Dixit and Jayakumar, 2021; Chavadekar and Kashid, 2021). Additionally, Kulkarni et al. (2016) demonstrated a dramatic 52 % decline in pulse (Tur, Moong and Urad Dal) output in Maharashtra during the drought of 2015 caused by the El-Niño event. Hence, El Niño events have adverse impacts on the water resources and agricultural productivity in GRB.
Table 2Summary statistics of the hydrological components of GRB for El-Niño and Normal years from 1980 to 2008.
This study primarily focuses on advancing the current understanding of the impacts of the El Niño events on GRB. El Niño events significantly impacted the various hydrological components of the basin such as precipitation, abstractions, and soil moisture. Analysis of hydrological components for a composite of weak, moderate, strong, and very strong El-Niño against the normal years showed a negative correlation of average precipitation, abstractions, and soil moisture with increasing magnitude of El Niño events. In particular, El Niño years received less precipitation and the maximum percentage decrease was observed to be 16.18 % for strong El Niño events. The results also revealed a reduction in rainfall intensity (1 and 3 d rainfall intensity) and the associated rainy days, resulting in an annual average precipitation deficit from 1131.65 to 1050.82 mm for the period 1980–2008. The reduced quantum of precipitation and consequently insufficient soil moisture during the El Niño years indicated adverse impacts on the water resources and agricultural productivity of the basin. Hence, it can be concluded that the El-Niño impact assessment is essential when analysing the changes in the hydrological response of the basin. Also, El Niño-induced consequences in hydrological components of GRB can help water resources managers to minimize potential future impacts and facilitate adaptation to future El Niño events.
Most of the datasets in this study are available online. The specific link for ONI values is provided in Sect. 2.2. All datasets including the observed discharge data for Godavari River Basin are available from the corresponding author upon reasonable request.
ChT, KSK, BSS and ClT conceptualized the modeling framework presented in the paper. ChT and KSK wrote the initial draft of the paper and interpreted the findings. While MMDM assisted in setting up the VIC model, VB contributed in preparing the figures and analyzed the validity of results. BSS and ClT provided valuable inputs and critically reviewed the paper.
The contact author has declared that none of the authors has any competing interests.
Publisher's note: Copernicus Publications remains neutral with regard to jurisdictional claims in published maps and institutional affiliations.
This article is part of the special issue “IAHS2022 – Hydrological sciences in the Anthropocene: Variability and change across space, time, extremes, and interfaces”. It is a result of the XIth Scientific Assembly of the International Association of Hydrological Sciences (IAHS 2022), Montpellier, France, 29 May–3 June 2022.
The authors are thankful to Swedish Research Council (SRC) for providing financial support.
This research has been supported by the Swedish Research Council (SRC) during the study period (grant no. 2018-05848).
This paper was edited by Christophe Cudennec and reviewed by Rajendra Prasad and one anonymous referee.
Ashok, K., Guan, Z., Saji, N. H., and Yamagata, T.: Individual and combined influences of ENSO and the Indian Ocean Dipole on the Indian summer monsoon, J. Climate, 17, 3141–3155, https://doi.org/10.1175/15200442(2004)017<3141:IACIOE>2.0.CO;2, 2004.
Bothale, R. V. and Katpatal, Y. B.: Trends and Anomalies in Extreme Climate Indices and Influence of El Niño and La Niña over Pranhita Catchment in Godavari Basin, India, J. Hydrol. Eng., 21, 05015023, https://doi.org/10.1061/(asce)he.1943-5584.0001283, 2016.
Chavadekar, A. U. and Kashid, S. S.: Meteorological drought prediction of marathwada subdivision based on hydro-climatic inputs using genetic programming, ISH Journal of Hydraulic Engineering, 27, 229–241, https://doi.org/10.1080/09715010.2019.1620647, 2021.
Cherchi, A. and Navarra, A.: Influence of ENSO and of the Indian Ocean Dipole on the Indian summer monsoon variability, Clim. Dynam., 41, 81–103, https://doi.org/10.1007/s00382-012-1602-y, 2013.
Dixit, S. and Jayakumar, K. V.: A study on copula – based bivariate and trivariate drought assessment in Godavari River basin and the teleconnection of drought with large – scale climate indices, Theor. Appl. Climatol., 1335–1353, https://doi.org/10.1007/s00704-021-03792-w, 2021.
Dixit, S., Tayyaba, S., and Jayakumar, K. V.: Spatio-temporal variation and future risk assessment of projected drought events in the Godavari River basin using regional climate models, J. Water Clim. Change, 12, 3240–3263, https://doi.org/10.2166/wcc.2021.093, 2021.
Duhan, D., Pandey, A., and Srivastava, P.: Rainfall variability and its association with El Niño Oscillation in Tons River Basin, India, Meteorol. Atmos. Phys., 130, 405–425, https://doi.org/10.1007/s00703-017-0525-x, 2018.
Franchini, M. and Pacciani, M.: Comparative analysis of several conceptual rainfall-runoff models, J. Hydrol., 122, 161–219, https://doi.org/10.1016/0022-1694(91)90178-K, 1991.
Geethalakshmi, V., Yatagai, A., Palanisamy, K., and Umetsu, C.: Impact of ENSO and the Indian Ocean Dipole on the north-east monsoon rainfall of Tamil Nadu State in India, Hydrol. Process., 647, 633–647, https://doi.org/10.1002/hyp.7191, 2009.
Ihara, C., Kushnir, Y., Cane, M. A., and Peña, V. H. D. L.: Indian summer monsoon rainfall and its link with ENSO and Indian Ocean climate indices, Int. J. Climatol., 187, 179–187, https://doi.org/10.1002/joc, 2007.
Kakatkar, R., Gnanaseelan, C., Chowdary, J. S., Parekh, A., and Deepa, J. S.: Indian summer monsoon rainfall variability during 2014 and 2015 and associated Indo-Pacific upper ocean temperature patterns, Theor. Appl. Climatol., 1235–1247, https://doi.org/10.1007/s00704-017-2046-4, 2018.
Kulkarni, A., Gadgil, S., and Patwardhan, S.: Monsoon variability, the 2015 Marathwada drought and rainfed agriculture, Curr. Sci. India, 111, 1182–1193, https://doi.org/10.18520/cs/v111/i7/1182-1193, 2016.
Kumar, K. K., Rajagopalan, B., Hoerling, M., and Cane, M.: Unraveling the Mystery of Indian Monsoon Failure During El Niño, Science, 314, 115–119, https://doi.org/10.1126/science.1131152, 2006.
Lenka, S., Devi, R., Joseph, C. M., and Gouda, K. C.: Effect of large – scale oceanic and atmospheric processes on the Indian summer monsoon, Theor. Appl. Climatol., 1561–1576, https://doi.org/10.1007/s00704-021-03896-3, 2022.
Liang, X., Lettenmaier, D. P., Wood, E. F., and Burges, S. J.: A simple hydrologically based model of land surface water and energy fluxes for general circulation models, J. Geophys. Res., 99, 14415–14428, https://doi.org/10.1029/94jd00483, 1994.
Lohmann, D., Nolte-holube, R., and Raschke, E.: A large-scale horizontal routing model to be coupled to land surf ace parametrization schemes, Tellus A, 48, 708–721, https://doi.org/10.3402/tellusa.v48i5.12200, 1996.
Lohmann, D., Raschke, E., Nijssen, B., and Lettenmaier, D. P.: Regional scale hydrology : I . Formulation of the VIC-2L model coupled to a routing model, Hydrolog. Sci. J., 43, 131–141, https://doi.org/10.1080/02626669809492107, 1998.
Mishra, V., Shah, H., López, M. R. R., Lobanova, A., and Krysanova, V.: Does comprehensive evaluation of hydrological models influence projected changes of mean and high flows in the Godavari River basin?, Climatic Change, 163, 1187–1205, https://doi.org/10.1007/s10584-020-02847-7, 2020.
Pai, D. S., Sridhar, L., Rajeevan, M., Sreejith, O. P., Satbhai, N. S., and Mukhopadhyay, B.: Development of a new high spatial resolution (0.25°×0.25°) long period (1901–2010) daily gridded rainfall data set over India and its comparison with existing data sets over the region, MAUSAM, 65, 1–18, https://doi.org/10.54302/mausam.v65i1.851, 2014.
Rajbanshi, J. and Das, S.: The variability and teleconnections of meteorological drought in the Indian summer monsoon season: Implications for staple crop production, J. Hydrol., 603, 126845, https://doi.org/10.1016/j.jhydrol.2021.126845, 2021.
Rajeevan, M. and Pai, D. S.: On the El Niño-Indian monsoon predictive relationships, Geophys. Res. Lett., 34, 1–4, https://doi.org/10.1029/2006GL028916, 2007.
Sai, M. S., Murthi, C. S., Chandrasekar, K., Jeyaseelan, A. T., Diwakar, P. G., and Dadhwal, V. K.: Agricultural drought: Assessment & monitoring, MAUSAM, 67, 131–142, https://doi.org/10.54302/mausam.v67i1.1155, 2016.
Schulte, J., Policielli, F., and Zaitchik, B.: A skewed perspective of the Indian rainfall–El Niño–Southern Oscillation (ENSO) relationship, Hydrol. Earth Syst. Sci., 24, 5473–5489, https://doi.org/10.5194/hess-24-5473-20200, 2020.
Singh, R. M. and Shukla, P.: Drought Characterization Using Drought Indices and El Niño Effects, Natl. Acad. Sci. Lett., 43, 339–342, https://doi.org/10.1007/s40009-019-00870-6, 2020.
Srivastava, A. K., Rajeevan, M., and Kshirsagar, S. R.: Development of a high resolution daily gridded temperature data set (1969–2005) for the Indian region, Atmos. Sci. Let., 10, 249–254, https://doi.org/10.1002/asl.232, 2009.
Varikoden, H. and Preethi, B.: Wet and dry years of Indian summer monsoon and its relation with Indo-Pacific sea surface temperatures, Int. J. Climatol., 1761–1771, https://doi.org/10.1002/joc.3547, 2013.
Varikoden, H., Revadekar, J. V., Choudhary, Y., and Preethi, B.: Droughts of Indian summer monsoon associated with El Niño and Non-El Niño years, Int. J. Climatol., 1925, 1916–1925, https://doi.org/10.1002/joc.4097, 2015.
Whitley, D.: A genetic algorithm tutorial, Stat. Comput., 4, 65–85, https://doi.org/10.1007/BF00175354, 1994.