the Creative Commons Attribution 4.0 License.
the Creative Commons Attribution 4.0 License.
 | 18 Apr 2024
UPH Problem 20 – reducing uncertainty in model prediction: a model invalidation approach based on a Turing-like test
Trevor Page
Paul Smith
Ann Kretzschmar
Barry Hankin
Nick Chappell
This study proposes using a Turing-like test for model evaluations and invalidations based on evidence of epistemic uncertainties in event runoff coefficients. Applying the consequent “limits of acceptability” results in all the 100 000 model parameter sets being rejected. However, applying the limits, together with an allowance for timing errors, to time steps ranked by discharge, results in an ensemble of 2064 models that can be retained for predicting discharge peaks. These do not include any of the models with the highest (> 0.9) efficiencies. The analysis raises questions about the impact of epistemic errors on model simulations, and the need for both better observed data and better models.
- Article
(1782 KB) - Full-text XML
- BibTeX
- EndNote


UPH20; epistemic uncertainty; model evaluation; limits of acceptability; event runoff coefficients
We would like to use hydrological models that are fit for a particular purpose in making predictions. Traditionally, models have been calibrated against historical observed data and then some sample of those calibrated models used in prediction, with or without some additional uncertainty model. However, there has been little consideration of the aleatory and epistemic uncertainties of the pertinent observed hydrological data and processes and just how that might affect the way we assess “models as hypotheses” about how catchment systems work. Past work has revealed how the epistemic uncertainties associated with even the simplest water balance equation might have an impact on model calibration. In particular some events might introduce disinformation into the calibration process (e.g. Beven et al., 2011; Beven and Smith, 2015; Beven, 2016, 2019). In considering an alternative to this approach to model calibration, Beven and Lane (2019, 2022) have suggested taking a more Popperian approach to testing models as hypotheses in assessing when models should be considered as not fit for purpose. Model invalidation is, after all, a good thing in that it means we need to do better: that some improvements are required, either to the observed data, to the auxiliary relations, or to the model structures being used. The question is what is an appropriate methodology for such hypothesis testing when we know there are epistemic uncertainties associated with the observations? We consider this issue for the case of flood hydrograph simulation using Dynamic Topmodel, making use of a strategy of “limits of acceptability” for model simulations set prior to making model runs.
Fitness-for-purpose is clearly a subjective concept, especially when faced with issues of epistemic uncertainty. Beven and Lane (2022) have suggested 8 principles for thinking about fitness-for-purpose as a qualitative Turing-like test for models as hypotheses about catchment responses as follows:
-
to explore the definition of fitness with relevant stakeholders;
-
to accept that models cannot be expected to perform better than allowed by the observed data used for simulations and evaluations;
-
to ensure that models do not contradict secure evidence about the nature of the catchment response;
-
to ensure that evaluations aim to get the right results for the right reasons;
-
to allow for the possibility that all models might be rejected;
-
to allow that the results of such tests will always be conditional;
-
to allow that the evaluators might themselves need evaluating; and, finally,
-
to ensure that there is a proper audit trail so that assumptions and decisions in evaluation processes can be reviewed and revisited by others.
Of these principles, one of the most interesting is the 2nd, which may be restated as models should not be expected to perform better than the observed data used for driving the simulations and evaluating the results. Beven (2019) suggested a way of using historical data sets in a somewhat different way to normal calibration procedures to produce limits of acceptability for models in a way that allowed for the epistemic uncertainties to be found in the rainfall and discharge observations. That methodology is based on the evaluation of event runoff coefficients, so is only practically applicable to catchments dominated by flashy responses with relatively low baseflow indices so that the total volumes of discharge expected from single events can be estimated using recession curve extrapolation as explained in Beven and Smith (2015) and Beven (2019).
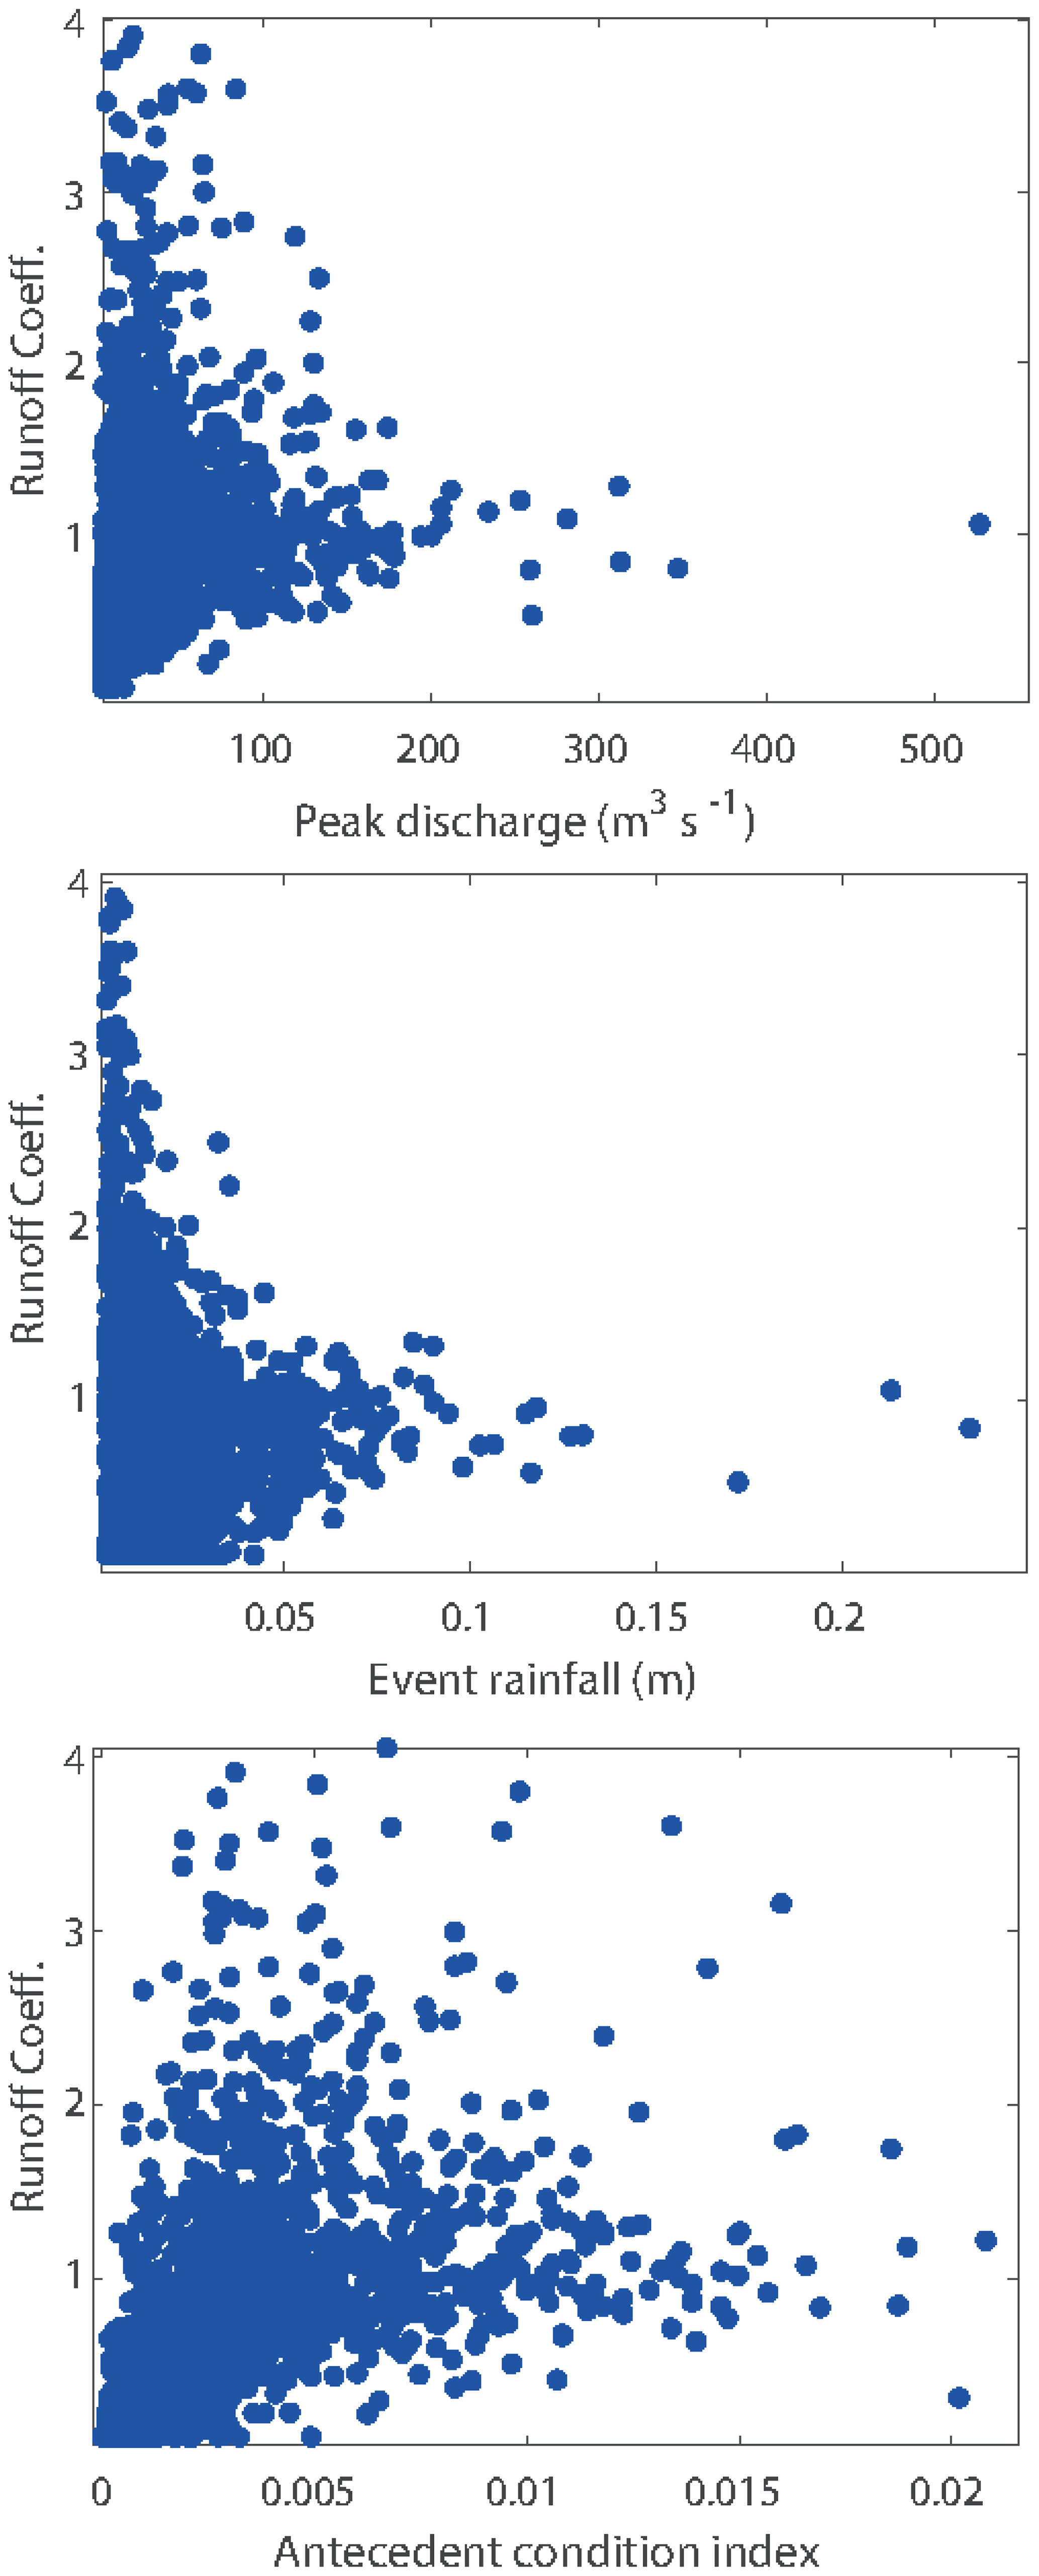
Figure 1Event runoff coefficients for the River Kent at Sedgwick, Cumbria, UK, plotted against peak flow, event rainfall volume and antecedent flow index.
Calculation of the event runoff coefficients over the historical record provides a distribution of estimates that will reflect the errors in the estimation of rainfall inputs to a catchment for different events (which can be large, particularly for convective events or in areas of high relief), and errors in the estimation of discharges for different events (which can be large, especially at low and high flows depending on the definition and stationarity of the rating curve, see e.g. Westerberg et al., 2011; McMillan et al., 2012; Coxon et al., 2015). This is reflected in the range of runoff coefficients that is found in an analysis of this type (Fig. 1; see also Beven, 2019; Beven et al., 2022). Note in particular that there are values greater than 1, sometimes significantly greater than 1, as well as some extremely low values even where the antecedent wetness of the catchment is quite high).
These extreme values reflect the potential for epistemic errors in observing the catchment water balance but will clearly create issues for the calibration of models that are constrained to maintaining a water balance in predicting the discharges. In effect, some events introduce disinformation into the traditional calibration process, which might or might not cancel out over a longer sequence of calibration data (e.g. Beven and Smith, 2015). There will be some element of error in the recession curve extrapolation to separate out the discharge associated with an event, but if care is taken not to separate events that have multiple peaks in quick succession, we would suggest that the extrapolation error will be small relative to the potential for disinformation in the observations.
As shown in Fig. 1, the range of historical event runoff coefficients can be expected to vary with the characteristics of the storm, here shown in terms of antecedent flow as a measure of the wetness of the catchment, the total event rainfall, and the peak discharge. In general, the range is greater for small storms and becomes more constrained for larger storms and peak discharges. Thus, in estimating whether model outputs for a particular event should be considered acceptable in terms of this past observed behaviour it is necessary to define some distribution of potential runoff coefficients given the event characteristics. In Beven (2019) and Beven et al. (2022) this has been done by taking a set of nearest neighbours for an event, weighted by the Mahalanobis distance for the rainfall volume, peak flow and antecedent flow values for the event of interest.
This provides a distribution of potential runoff coefficients for the event of interest, from which limits of acceptability for the model simulations can be defined. In doing so, the actual runoff coefficient for a calibration event can be used to scale the distribution from the nearest neighbour analysis since it is itself necessarily included in the nearest neighbours even if it is an extreme runoff coefficient event. The limits of acceptability can then be defined for that distribution (e.g. by taking the 95 % or 99 % range), treating the runoff coefficients (RCs) as multipliers of the recorded discharges for an evaluation event. This approach allows that models constrained to water balance should not be expected to predict runoff coefficients greater than 1.
Defining the nearest neighbours becomes more problematic however, for larger events where the sample size of similar events is necessarily smaller (Fig. 2). Beven et al. (2022) dealt with this by reducing the number of nearest neighbours considered as storm size increases, which has the effect of excluding some of the neighbours with more extreme RC values associated with smaller storms. This is in keeping with the concept of applying a “hydrologically sensible” Turing-like test in model evaluation.
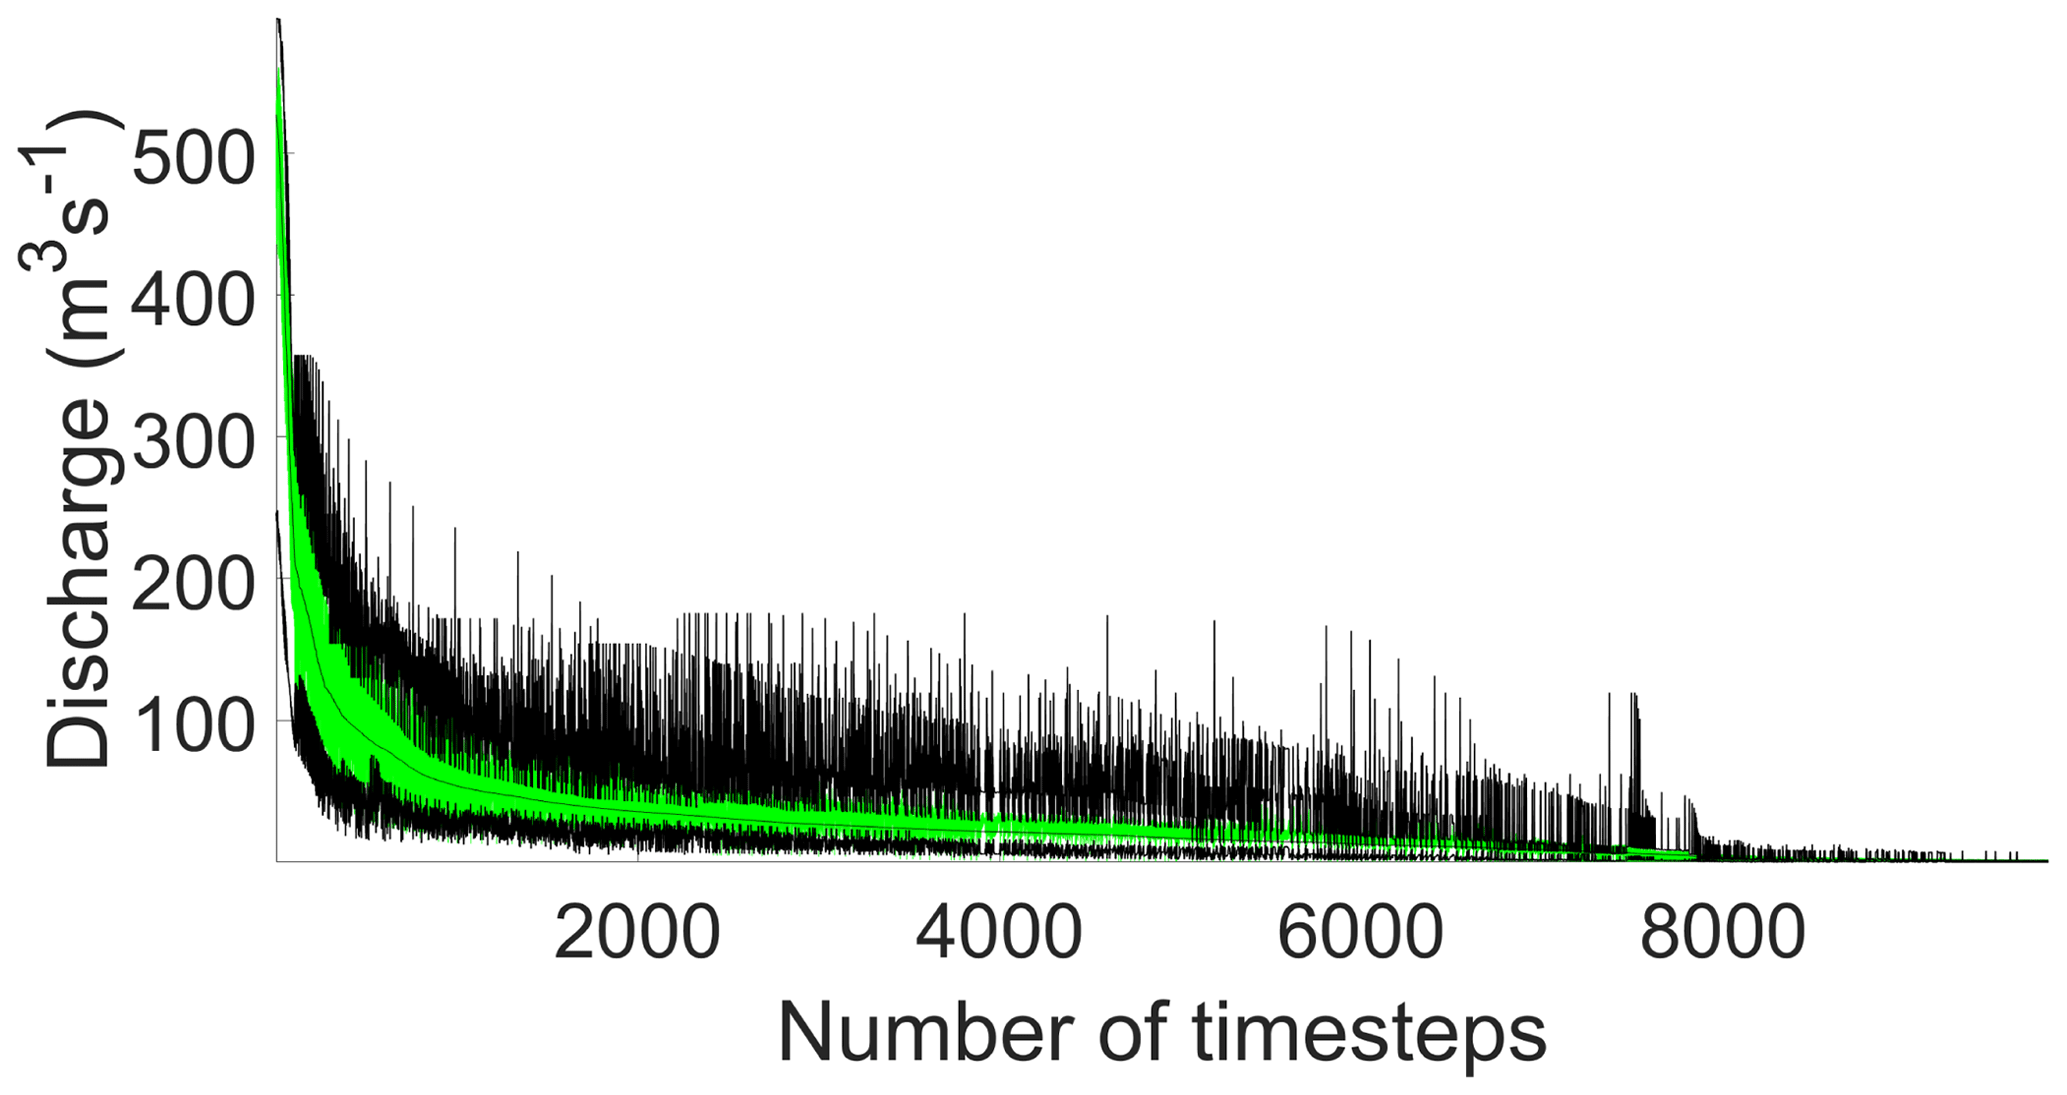
Figure 2Upper and lower 95 % limits of acceptability (black lines) and range of acceptable model predictions (green shading) at time steps ranked by magnitude for the 2015 evaluation period.
Here we consider again the application of the semi-distributed Dynamic Topmodel (Smith and Metcalfe, 2022) to the 210 km2 River Kent catchment in Cumbria, England. This is an upland catchment not underlain by high baseflow primary aquifers, draining part of the English Lake District. It is therefore suitable for the runoff coefficient approach to defining limits of acceptability described above. The aim was to find acceptable parameter sets for Dynamic Topmodel that could later be used to predict the impacts of various Natural Flood Management measures in the catchment.
The application has been described in more detail in Beven et al. (2022) where it was shown that applying the limits of acceptability defined in this way at every time step meant that every one of the 100 000 model runs (with randomly chosen parameter sets) were rejected. The model could therefore be invalidated on this basis. There were parameter sets giving high Nash-Sutcliffe or Kling-Gupta Efficiency value but these did not always give good predictions of the peaks that were of greatest interest in this application. Beven et al. (2022) went on to examine the peak predictions in more detail in ranked order, with the highest peak being Storm Desmond in 2015 that generated the largest peak on record in the catchment, with an estimated return period of 500 years. Desmond has a calculated runoff coefficient > 1.05 so that we should expect any model to underestimate the observed discharges. There were 3349 parameter sets that could be designated as acceptable within the runoff coefficient limits of acceptability for the top 26 peaks of the evaluation period together with an additional constraint of timing of ±2 h (with a model time step of 15 min). This condition was introduced to allow for the fact that the runoff coefficient distributions allow only for volume errors, not timing errors in the recorded rainfall or discharge or discretisation errors of the data and model time steps. Application of these limits resulted in a strong constraint on the acceptable parameter values. Running those acceptable parameter sets for periods including the major flood events in 2005 and 2009 showed that they could provide a range of predictions that spanned the highest peaks in each of those evaluation periods. Here we expand on this approach to consider not only the peaks but all time steps ranked in order of magnitude.
Figure 2 shows the Kent Catchment simulations for the time steps in the 2015 period ranked by observed discharge. The outer dark lines represent the limits of acceptability defined by the 2.5 and 97.5 quantiles of the nearest neighbour distributions of runoff coefficients for each event (the spikes in the limits are generally associated with the peaks of events, particularly those with low observed runoff coefficients. The green shading represents the range of the models considered acceptable in producing no more than 5 % of time steps outside the limits of acceptability at any given discharge threshold, again with an allowance of ±2 h for timing and discretisation errors. At a discharge threshold of 10 m3 s−1, there are 2064 model parameter sets that survive these criteria. Figure 3 shows the runoff coefficient limits and outputs from the 2064 models for part of the 2015 period (including Storm Desmond at 527 m3 s−1) in the more usual hydrograph form.
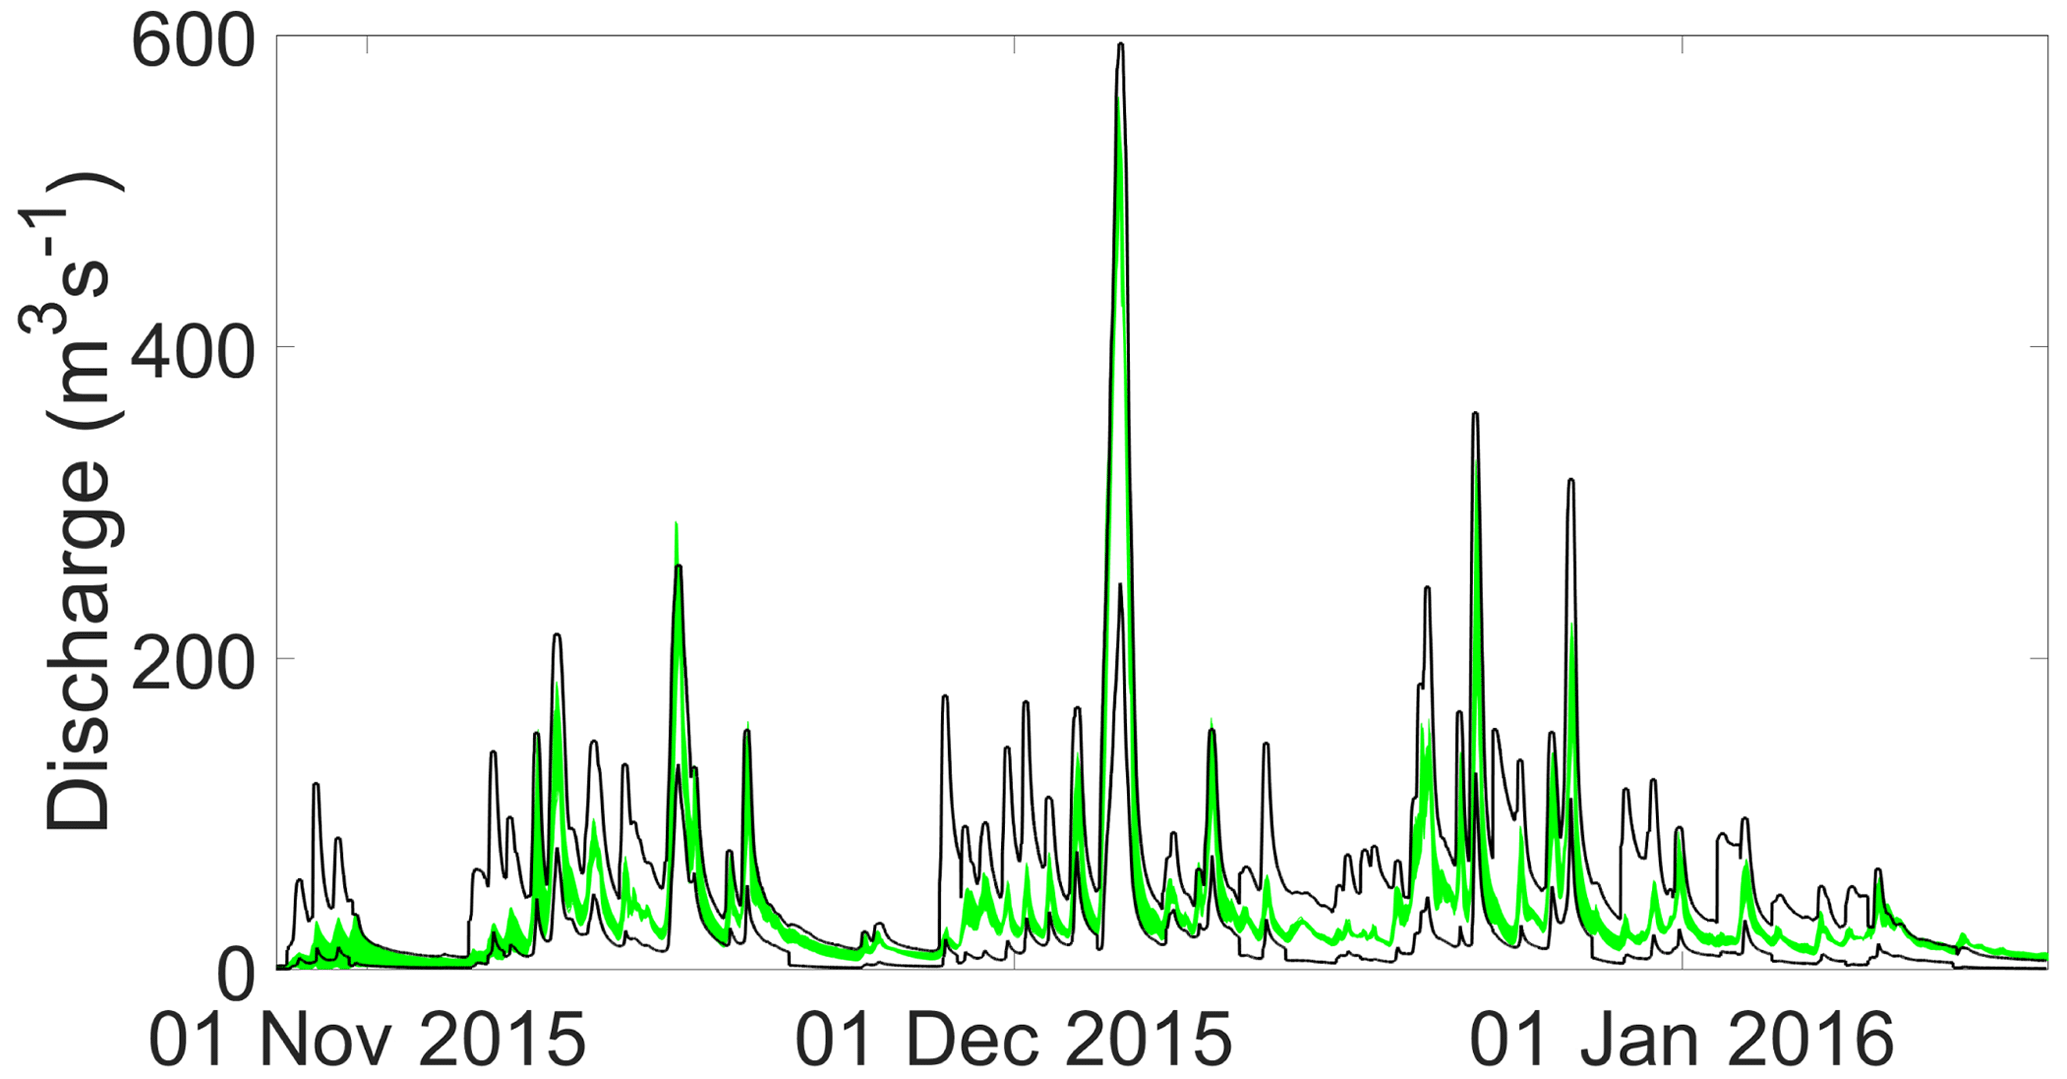
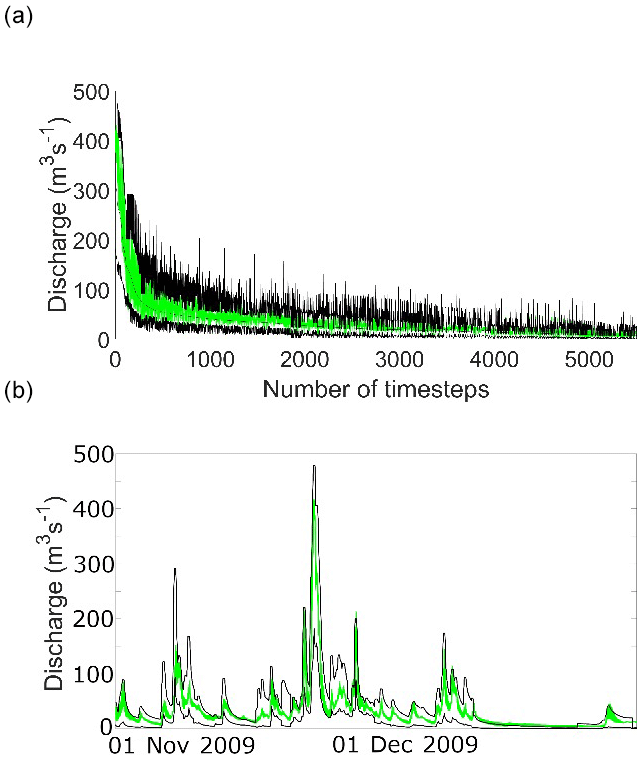
Figure 3Upper and lower 95 % limits of acceptability (black lines) and range of acceptable model predictions (green shading) for part of the 2015 evaluation period.
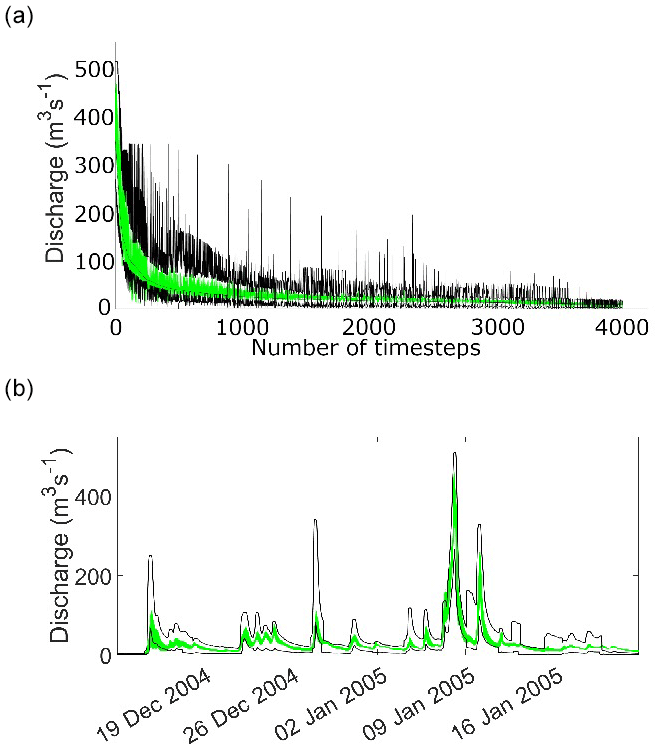
The result of applying this same ensemble of acceptable models to the 2005 and 2009 periods is shown in Figs. 4 and 5.
There have been a number of studies in the past that have tried to go beyond the type of statistical sum of squared errors criterion that have often been used in model calibration. Some have tried to use more formal statistical error models that more properly represent the heteroscedasticity and correlation in the model residuals, while others have argued that when the sources of uncertainty are more epistemic than aleatory then the application of statistical likelihoods or efficiency measures is not really appropriate (e.g. Beven et al., 2008). The type of model evaluation used here has some similarities with the fuzzy weighting method used in Pappenberger and Beven (2004) and elsewhere, but makes use of limits acceptability that are designed to reflect the epistemic uncertainties in the observed water balance for historical events.
Strict application of the limits of acceptability defined in this way, without any allowance for timing errors, results in rejection of all the 100 000 parameter sets tried. This is despite the wide range of runoff coefficients estimated for many events and despite having model efficiency values for some parameter sets of over 0.9 (see Beven et al., 2022). We have here shown that some models can produce acceptable simulations over a large range of discharges, when some allowance in made for timing errors and the evaluations are made on time steps ranked by magnitude. This results in an ensemble of models that might still be fit-for-purpose for peak predictions, even if not for the full range of discharges. It is worth noting that this set of models does not include the highest efficiency values, as some of the highest efficiency simulations produce poorer peak predictions.
There is one aspect of this type of model evaluation that has not been considered explicitly. This is the effect of input errors for one event, having an impact on the simulations for subsequent events. An underestimate of the rainfall inputs, for example, will not only tend to produce an underestimate of the discharge peak for that event, but also result in drier antecedent conditions predicted for the next event. An overestimation of the inputs for a storm will have the opposite effect. The potential variability in peak predictions is implicit in the historical range of runoff coefficients, but not the effect on subsequent events (see also Beven and Smith, 2015).
In the final analysis, all the simulations tried could be rejected if the conditions are applied at all time steps (although it is worth noting that since the runoff coefficient distributions are applied as multipliers in setting the limits of acceptability, the relative errors in simulated values of lower discharges might be large, but the absolute errors will generally be small). This could imply that we need a better model, that can produce credible simulations over the complete range of discharges. However, from the analysis of the runoff coefficients shown in Fig. 1, it is also clear that any model is going to be subject to significant epistemic errors in the observations, particularly in a high-relief catchment like the Kent where raingauges do not exist at higher elevations. This alone is a good reason to use hydrological understanding in the Turing-like test approach to UPH20 being advocated here.
The Dynamic Topmodel code used in this study is available at the R CRAN site https://cran.r-project.org/web/packages/dynatop/index.html (Smith and Metcalfe, 2022). The definition of the limits of acceptability is used as an example workflow in the Matlab CURE Uncertainty estimation toolbox available at https://www.lancaster.ac.uk/lec/sites/qnfm/credible/ (Page et al., 2022.
The data used in the model runs is available on request from n.chappell@lancaster.ac.uk. It will eventually be stored as part of the Q-NFM Project archive on the NERC EIDC database.
KB conceived the use of runoff coefficient based limits of acceptability for model evaluation. PS, TP, AK and BH carried out the simulations and model evaluations within the NERC Q-NFM project led by NC. All the authors contributed to the writing and editing of the submitted paper.
The contact author has declared that none of the authors has any competing interests.
Publisher’s note: Copernicus Publications remains neutral with regard to jurisdictional claims in published maps and institutional affiliations.
This article is part of the special issue “IAHS2022 – Hydrological sciences in the Anthropocene: Variability and change across space, time, extremes, and interfaces”. It is a result of the XIth Scientific Assembly of the International Association of Hydrological Sciences (IAHS 2022), Montpellier, France, 29 May–3 June 2022.
The Environment Agency is thanked for the release of rainfall, streamflow and raw rating data for the Kent catchment for the NERC Q-NFM project under Licence CL77737MG.
This study has been carried out under the NERC funded Q-NFM project (grant no. NE/R004722/1).
This paper was edited by Christophe Cudennec and reviewed by two anonymous referees.
Beven, K., Smith, P. J., and Wood, A.: On the colour and spin of epistemic error (and what we might do about it), Hydrol. Earth Syst. Sci., 15, 3123–3133, https://doi.org/10.5194/hess-15-3123-2011, 2011.
Beven, K. J.: EGU Leonardo Lecture: Facets of Hydrology – epistemic error, non-stationarity, likelihood, hypothesis testing, and communication, Hydrol. Sci. J., 61, 1652–1665, https://doi.org/10.1080/02626667.2015.1031761, 2016.
Beven, K. J.: Towards a methodology for testing models as hypotheses in the inexact sciences, Proceedings Royal Society A, 475, 2224, https://doi.org/10.1098/rspa.2018.0862, 2019.
Beven, K. J. and Lane, S.: Invalidation of models and fitness-for-purpose: a rejectionist approach, Chapter 5, in: Computer Simulation Validation – Fundamental Concepts, Methodological Frameworks, and Philosophical Perspectives, edited by: Beisbart, C. and Saam, N. J., Cham: Springer, 145–171, https://doi.org/10.1007/978-3-319-70766-2_6, 2019.
Beven, K. J. and Lane, S.: On (in)validating environmental models. 1. Principles for formulating a Turing-like Test for determining when a model is fit-for purpose, Hydrological. Process., 36, e14704, https://doi.org/10.1002/hyp.14704, 2022.
Beven, K. J. and Smith, P. J.: Concepts of Information Content and Likelihood in Parameter Calibration for Hydrological Simulation Models, ASCE J. Hydrol. Eng., 20, A4014010, https://doi.org/10.1061/(ASCE)HE.1943-5584.0000991, 2015.
Beven, K. J., Smith, P. J., and Freer, J.: So just why would a modeller choose to be incoherent?, J. Hydrol., 354, 15–32, 2008.
Beven, K. J., Page, T., Hankin, B., Smith, P., Kretzschmar, A., Mindham, D., and Chappell, N. A.: Deciding on fitness-for-purpose – of models and of natural flood management, Hydrol. Process., 36, e14752, https://doi.org/10.1002/hyp.14752, 2022.
Coxon, G., Freer, J., Westerberg, I. K., Wagener, T., Woods, R., and Smith, P. J.: A novel framework for discharge uncertainty quantification applied to 500 UK gauging stations, Water Resour. Res., 51, 5531–5546, 2015.
McMillan, H., Krueger, T., and Freer, J.: Benchmarking observational uncertainties for hydrology: rainfall, river discharge and water quality, Hydrol. Process., 26, 4078–4111, 2012.
Page, T., Smith, P., Beven, K., Pianosi, F., Sarrazin, F., Almeida, S., Holcombe, L, Freer, J., Chappell, N., and Wagener, T.: The CREDIBLE Uncertainty Estimation (CURE) Toolbox, Lancaster University [code], https://www.lancaster.ac.uk/lec/sites/qnfm/credible/ (last access: 10 March 2023), 2022.
Pappenberger, F. and Beven, K. J.: Functional Classification and Evaluation of Hydrographs based on Multicomponent Mapping (Mx), J. River Basin Management, 2, 89–100, 2004.
Smith, P. and Metcalfe, P.: dynatop: An Implementation of Dynamic TOPMODEL Hydrological Model in R, CRAN Repository [code], https://cran.r-project.org/web/packages/dynatop/index.html, last access: 10 March 2023.
Westerberg, I., Guerrero, J.-L., Seibert, J., Beven, K. J., and Halldin, S.: Stage-discharge uncertainty derived with a non-stationary rating curve in the Choluteca River, Honduras, Hydrol. Process., 25, 603–613, https://doi.org/10.1002/hyp.7848, 2011.
- Abstract
- Keywords
- Introduction
- What should be the conditions for fitness-for-purpose?
- Determination of Limits of Acceptability
- The Application: Predicting the Hydrograph Impacts of Natural Flood Management in the Kent catchment
- Results
- Discussion: Better Models or Better Data?
- Code availability
- Data availability
- Author contributions
- Competing interests
- Disclaimer
- Special issue statement
- Acknowledgements
- Financial support
- Review statement
- References