the Creative Commons Attribution 4.0 License.
the Creative Commons Attribution 4.0 License.
 | 16 Nov 2021
Challenges of groundwater pollution and management in transboundary basins at the African scale
Issoufou Ouedraogo
Marnik Vanclooster
We address the significant knowledge gap for groundwater pollution in Africa methods by assessing groundwater pollution risk at the African scale. To do so, we compiled the most recent continental-scale information on soil, land use, geology, hydrogeology, and topography in a Geographical Information System at the resolution of 15 × 15 km and the 1:60 000 000 scale. We produced a vulnerability map by using the generic DRASTIC vulnerability indicator. This map revealed that groundwater is highly vulnerable in Central and West Africa groundwater basins, where the water table is shallow. In addition, very low vulnerability classes are found in the large sedimentary basins of Africa deserts where groundwater is situated in very deep aquifers. The generic groundwater pollution risk map is obtained by overlaying the DRASTIC vulnerability indicator with current land use. The northern, central, and western parts of the African continent are dominated by high vulnerability classes and very strongly related to water table depths and the development of agricultural activities. Given the availability of data, we concentrate first on nitrate vulnerability mapping. To this end, groundwater nitrate contamination data are compiled in literature using meta-analysis technic and used to calibrate as well linear and nonlinear statistical models; the latter performing much better as compared to simple linear statistical models. This study will help to raise awareness of the manager's International Basin Authorities or Transboundary Basin Organizations in Africa and in particular on transboundary groundwater pollution issues.
- Article
(1449 KB) - Full-text XML
- BibTeX
- EndNote


Groundwater is an important water resource for meeting the various water demands in Africa. It is a crucial natural resource supporting the socio-economic development of the African continent; however, it is subjected to many pressures. To define sustainable water resources management plans at the continental scale, assessments of groundwater resources and associated pressures are strongly needed (Hasiniaina et al., 2010; Lapworth et al., 2017). Several studies have already been conducted to improve our understanding of African groundwater systems. The review by Xu and Usher (2006) was one of the most important qualitative works providing insights into common issues with regards to groundwater pollution in Africa at a local/regional scale (e.g. Nigeria, Cameroon, Ethiopia). Notwithstanding the compilation in this book and the recent progress in monitoring technology based for instance on remote sensing technology, no study has intended to assess the pan-African scale groundwater vulnerability for pollution. Assessing groundwater vulnerability for pollution at a large scale is particularly important for monitoring progress in sustainable development goals, such as the target on water issues. In this context, assessing the groundwater vulnerability for pollution is important for designing efficient regional-scale groundwater management and protection strategies.
According to Xu and Usher (2006), the degradation of groundwater is the most serious water resource problem in Africa. The two main threats are overexploitation and contamination (MacDonald et al., 2013). Nitrate is a common chemical contaminant of groundwater and the level of contamination has also increased in many African aquifers (Spalding and Exner, 1993; Puckett et al., 2011). Nitrate ingestion has been linked to methemoglobinemia, adverse reproductive outcomes, and specific cancers (Ward et al., 2005). In addition, nitrate is often a proxy of other possible pollutants of groundwater. Nitrate contamination is therefore very informative for overall groundwater quality. Nitrate contamination of groundwater is; however, a space-time variable property and the level of contamination depends on many space-time variable environmental and anthropogenic attributes.
The prediction and mapping of nitrate contamination pose, therefore, formidable technical and scientific challenges. Statistical models can be used to explain the spatial distribution of observed nitrate concentration in terms of available environmental and anthropogenic attributes, or to discriminate sources of contamination (Nolan and Hitt, 2006). For example, Bauder et al. (1993) investigated the major controlling factors for nitrate contamination of groundwater in agricultural areas using multiple linear regression analysis with land use, climate, soil characteristics, and cultivation types as independent variables. Furthermore, nonlinear random forest techniques have been applied to model nitrate in an unconsolidated aquifer in southern Spain (Rodriguez-Galiano et al., 2014). Norouz et al. (2016) used also a random forest method to determine the Malekan Aquifer vulnerability with several variables such as variables related to the DRASTIC method. Most statistical models used in such a context uses linear regression, nonlinear regression, logistic regression or Bayesian approaches to extract the variables that explain nitrate contamination (Mair and El-kadi, 2013; Mattern et al., 2012). If properly identified and validated, the statistical models can be used to predict nitrate contamination, and map possible contamination at the regional scale. Such maps are extremely valuable for designing transboundary water resources management and protection programs.
The purposes of the study were to improve our understanding of groundwater quality issues at the African scale to support the monitoring of the UN Sustainable Development Goals and in particular Goal 6 “Clean water and Sanitation”. In this regard, we mapped firstly the vulnerability of groundwater to pollution at the continental scale. Secondly, we tried to identify the environmental factors contributing to the nitrate contamination of groundwater. We used the power of meta-analysis, to build pan-African database of groundwater pollution by nitrates. Then we relied on the meta-database to develop an exploratory linear statistical model of nitrate degradation of groundwater in terms of driving attributes available in the best available database. Finally, we used the meta-database to develop a nonlinear statistical method, and outputs were compared to those derived from a statistical linear model.
In this study, groundwater vulnerability was evaluated using the DRASTIC method, a system typically used in groundwater assessment. The acronym DRASTIC corresponds to the initials of the seven variables that drives vulnerability as defined according to Aller et al. (1987). To implement the DRASTIC index methodology at the pan-African scale, a best available database of environmental factors in various spatial resolutions for the continent was established at the resolution of 15 × 15 km and the 1:60 000 000 scale. This GIS database was related to landcover/land use, soil type, hydrogeology, topography (Ouedraogo et al., 2016). Spatial data were processed in ArcGIS10.3™, QGIS™ 2.2 and Matlab™. The DRASTIC vulnerability index was calculated by the addition of the different products (rating × weight of the corresponding variable), using the following the Eq. (1):
where DI, is the DRASTIC index; D, R, A, S, T, I, and C are the seven variables, as defined in Table 1; and the subscripts “r”, and “w” are the corresponding rating and weights. The weights indicate the relative importance of each DRASTIC variable with respect to the other variables. These weights are constant (Ehteshami et al., 1991). The ratings used are in Ouedraogo et al. (2016).
The degree of groundwater vulnerability for pollution was evaluated by combined DRASTIC index and land use Eq. (2):
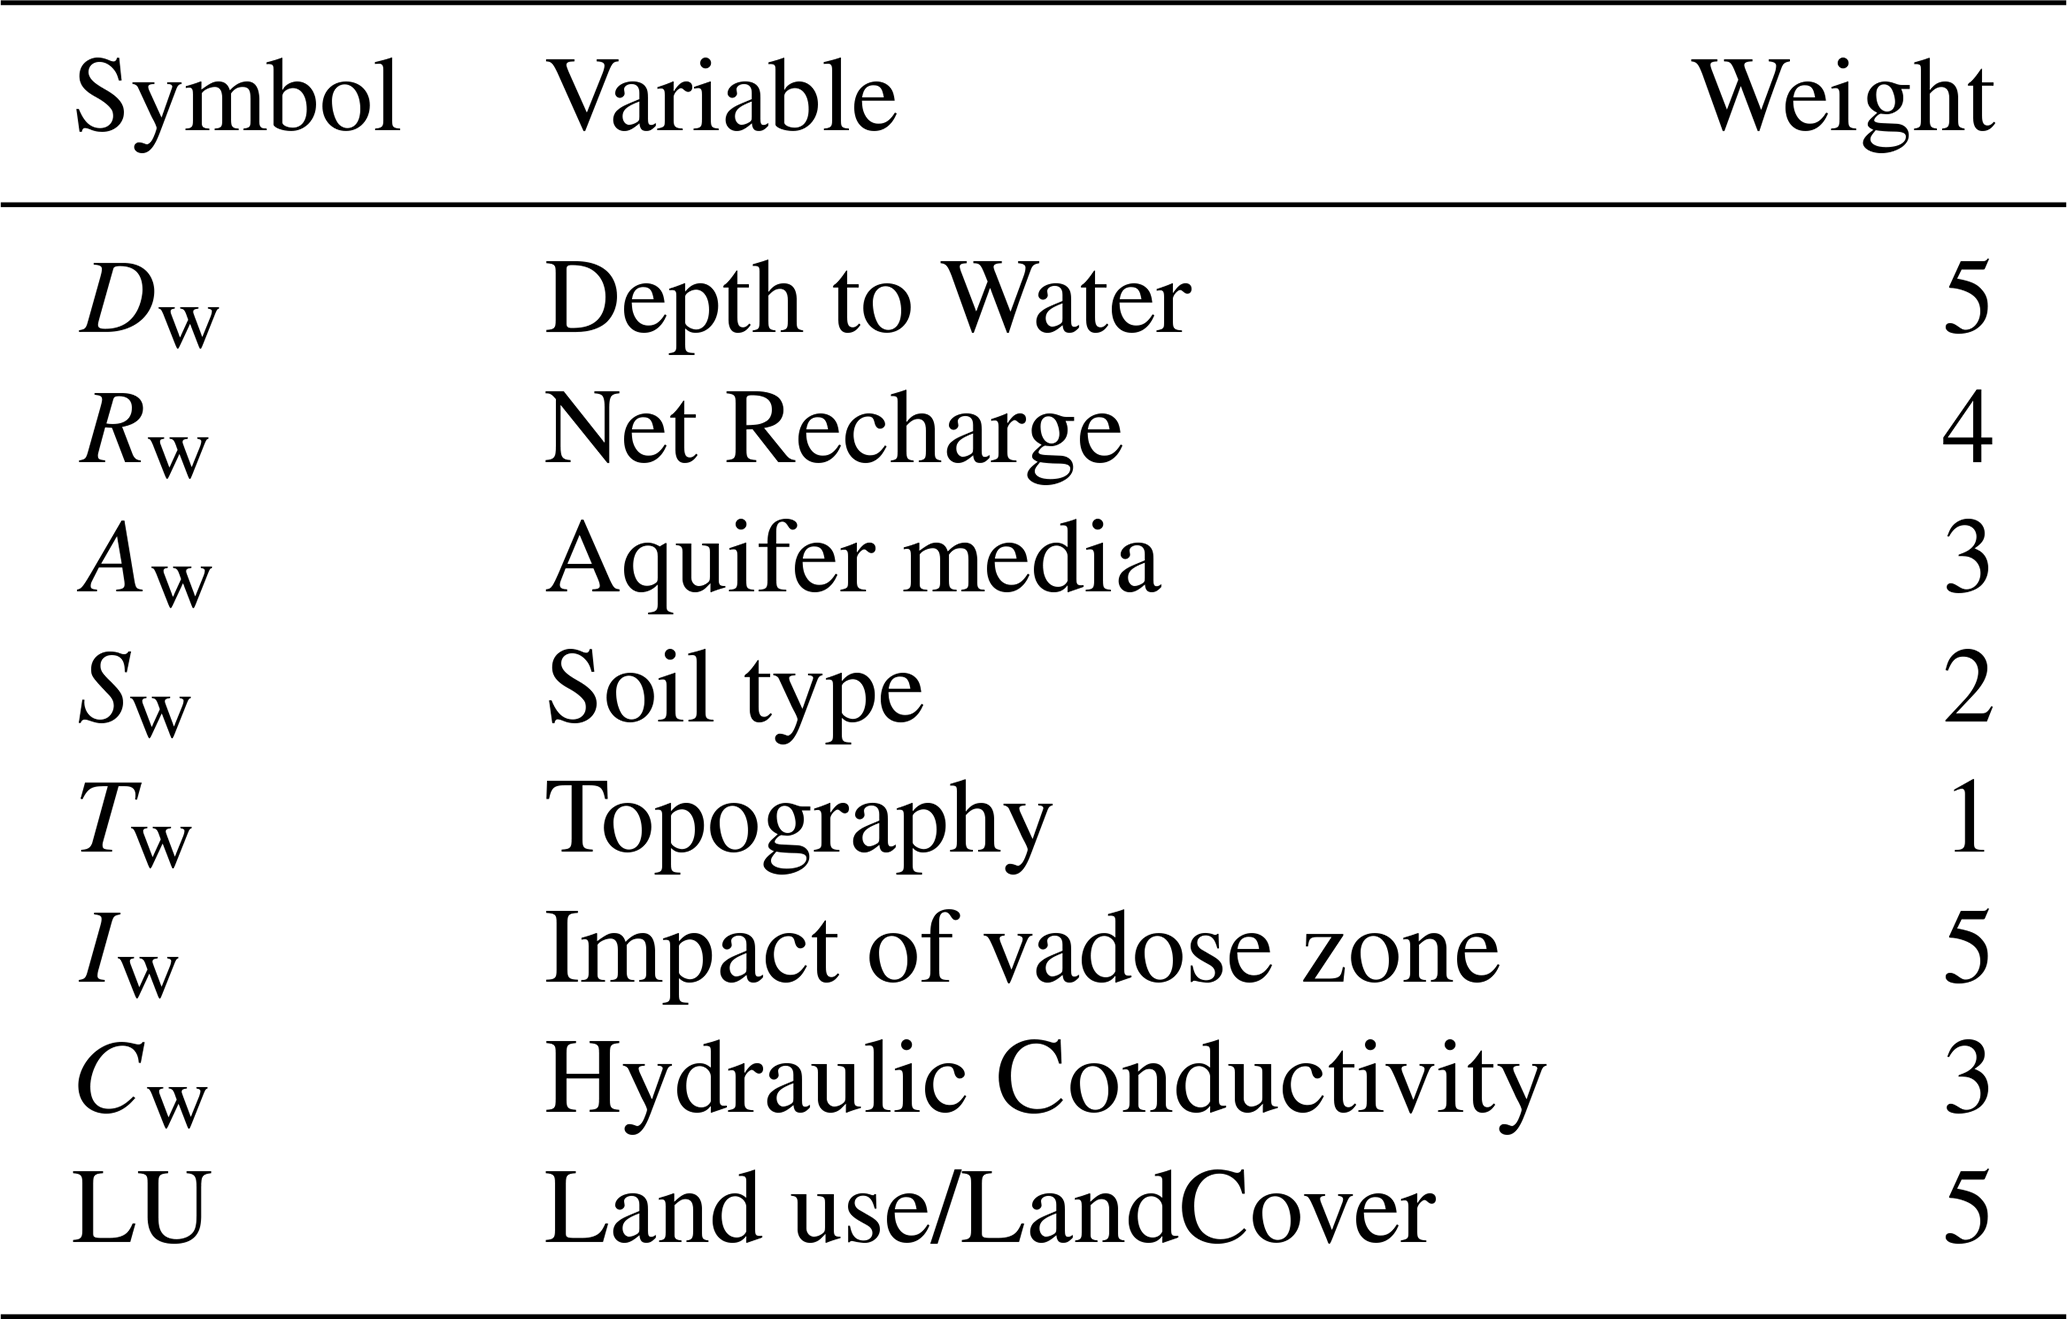
Table 1Weight settings for DRASTIC variables (Aller et al., 1987).
In addition to the pan-African hydrogeological geodatabase, and using the meta-analysis, we have analysed the distribution of nitrate concentration at the continental scale. This analysis was based on studies reported in the literature because of the scarcity of groundwater monitoring data. Thus, 250 publications dealing with groundwater pollution were retrieved from the literature, mainly from books and the internet Web of Sciences (mainly Scopus™). The data were filtered using the following criteria: (i) the publication should explicitly report on nitrate concentrations in groundwater; (ii) we excluded older studies before 1999 since the intensity of human activities is expected to be significantly different after 1999. The dependent variable is the natural log of sampled groundwater nitrate concentration. By using the database collected at the African scale (Ouedraogo and Vanclooster, 2016), the average mean nitrate concentration is 54.85 mg/L, the standard deviation is 89.91 mg/L, and the median concentration is 27.58 mg/L. The log transformation reduces the influence of very high nitrate values (up to 648 mg/L) on model predictions. The nitrate studies were separated into two groups: 80 % of the dataset for building the model (training dataset) and 20 % of the data set for the validation of the model (tested dataset) (Ouedraogo et al., 2018). Furthermore, we used “Random Forest Regression (RFR)” to explain and predict groundwater nitrate contamination at the continental scale and its performance was compared with Multiple Linear Regression (MLR) techniques. A detailed description of the mathematical formulation of the Random Forest model is found in Breiman (2001), Liaw and Wiener (2002). The R statistical software was used for the modelling.
3.1 Mapping output
We produce the first groundwater vulnerability map at the African scale by using the generic DRASTIC index indicator (Fig. 1). We classified this index into 5 classes, ranging from very low to very high index. This map reveals that groundwater is highly vulnerable in Central and West Africa groundwater basins. The low depth of groundwater in these regions and the high recharge explains this highest vulnerability. In addition, very low vulnerability classes are found in the large sedimentary basins of the African deserts where groundwater is situated in very deep aquifers. The transboundary basins in northern, central, and western parts of the African continent are dominated by high vulnerability classes and are very strongly related to water table depths and the development of agricultural activities. Also, Figure 1 gives an overlaying of Transboundary aquifers (TBAs) defined by Altchenko and Villholth (2013). This figure could be used as in example for transboundary aquifers management (International Network of Basin Organizations – INBO, Global Water Partnership – GWP) in Africa.
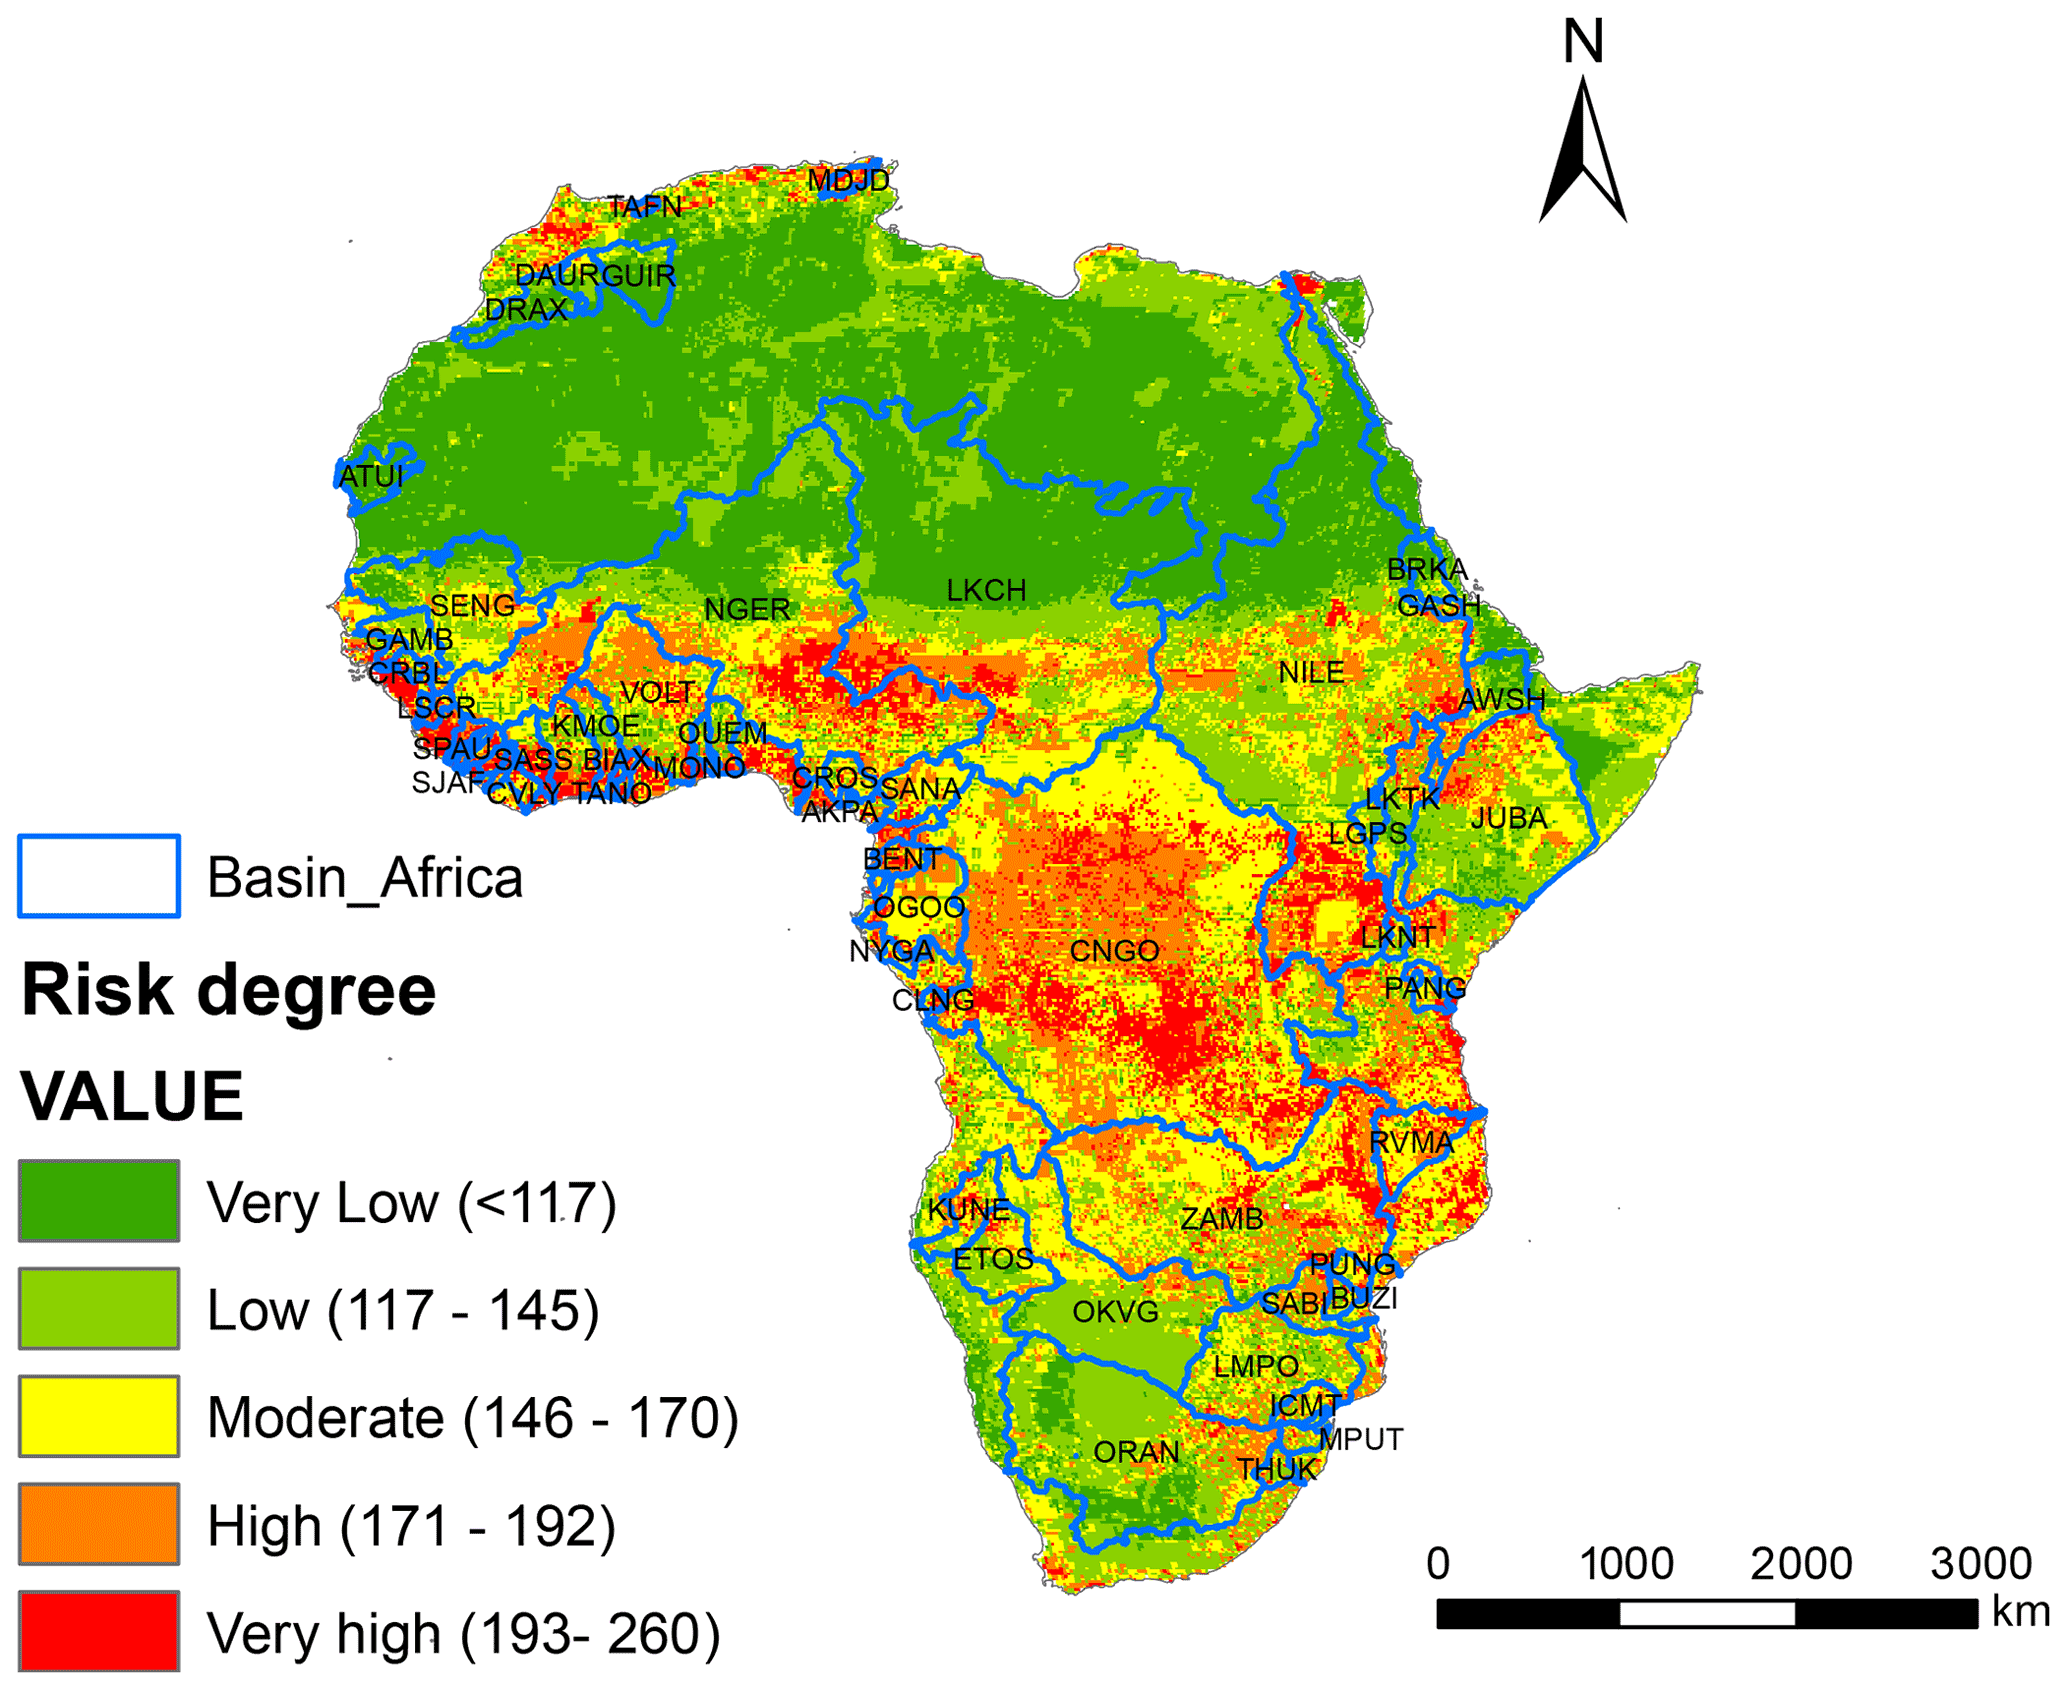
Figure 1Groundwater pollution risk map under different transboundary aquifers.
3.2 Statistical modelling results
Using the stepwise MLR method firstly, we were able to select only those parameters which have a significant impact on the nitrate concentration values. A Student statistic t test was used to check the statistical significance (with p-values < 0.10) of variables in the final model. The MLR model revealed that the four final explanatory variables yielded an R2 of 0.64 of variables in the final model indicating that 64 % of the variation of the observed log-transformed means nitrate concentration at the pan African scale is explained by the model. The four variables are depth to groundwater, recharge, aquifer type, and population density. The residual standard error is 0.95 (ln (mg/L)). A plot of predicted versus the observed log nitrate (ln NO3) concentration in Fig. 2a for the training data, indicates the MLR model shows an acceptable fit with the observed data.

Figure 2Comparison of observed and predicted log (ln) nitrate concentration on training dataset: (a) Linear regression and (b) Random Forest Regression.
Secondly, with the machine learning technique, the percentage of variance explained in the final model of Random Forest Regression (RFR) is 97.9 % (mean of squared residuals = 0.0407 ln (mg/L)). Figure 2b shows a plot of the predicted versus the observed log-transformed nitrate concentration values for the training data, based on only 80 % of observations. The variable importance plot is a critical output of the random forest algorithm. Figure 3 shows the ranking of the relative importance of environmental attributes on groundwater nitrate occurrence. Higher values of a percent increase in mean squared error (MSE) indicate higher importance.
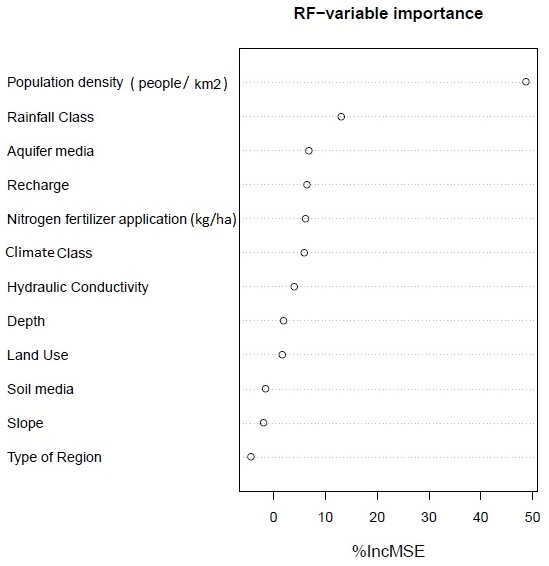
The comparison between the results shows that RFR has a much higher predictive ability compared to MLR. The better performance of RFR is due to the ability to handle nonlinear relationships between nitrate pollution and explaining factors. The most important explanatory variable with the strongest influence on nitrate concentration at the pan-African scale identified in both models was the population density (urban areas, agricultural activity). This is most likely related to the lack of sanitation in major parts of the African continent and the development of small-scale farming systems in peri-urban environments. A strong influence of the population density on groundwater nitrate contamination is consistent with a previous United Nations Environment Program (UNEP) study (e.g., Nolan and Hitt, 2006; Mattern et al., 2009; UNEP/DEWA, 2014; Kihumba et al., 2016; Ouedraogo et al., 2016, 2018). This study at the pan African scale could prompt national or international authorities to foster targeted local investigations because nowadays, many international agencies investigate transboundary basins aquifers in Africa (e.g., Observatoire du Sahara et du Sahel, Intergovernmental Authority for Development, Global Water Partnership, African Ministerial Council on Water African Union).
Despite several limitations in this study, due to the DRASTIC method, the scale at which data were gathered, the spatial resolution of mapping, the uncertainty of spatial data, the information gained from the analysis of historical groundwater quality data focusing on nitrate contamination, the main lesson of the study is to remind that shallow groundwater poses pollution problems in Africa. The map that was designed in this study can increase awareness of citizens and leaders in areas where groundwater pollution is likely to be significant. In addition, they could prompt national or international authorities to foster targeted local investigations. In fact, environmental management needs to be operatively performed at regional and local scales, but investment policies can be addressed at continental (transboundary water management) or even global scales by international agencies and authorities (e.g., Food and Agriculture Organization, United Nations Environment Programme/United Nations Educational, Scientific and Cultural Organization, International Network of Basin Organizations (INBO), and African Ministerial Council on Water African Union.
The results of the study have shed light on the pollution problem of shallow groundwater at the pan-African scale.
We demonstrated the unambiguous link between population density and groundwater nitrate contamination. We showed that the Random Forest machine learning techniques are promising for modelling groundwater degradation at the African scale because of its ability to provide meaningful analysis of nonlinear and complex relationships such as those found in hydrogeological studies. This paves the way for creating a water quality map at the continent scale of Africa. The study represents an important step toward developing tools that will allow us to accurately predict the distribution of nitrate contamination in groundwater in the context of climate change.
The vulnerability map was implemented using ARC-GIS ESRI software. The statistical models were calibrated in R-software. The ARC-GIS modelmaker and R-scripts to process the data can be obtained by writing to the corresponding author.
The spatial data used to map the vulnerability is obtained using public available data as described in the paper. The N literature data base can be obtained by writing to the corresponding authors.
The two authors developed the methodology. IO prepared the datasets, performed the data analysis, wrote the manuscript. MV reviewed the manuscript. The two authors have read and agreed to the published version of the manuscript.
The contact author has declared that neither they nor their co-author has any competing interests.
Publisher’s note: Copernicus Publications remains neutral with regard to jurisdictional claims in published maps and institutional affiliations.
This article is part of the special issue “Hydrology of Large River Basins of Africa”. It is a result of the 4th International Conference on the “Hydrology of the Great Rivers of Africa”, Cotonou, Benin, 13–20 November 2021.
GIS shapefiles to generate generic attributes were obtained from different sources through the World and also online. In this regard, special thanks go to Tom Gleeson, Petra Döll, Nils Moosdoorf, and Patricia Trambauer. This study has been supported by Université catholique de Louvain through the “Fonds Spécial de Recherche” and Islamic Development Bank Merit Scholarship Program for PhD thesis. We thank two anonymous reviewers for their constructive comments.
Aller, L., Bennet, T., Leher, J. H., Petty, R. J., and Hackett, G.: DRASTIC: a standardized system for evaluating ground water pollution potential using hydrogeological settings, US Environmental Proctection Agency, Ada Oklahoma 74820, EPA 600/2-87-035, 662 pp., 1987.
Altchenko, Y. and Villholth, K. G.: Transboundary aquifer mapping and management in Africa: a harmonised approach, Hydrogeol. J., 21, 1497–1517, https://doi.org/10.1007/s10040-013-1002-3, 2013.
Bauder, J. W., Sinclair, K. N., and Lund, R. E.: Physiographic and land use characteristics associated with nitrate nitrogen-nitrogen in Montana groundwater, J. Environ. Qual., 22, 255–262, https://doi.org/10.2134/jeq1993.00472425002200020004x, 1993.
Breiman, L.: Random forests, Mach. Learn., 45, 5–32, https://doi.org/10.1023/A:1010933404324, 2001.
Ehteshami, M., Peralta, R. C., Eisele, H., Dear, H., and Tindall, T.: Assessing groundwater pesticide contamination to groundwater: a rapid approach, Ground Water, 29, 862–868, https://doi.org/10.1111/j.1745-6584.1991.tb00573.x, 1991.
Hasiniaina, F., Zhou, J., and Guoyi, Z. L.: Regional assessment of groundwater vulnerability in Tamtsag basin, Mongolia using drastic model, J. Am. Sci., 6, 65–78, 2010.
Kihumba, A. M., Longo, J. N., and Vanclooster, M.: Modelling nitrate pollution pressure using a multivariate statistical approach: the case of Kinshasa groundwater body, Democratic Republic of Congo, Hydrogeol. J., 24, 425–437, 2016.
Lapworth, D. J., Nkhuwa, D. C. W., Okotto-Okotto, J., Pedley, S., Stuart, M. E., Tijani, M. N., and Wright, J. J. H. J.: Urban groundwater quality in sub-Saharan Africa: current status and implications for water security and public health, Hydrogeol. J., 25, 1093–1116, https://doi.org/10.1007/s10040-016-1516-6, 2017.
Liaw, A. and Wiener, M.: Classification and regression by random forest, Vol. 2/3, December 2002, ISSN 1609-3631, available at: https://cogns.northwestern.edu/cbmg/LiawAndWiener2002.pdf (last access: 9 April 2021), 2002.
MacDonald, A., M., R. Taylor, G., and Bonsor, H. C. (Eds.): Groundwater in Africa – is there sufficient water to support the intensification of agriculture from “Land Grabs”, Hand book of land and water grabs in Africa, 376–383, 2013.
Mair, A. and El-Kadi, A. I.: Logistic regression modeling to assess groundwater vulnerability to contamination in Hawaii, USA, J. Contam. Hydrol., 153, 1–23, https://doi.org/10.1016/j.jconhyd.2013.07.004, 2013.
Mattern, S., Fasbender, D., and Vanclooster, M.: Discriminating sources of nitrate pollution in a sandy aquifer, J. Hydrol., 376, 275–284, https://doi.org/10.1016/j.jhydrol.2009.07.039, 2009.
Mattern, S., Raouafi, W., Bogaert, P., Fasbender, D., and Vanclooster, M.: Bayesian Data Fusion (BDF) of monitoring data with a statistical groundwater contamination model to map groundwater quality at the regional scale, J. Water Resour. Protect., 4, 929–943, https://doi.org/10.4236/jwarp.2012, http://hdl.handle.net/2078.1/114949, 2012.
Nolan, B. T. and Hitt, K. J.: Vulnerability of shallow groundwater and drinking-water wells to nitrate in the United States, Environ. Sci. Technol., 40, 7834–7840, https://doi.org/10.1021/es060911u, 2006.
Norouz, H., Asghari Moghaddam Negar, A. M., and Attaallah, N.: Determining vulnerable areas of malekan plain aquifer for nitrate, using random forest method, J. Environ. Stud. Winter, 41, 923–942, 2016.
Ouedraogo, I. and Vanclooster, M.: A meta-analysis and statistical modelling of nitrates in groundwater at the African scale, Hydrol. Earth Syst. Sci., 20, 2353–2381, https://doi.org/10.5194/hess-20-2353-2016, 2016.
Ouedraogo, I., Defourny, P., and Vanclooster, M.: Mapping the groundwater Vulnerability for pollution at the pan-African scale, Sci. Total Environ., 544, 939–953, https://doi.org/10.1016/j.scitotenv.2015.11.135, 2016.
Ouedraogo, I., Defourny, P., and Vanclooster, M.: Application of random forest regression and comparison of its performance to multiple linear regression in modeling groundwater nitrate concentration at the African continent scale, Hydrogeol. J., 27, 1081–1098, https://doi.org/10.1007/s10040-018-1900-5, 2018.
Puckett, L. J., Tesoriero, A. J., and Dubrovsky, N. M.: Nitrogen contamination of surficial aquifers – a growing legacy, Environ. Sci. Technol., 45, 839–844, https://doi.org/10.1021/es1038358, 2011.
Rodriguez-Galiano, V., Mendes, M. P., Garcia-Soldado, M. J., Chica-Olmo, M., and Ribeiro, L.: Predictive modeling of groundwater nitrate pollution using Random Forest and multisource variables related to intrinsic and specific vulnerability: a case study in an agricultural setting (Southern Spain), Sci. Total Environ., 476/477, 189–206, https://doi.org/10.1016/j.scitotenv.2014.01.001, 2014.
Spalding, R. F. and Exner, M. E.: Occurrence of nitrate in groundwater – a review, J. Environ. Qual., 22, 392–402, https://doi.org/10.2134/jeq1993.00472425002200030002x 1993.
UNEP/DEWA: Sanitation and Groundwater Protection – a UNEP Perspective UNEP/DEWA, 18 pp., available at: http://www.bgr.bund.de/EN/Themen/Wasser/Veranstaltungen/symp_sanitat-gwprotect/present_mmayi_pdf.pdf?_blob=_publicationFile&v=2 (last access: 14 August 2019), 2014.
Ward, M. H., DeKok, T. M., Levallois, P., Brender, J., Gulis, G., Nolan, B. T., and VanDerslice, J.: Workgroup Report: Drinking-Water Nitrate and Health – Recent Findings and Research Needs, Environ. Health Perspect., 113, 1607–1614, https://doi.org/10.1289/ehp.8043, 2005.
Xu, Y. and Usher, B.: Groundwater pollution in Africa, Taylor & Francis/Balkema, the Netherlands, 353 pp., 2006.