the Creative Commons Attribution 4.0 License.
the Creative Commons Attribution 4.0 License.
 | 16 Sep 2020
Extreme Rainfall and Temperature Changes Assessment on late-twenty-first-century over the Mono River Basin, Togo (West-Africa)
Batablinlè Lamboni
Agnidé Emmanuel Lawin
Celestin Manirakiza
Dagbégnon Luc Olabodé
This study assessed the extreme rainfall and temperature changes over Mono river basin by the end of 21st century under the highest greenhouse gas emission scenario RCP8.5. Simulations of eight regional climate models (RCMs) provided by Africa-CORDEX program were considered. The maximum and minimum temperatures and rainfall were analyzed. Two groups of indices were analyzed. The first group consists of frequency indices: maximum number of consecutive dry days and wet days. The second group is intensity indices: five-day maximum rainfall and simple daily intensity index. These variables were calculated at annual and seasonal scales. Changes from the baseline period 1971–2000 were computed for far future 2071–2100. As result, almost all the RCMs considered predicted a decrease of the rainfall and increase of maximum and minimum temperatures over most parts of the Mono basin, particularly in the south. Declining mean monthly precipitation and irregular rainy seasons at all scales were exhibited by most of the models. Simple daily intensity and five-day maximum rainfall are projected to decrease by the majority of the used models. As for dry and wet sequences, the RCMs showed an increase of the consecutive dry days and a decrease of wet days.
- Article
(782 KB) - Full-text XML
- BibTeX
- EndNote


A global view of climate change impacts is important to quantify the aggregated effects in a given region since large scale processes can influence driving forces at sub regional or mesoscale. Indeed, the detection of the planetary warming trend, attributed to anthropogenic activities, have been presented with greater certainty in the 4th report of the IPCC. According to this report, the average global temperature will increase and could reach 4.5 ∘C by 2100, the precipitation will change and the extreme events will be increasingly recurring. Several studies (Aguilar et al., 2013; IPCC, 2013; Masson et al., 1999) showed that impacts of climate extremes are mostly depending on the spatial scale considered and vary from a region to another, from country to country and even from one local area to another within the same country. For Africa, many previous studies have investigated extreme events and have showed that changes in extreme temperature and precipitation are contrasting (Yèkambèssoun et al., 2017.). Current and future trends suggested that regions: West Africa, including the Sahara, the Horn of Africa, part of Central Africa and southern hemispheres, could undergo a warming of order of 3 to 6 ∘C by 2100. Pluviometric regimes will also be affected and may decrease of more than 20 % to 30 % compared to the reference 1961–1990 (Bigot, 2003). Other studies indicated an increase in extreme rainfall events, particularly in Sahel (Nicholson and Webster, 2007) but also a decrease in Nigeria (Oguntundé et al., 2011) and (Easterling et al., 2000), Guinea Conakry (Aguilar et al., 2009), in eastern Niger (Ozer et al., 2009), in Ivory-Coast (Soro et al., 2014), in Benin (Yèkambèssoun et al., 2017) and in South Africa (Mason et al., 1999). In the northern part of Africa, there is a tendency towards wetter conditions; in contrast with the eastern part, experienced with more drying trends, although, these trends are of low significance. The understanding and characterizing climate variability at reduced scales are so fundamental to understanding the impacts of climate change, local vulnerability and for future development projects (Emmanuel et al., 2019).
For the specific case of Togo, according to the report of republic of Togo (MERF, 2009), floods, drought, late rains, high temperatures and high winds, are the major risks in the country. The drought covers the entire territory except for the coastal region which is however facing sea level rise risk. It should be noted that among the latest climatic events, flooding takes precedence over other risks with its share of material damage and loss of life. It is becoming more and more dangerous to the whole country. Activities which are most exposed to these risks are farming, livestock farming, marketing of agricultural products and market gardening (MERF, 2009). Therefore, it compels scientists to conduct studies on climate change projection in Togo in order to take adaptation measures to enhance these communities in their development. However, studies of the future impact of climate change on precipitation and temperature are very few. Nelson et al. (2010) assessed impacts of precipitation and temperature changes on agricultural productivity by 2050 in Togo. This study used global climate models (GCMs) with spatial resolution of 200 to 300 km that cannot give details at less scales. So these models are only important when it comes to representing climate on a very large scale of space. But at regional level, they present many limitations (Hulme et al., 2001). In order to fill this resolution issue, Regional Climate Models (RCMs) from CORDEX (COordinated Regional Climate Downscaling EXperiment) are now proposed in our study because of their high spatial resolution (10 to 100 km). Furthermore Batablinlè et al. (2018) showed, at the Mono river basin scale, there was very few study focuses on future evolution of the extreme temperatures, number of extremely heavy rainfall days, consecutive dry days, consecutive wet days, five-day maximum rainfall, simple daily intensity index. We have therefore found it necessary to evaluate the future changes of climate indices using the World Meteorological Organization (WMO) reference period 1971–2000 computed from Regional Climate Models (RCMs). In this study, rain and temperature simulated by 8 RCMs from the Africa-CORDEX program have been analyzed through maximum and minimum temperatures, average rainfall and extreme precipitation events by 2100 on the Mono river basin which is the major economical part of Togo in terms of agricultural and energy outputs. The objective of this work is therefore to provide knowledge and more details about extreme rainfall and temperature for the population of Mono river basin.
2.1 Study area
This study area has already been described by certain authors (Batablinlè et al., 2018; Lamboni et al., 2019b).
Mono basin is located in the Gulf of Guinea region, more precisely Between 06∘16′ and 09∘20′ N and 0∘42′ and 20∘25′ E. The Mono basin is almost entirely in Togo although its lower course is between Togo and Benin. Our study considered the part in Togo (Fig. 1). It houses a dam of hydroelectric power plant called Nangbéto. Elongated, covering 25 400 km2, the Mono basin is the major river of Togo. In general, West Africa's climate is controlled by the interaction of two air masses; the inuence of which varies throughout the year with the north-south movement of the Intertropical Convergence Zone (ITCZ). Hot and dry continental air masses originating from the high pressure system above the Sahara desert give rise to dusty Harmattan winds over most of West Africa from November to February. In summer, moist equatorial air masses originating over the Atlantic Ocean bring annual monsoon rains. Within this West African context, rainfall in the study area is characterized by two types of rainfall regimes. In southern basin there are two rainy seasons which extend from mid-March to mid-July and from mid-August to October. In northern basin, there is one rainy season which extends from April to October. Indeed, according to the report of PANA-Togo (MERF, 2009), the country is inuenced by two large climate systems: The tropical Soudanian system in the north with a wet season running from May to October and a dry season from November to April. In this area pluviometry varies from 900 to 1100 mm per year with an average temperature of 28 ∘C; the tropical Guinean system in the south is characterized by two dry seasons and two wet seasons of unequal duration with pluviometry located between 1000 and 1600 mm yr−1 and an average temperature of 27 ∘C. According to the report of WAEMU in 2006, the population of the basin is approximately two million, with an annual increase of 2.9 %. This population also distributed at high densities in the south of the basin has as main activities, agriculture (mainly rainfed); in the lower valleys, fishing and salt-farming are the major activities (Ernest et al., 2015).
2.2 Data and Sources
The observed daily rainfall and temperature data used in this study, are provided by the Togo National Meteorology Agency (Météo Togo) for the period 1970–2000 for eight stations spatially located as shown in Fig. 1 and complemented by other sources such as the archives of ORTM Togo and the Nangbeto dam. The missing data values were replaced statistically by similar day averages for the previous years where there were existing data values. Table 1 shows the Cordex models used. In order to develop future climate change projections on Mono river basin, the most recent Regional Climate Models (RCMs) provided by the COordinated Regional Downscaling EXperiment (CORDEX) Africa were analyzed. These models were run using different emission scenarios, so-called Representative Concentration Pathways (RCPs) which provide different assumptions of greenhouse gas emission pathways. One of RCPs was selected in this study to cover a wide high (RCP8.5) global anthropogenic radiative forcing. We made the choice to download the values of several climate variables of eight models available in a spatial resolution 0.44∘ or 50 km. It has already been used over Mono basin by certain authors as (Batablinlè et al., 2018; Emmanuel et al., 2019; Lamboni et al., 2019a).
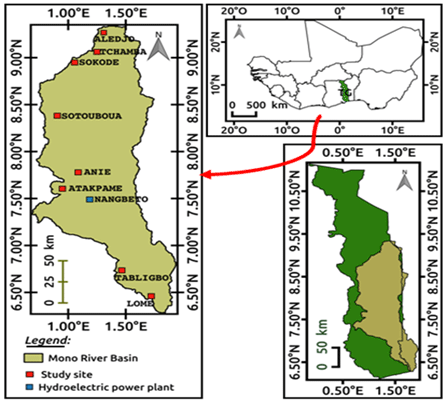
Figure 1The geographical location (sources Batablinlè et al., 2018).
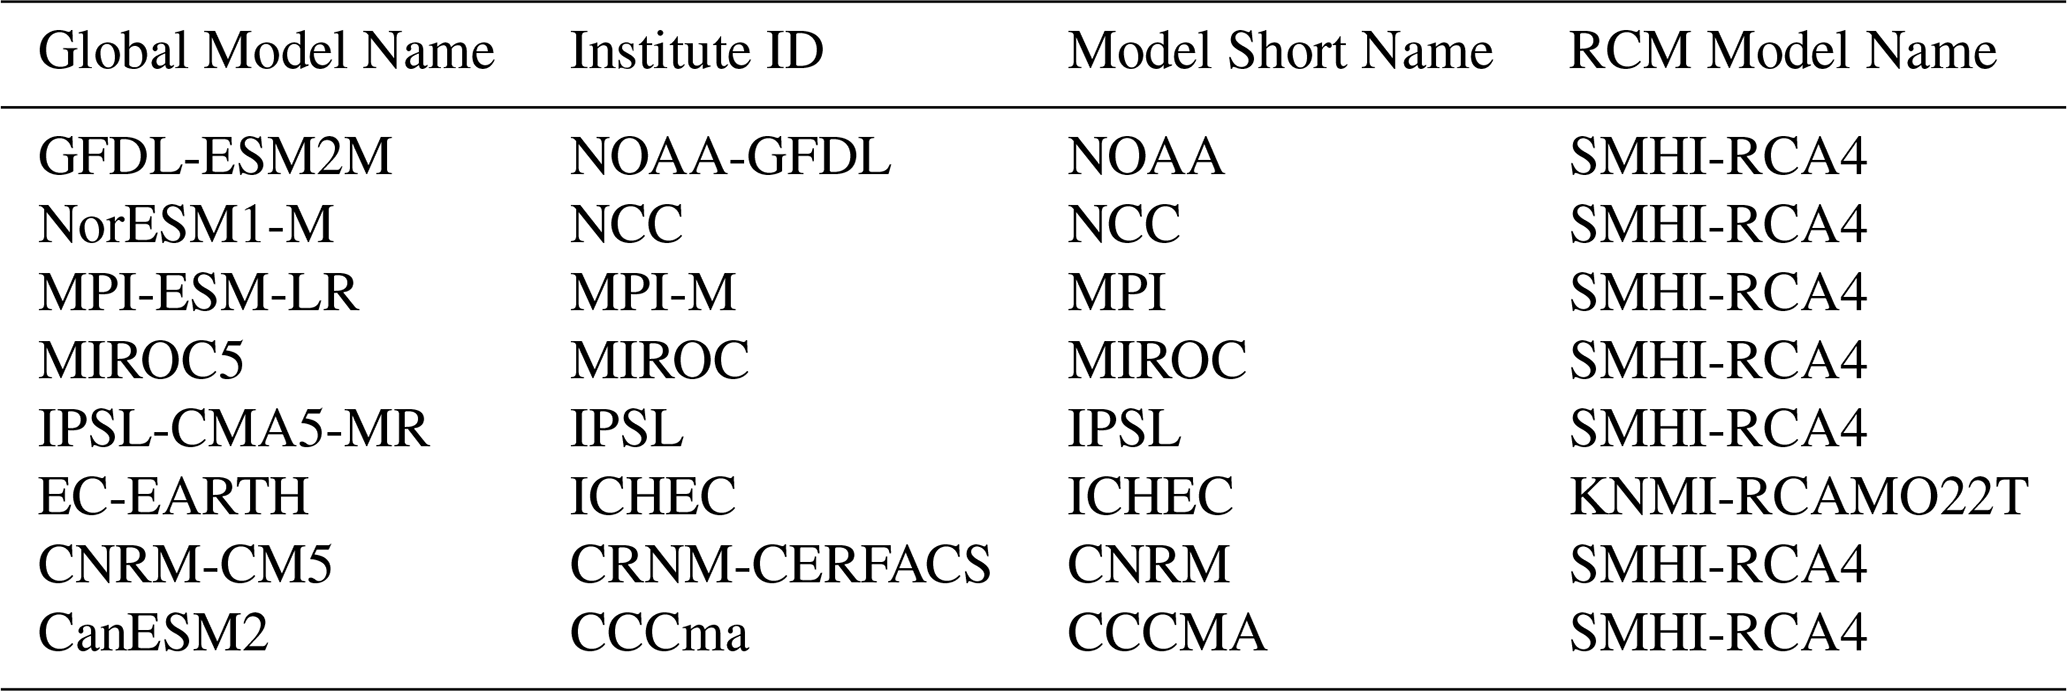
Table 1Used climatic models, global model under which they are run (column 1), their Institute of origin (column 2), their short name (column 3) and RCM model Name (column 4).
2.3 Methods
The seasonal averages as well as the annual averages were calculated using the Climate Data Operator Commands (Batablinlè et al., 2018; Emmanuel et al., 2019). Then, the free software R is used to compute all the statistical parameters and all the plots presented in the following. In this study, four climatic indices associated to the precipitations and temperatures were considered as potentially impacting on the availability of water resources, population and agricultural productivity in this zone (Emmanuel et al., 2019). These indices, computed with Climate Data Operator Commands, are defined in Table 2 as follow. To bias-correct the model future projection, the cumulative distribution function matching (CDFm) of the model in the reference period is used to identify the corresponding percentile values of the future period (Batablinlè et al., 2018). Later the observation CDFm is used to find the climate variable value for the same future cumulative probability, which represents the bias corrected future value. The drawback of the above procedure of bias correction is the assumption of constant bias between the reference and future periods . However, we will accept this assumption as most of the recent studies did (Sarr and Camara, 2017) as mentioned earlier, bias correction and spatial disaggregation relies on finer-scale observation data and consists of the following steps: (1) aggregate finer-scale observed data to a RCM-specific scale; (2) correct the RCM's systematic biases through quantile mapping; and (3) disaggregate bias-corrected outputs to a finer scale (Batablinlè et al., 2018). An equiratio cumulative distribution function matching (equiratio CDFm): The statistical transformation can be written as:
and
with (Eq. 1) for precipitation and (Eq. 2) for temperature, where Fm−p is the cumulative distribution function (CDF) of the model for a future projection period, and and
are quantile functions for observations and model in the reference period, respectively. h1 and h2 were defined by:
and
A complete description of this method is described by Gudmundsson et al. (2012).
Before this procedure, statistical measures such as the relative error or mean absolute error were used to describe and compare the observed and simulated variables. The relative error (EP and ET), respectively for precipitations and temperatures of the estimated values of the rainfall may be calculated from the following Eqs. (1) and (2):
and finally, the changes from the reference period are assessed as shown by Eqs. (7) and (8) respectively for precipitations and indices (ΔXP,I) and temperatures (ΔXT)
or
where FUT and HIST represent respectively for the future (by 2100) and the historical or reference period (1971–2000).
Table 2Selected indices and their signification.

* PRCP – daily total precipitation
3.1 Results
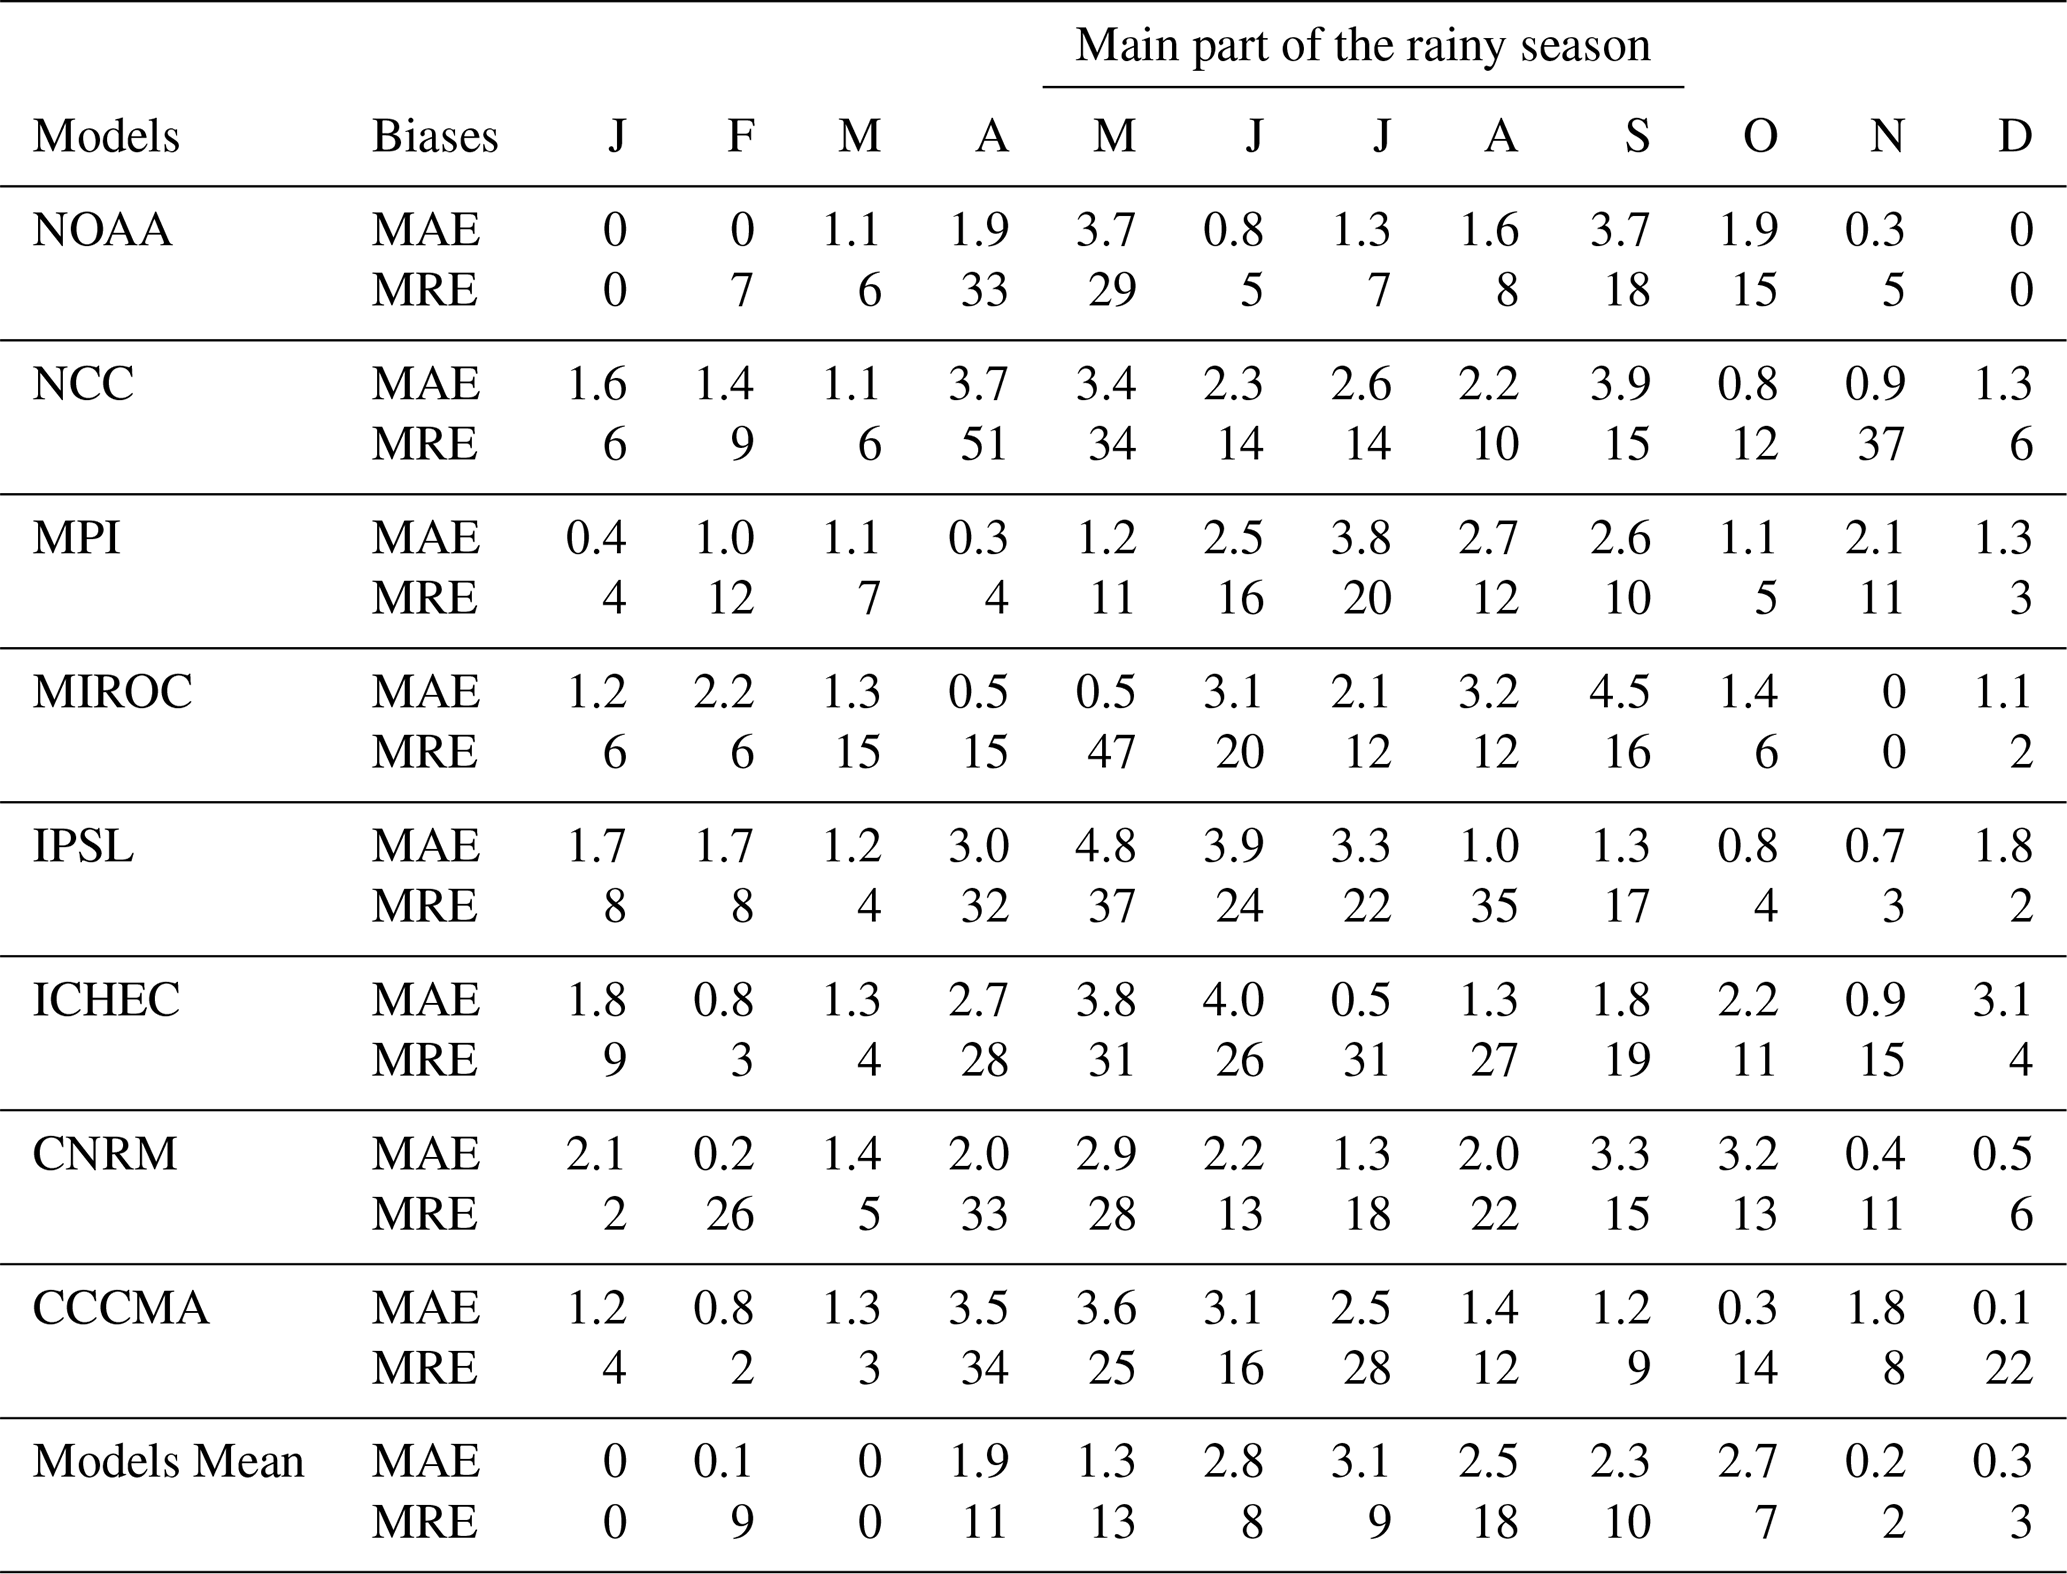
Before assessing the climate change scenario we evaluated the considered models' performances to represent the climate of the study region. Table 3 showed that the spatial mean rainfall MAE (Mean absolute error) of the selected RCMs are weak and not greater than 3 mm d−1 in mean during the main part of the rainy season which is June to September (the agricultural period). NOAA model is the most accurate model while MIROC model showed the biggest MRE (Mean relative error). The higher bias between simulated and observed data, may be caused by errors in measuring data and errors associated with the model. The statistical analysis show that there is no enough an agreement between simulated and observed variables which such as mean temperatures (minimum and maximum) and precipitations (Pm). Obviously, current RCMs still have substantial deficiencies in simulating the regional climate over Mono. To produce the reliable projections required for regional climate assessment, we need to bias-correct the raw RCM outputs.
3.1.1 Changes of Minimum and Maximum temperature
Predicted changes of maximum temperature and minimum temperature between the far future (2071–2100) and the reference period (1971–2000) are shown by Fig. 2. For the maximum temperature, all the models predicted an increase for the whole basin except model canESM2 which showed a slight decrease for a small part of the southern basin. The lowest increase is 0.42 ∘C and is projected by the model CNRM-CM5. The highest increase is 3.3 ∘C and is projected by the rest of models. The north of the basin is forecasted to experience the greatest increase according to almost all the models. The projections exhibited clearly an increase in days of high heat in the north as shown by the models CNRM-CM5 (1), GFDL-ESM2M (6) , EC-EARTH (3), IPSL-CMA5-MR (4), MPI-ESM-LR (6), NorESM1-M (7) and Models-Mean (9). However, for models CCCMA, the maximum temperature will be relatively cooler on some area in the southward of the basin (mean value −0.29 ∘C) and a strong increase on the rest of this area. In the north and the center, the maximum temperature will increase in average by 1 ∘C for model CNRM-CM5 (1) and model MPI-ESM-LR (5), 0.22 ∘C for model GFDL-ESM2M (6), 1.45 ∘C for models EC- EARTH (3), IPSL-CMA5-MR (4) and NorESM1-M (7). Globally, the Models-Mean (9) predicted 1 ∘C as rate of increase.
Table 3Spatial mean Rainfall MAE (in mm) and MRE (in %) between observations and bias corrected simulations over Mono river basin.
The analysis of projected minimum temperature for far future revealed that there is a relative uniform evolution over the entire study period for all models except models CNRM-CM5 (1) and EC-EARTH (3). Indeed, in the northward, the minimum temperature were projected and will increase for (mean value 1.55 ∘C), (mean value 1.45 ∘C), (mean value 2 ∘C), (mean value 1.4 ∘C), (mean value 2 ∘C), (mean value 2.4 ∘C) and (mean value 1.2 ∘C), respectively, for models MIROC5 (2), IPSL-CMA5-MR (4), MPI-ESM-LR (5), GFDL-ESM2M (6), NorESM1-M (7), canESM2 (8) and Models-Mean (9) . For the models CNRM-CM5 (1) and EC- EARTH (3), the results exhibit an increasing average for the minimum temperature in the north. When considering the southward and the center, models used predict an increasing average for, (mean value 2.5 ∘C), (mean value 0.51 ∘C), (mean value 1.82 ∘C), (mean value 2 ∘C), (mean value 1.22 ∘C), (mean value 1.55 ∘C) and (mean value 1.83 ∘C), respectively, for models MIROC5 (2), IPSL-CMA5-MR (4), MPI-ESM-LR (5), GFDL-ESM2M (6), NorESM1-M (7), canESM2 (8) and Models-Mean (9). While for models CNRM-CM5 (1) and (C) EC-EARTH (3), the results show a relative rise of the minimum temperature but more than 1 ∘C.
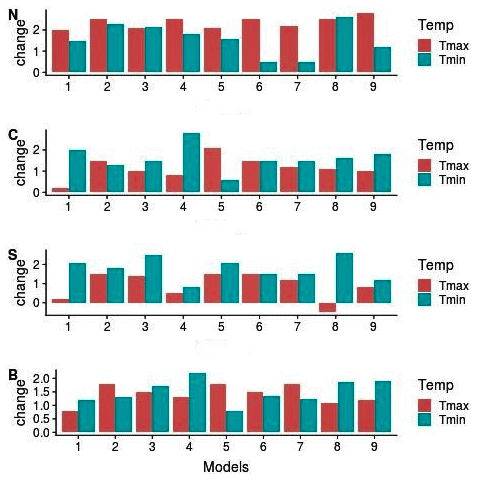
Figure 2Maximum and minimum temperature changes (∘C) between far future (2071–2100) and historical period (1971–2000) during May to September for models: (1) CNRM-CM5, (2) MIROC5, (3) EC-EARTH, (4) IPSL-CMA5-MR, (5) MPI-ESM-LR, (6) GFDL-ESM2M, (7) NorESM1-M, (8) CanESM2 and (9) Models-Mean (ensemble mean of Model) in the North (N), Center (C), South (S) and over mono basin (B).
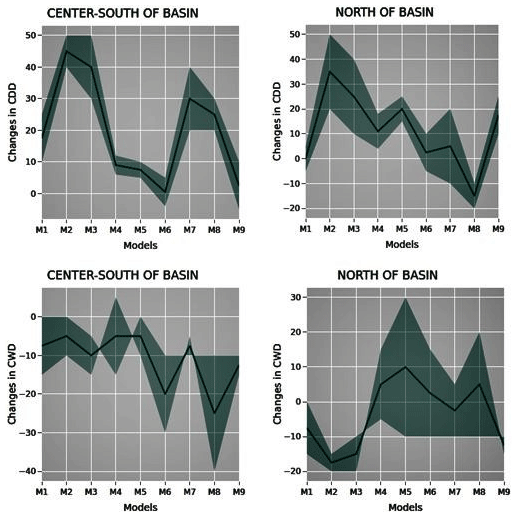
Figure 3Mean consecutive wet days (CWD) and Mean consecutive dry days (CDD) changes between far future (2071–2100) and historical period (1971–2000) during May to September for models: (M1) CNRM-CM5, (M2) MIROC5, (M3) EC-EARTH, (M4) IPSL-CMA5-MR, (M5) MPI-ESM-LR, (M6) GFDL-ESM2M, (M7) NorESM1-M, (M8) CanESM2 and (M9) Models-Mean (ensemble mean of Model).
3.1.2 Precipitation frequency indices
We have analyzed also the maximum duration of the number of consecutive wet days (CWD) and the maximum number of consecutive dry days (CDD) in Fig. 3. The changes relating to the maximum duration of the number of consecutive wet days (CWD) between the far future and the historical period are shown in Fig. 3. The lowest decrease is −40 % and is projected by the model (M8) CanESM2. The highest increase is 32 % and is projected by model (M5) MPI-ESM- LR. Indeed, the projection models used showed a variability of the consecutive wet days on the northern part of the basin from 0 % to −14.5 %, −15 % to −21 %, −10 % to −20 %, −5 % to 15 %, −10 % to 11 %, −10 % to 17 %, −10 % to 5 %, −10 % to 20 % and −10 % to −15 % respectively for models CNRM-CM5 (M1), MIROC5 (M2), EC-EARTH (M3), IPSL-CMA5-MR (M4), MPI-ESM- LR (M5), GFDL-ESM2M (M6), NorESM1-M(M7), CanESM2 (M8) and Mean-models (M9). The southward and center (except models MPI-ESM-LR (M5) and GFDL-ESM2M (M6)), there is a decreasing average in general for the maximum duration of the number of consecutive wet days (CWD), from 0 % to −15 %, 0 % to −10 %, −5 % to −15 %, −15 % to 5 %, 0 % to −10 %, −10 % to −30 % and −10 % to −5 % respectively for models CNRM-CM5 (M1), MIROC5 (M2), EC-EARTH (M3), IPSL-CMA5-MR (M4), NorESM1-M (M7), CanESM2 (M8) and Mean-models (M9). In summary, several models used have announced clearly a decrease the northward of the maximum duration of the number of consecutive wet days (CWD) and over the south and center of the Mono basin. To quantify the potential impact of climate change on future drought events, the change in the number of dry periods was analyzed. A dry period is defined as at least five consecutive days for which the daily precipitation is less than 1 mm. The relative deviations of the maximum duration of dry sequences between the far future and the historical period are represented in the Fig. 3. Contrary to the case of the consecutive wet days (in the same figure), the projection models used show a variability of the consecutive dry days on the northern part of the basin from −5 % to 5 %, 20 % to 50 %, 10 % to 40 %, 4 % to 18 %, 15 % to 25 %, −5 % to 10 %, −10 % to 20 %, −20 % to −10 % and 10 % to 25 %, respectively, for models CNRM-CM5 (M1), MIROC5 (M2), EC-EARTH (M3), IPSL-CMA5-MR (M4), MPI-ESM-LR (M5), GFDL-ESM2M (M6), NorESM1-M (M7), CanESM2 (M8) and Mean-models (M9). The southward and center, models project an increase of the maximum duration of the number of consecutive dry days (CDD), from 10 % to 25 %, 40 % to 50 %, 30 % to 50 %, 6 % to 12 %, 5 % to 10 %, −4 % to 5 %, 20 % to 40 %, 20 % to 30 % and −5 % to 10 %, respectively, for models CNRM-CM5 (M1), MIROC5 (M2), EC-EARTH (M3), IPSL-CMA5-MR (M4), MPI-ESM-LR (M5), GFDL-ESM2M (M6), NorESM1-M (M7), CanESM2 (M8) and Mean-models (M9). The RCMs and their mean in general showed that the maximum number of consecutive rainy days (CWD) will decrease over the Mono basin while the maximum duration of dry sequences will go up.
Other important aspects of daily precipitation characteristics for evaluating climate variability and change impacts is the Max 5 d precipitation and the simple daily intensity index (intensity indices) within the rainy season. The section following is reserved to the analysis of the intensity indices.
3.1.3 Precipitation intensity indices
The relative differences in the number of rainy days during the rainy season (May–June–July–August–September) between the far future and historical period are shown in the Fig. 4. The model MPI-ESM-LR (M5) indicated lowest decrease (mean value −9 %) against the model NorESM1-M (M7) which indicates an increase of the max 5 d precipitation the northward (mean value 20 %). In general, the projection models used showed a variability of the max 5 d precipitation in the north of the basin varying between, −7.5 % and −5 %, −4 % and 4 %, 5 % and 15 %, 5 % and 20 %, −30 % and 10 %, −5 % and 5 %, 0 % and 20 %, 10 % to 15 % and −10 % and 20 %, respectively, for models CNRM-CM5 (M1), MIROC5 (M2), EC-EARTH (M3), IPSL-CMA5-MR (M4), MPI-ESM-LR (M5), GFDL-ESM2M (M6), NorESM1-M (M7), CanESM2 (M8) and Mean-models (M9). The southward models projected also a fluctuation of the max 5 d, between −8.5 % and −7.5 %), −6 % and −2 %, −5 % and 0 %, −5 % and 0 %, −20 % and 10 %, −15 % and −5 %, 0 % and 20 %, 10 % and 15 %, and −10 % and 20 % , respectively, for models CNRM-CM5 (M1), MIROC5 (M2), EC-EARTH (M3), IPSL-CMA5-MR (M4), MPI-ESM-LR (M5), GFDL-ESM2M (M6), NorESM1-M (M7), CanESM2 (M8) and Mean-models (M9). In the center and south, models NorESM1-M (M7) and CanESM2 (M8) show clearly a decrease of the max 5 d, respectively, for, −5 % and −10 %. The RCMs and their mean showed in general that the max 5 d will decrease over the south and center of the Mono basin.
The relative differences in the intensity of rainy days between the far future and the historical period are shown in the Fig. 4. For the results of the variability of the simple daily intensity index, the models have shown dipole structures, as the frequency indices : The projection models used show a variability of the simple daily intensity index in the north of the basin varying between, −6 % and −1 %, −4 % and 3 %, −2 % and 8 %, −16 % to 8 %, −10 % and 10 %, −12 % and 4 %, −15 % and 5 %, −15 % and 5 % and −5 % and 0 % , respectively, for models CNRM-CM5 (M1), MIROC5 (M2), EC-EARTH (M3), IPSL-CMA5-MR (M4), MPI-ESM-LR (M5), GFDL-ESM2M (M6), NorESM1-M (M7), CanESM2 (M8) and Mean-models (M9). The southward models project an increase and decrease of the simple daily intensity index (Fig. 4), from −3 % to −1 %, 0 % to 3 %, −6 % to −2 %, −16 % to −10 %, −2.5 % to 5 %, −12 % to −3 %, −10 % to 5 %, −10 % to 5 % and −15 % to −5 %, respectively, for models CNRM-CM5 (M1), MIROC5 (M2), EC-EARTH (M3), IPSL-CMA5-MR (M4), MPI-ESM-LR (M5), GFDL-ESM2M (M6), NorESM1-M (M7), CanESM2 (M8) and Mean-models (M9). The RCMs and their mean in general showed that the simple daily intensity index will decrease over a big part of the Mono basin during the rainy season (May–June–July–August–September) particularly the southward and in the center.
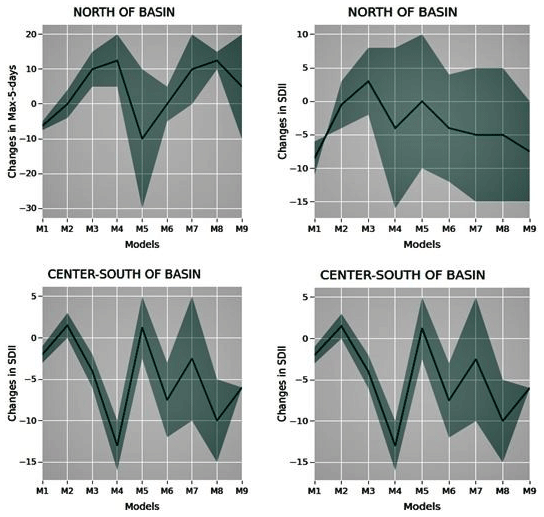
Figure 4Max 5 d precipitation andsimple daily intensity index changes (in %) between far future (2071–2100) and historical period (1971–2000) during May to September for models: (M1) CNRM-CM5, (M2) MIROC5, (M3) EC-EARTH, (M4) IPSL-CMA5-MR, (M5) MPI-ESM-LR, (M6) GFDL-ESM2M, (M7) NorESM1-M, (M8) CanESM2 and (M9) Models-Mean (ensemble mean of Model).
3.1.4 Analysis of inter-annual irregularity
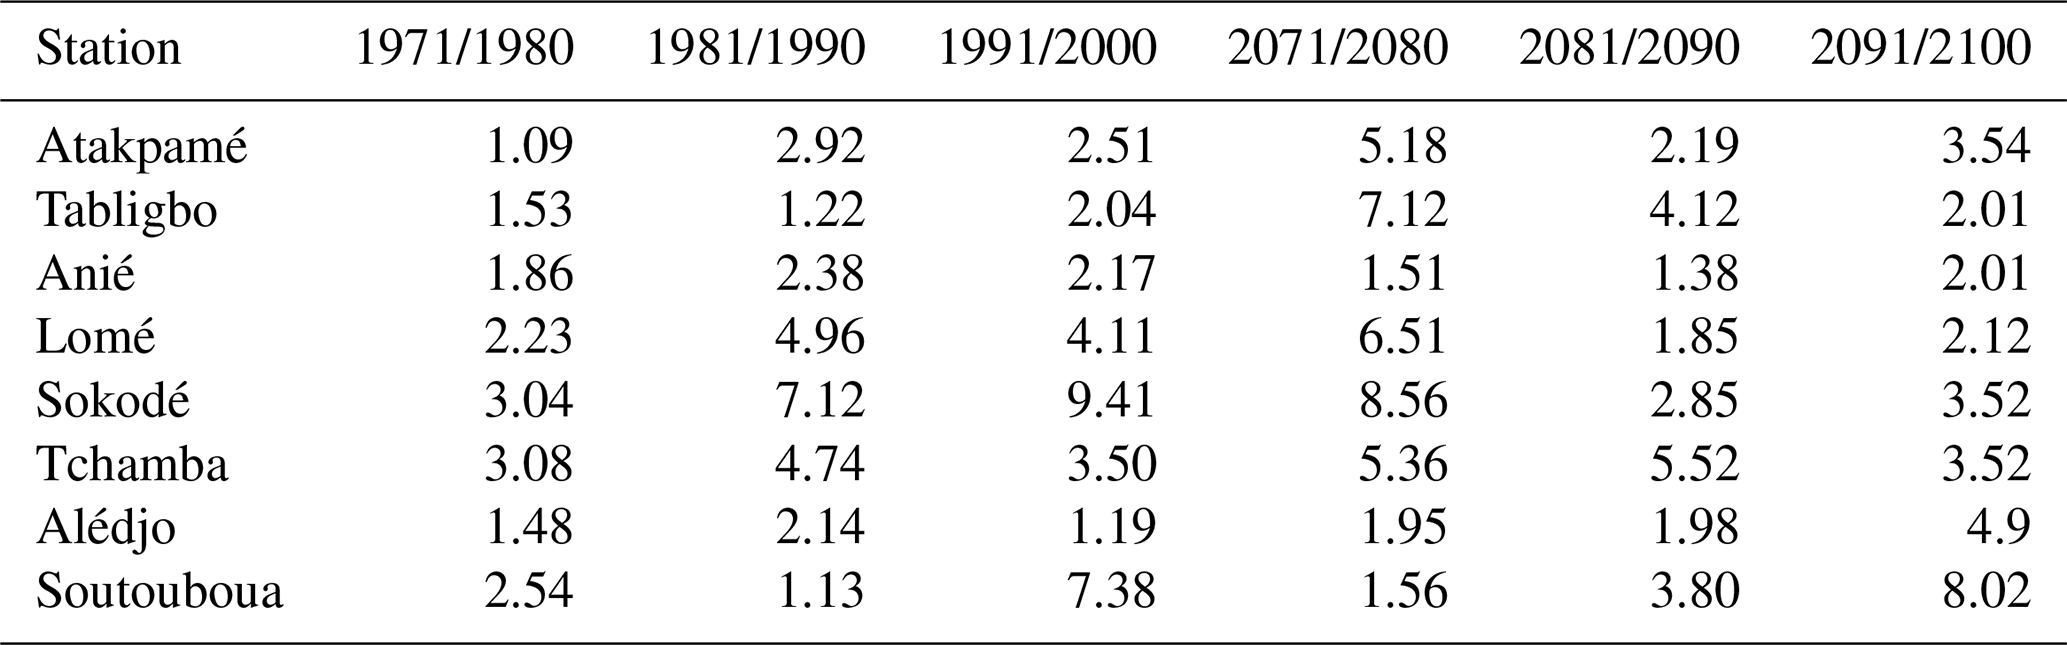
The analysis of the results presented in Table 4 shows that K2 tends to decrease in two stations (Tchamba and Lomé) from 1971–2000, indicating a tendency towards regularity. On the other hand, in the six (6) others, K2 varies by increasing, showing a tendency of increasing the irregularity of the precipitations. For the period 2071–2100, excepted stations Alédjo, Anié, Soutouboua and Lomé, which will be marked by increases but less significant, the other resorts will have to increase to reach 9.41 at Sokodé 7.12 Tabligbo, 5.18 at Atakpamé and 5.52 at Tchamba. Declining mean precipitation heights at all scales and irregular rainy seasons may be associated with a palpable increase in temperatures in the Mono river watershed by 2100.
Table 4Results obtained by calculation of the K2 coefficient of inter-annual rainfall irregularity in the form of table of 1971–2000 and 2071–2100 for the Tabligbo, Atakpamé, Anié, Soutouboua, Sokodé, Tchamba , Alédjo and Lomé stations.
3.2 Discussion
The analysis of extreme weather indices shows that all climate projections indicate an overall increase in extreme temperatures in the Mono catchment. The variations of the rainfall and their indices will depend strongly on emission scenarios and models. Indeed, some models suggested an increase in these indices while others indicated a decrease. To have better comprehension of results of in this paper it is important to look at the results of other regions and countries. The large disparity observed in the evolution of precipitation by 2100 could be due to the type of forcing models or the convection pattern used in West Africa (Sylla et al., 2016). This divergence of models on climate projections on precipitation in West Africa is still uncertain. Yèkambèssoun et al. (2017) estimated that the spatially inconsistent trends of climate indices noticed are likely linked to the high heterogeneousness of the rainfall. Indeed, the Mono basin is characterized by two types of rainfall regimes. In southern basin, there are two rainy seasons which extend from mid-March to mid-July and from mid-August to October. In northern basin, there is one rainy season which extends from April to October. For Nelson et al. (2010), in the future (specifically by 2050), precipitation may rise or fall on average depending on which model we look to. Despite everything, in the Mono basin, several models used agree on an increase in temperature (maximum and minimum) and a decrease of precipitation on a large part of the basin. Nelson et al. (2010) using models GCM (general circulation models), showed that, in the future (specifically by 2050) the temperature is expected to increase between 1 and 2.5 ∘C in Togo. Diallo et al. (2013) pointed out that the decrease in mean rainfall in this area of West Africa could probably be induced in part by a weakening of the moisture from local sources, slowing down the hydrological cycle. Over the Mono basin, our work is also consistent with many works (Tall et al., 2016; Batablinlè et al, 2018; Lamboni et al., 2019a, b), which found a strong decrease in precipitation by 2100 under the RCP8.5 scenario. It is also in line with the recent special IPCC report which
states that West Africa will likely experience longer and more intense droughts in the near future (IPCC, 2013). In general, when considering the number of rainy days and the intensity of rainy days (mostly declining) were coherent with that of rain simulated average on the Mono basin. By consequence, Extreme rains in some areas could lead to some extreme events such as floods and droughts. The analysis of the maximum duration of wet sequences shows a sharp decline in the Mono basin (Batablinlè et al., 2018). Ly et al. (2013) showed a gradual decrease in the maximum duration of the number of wet sequences in West Africa since 1960. Our work shows that such an evolution diagnosed on the present climate is likely to persist in the future. This decrease of the maximum duration of wet sequences in Togo and particularly on the Mono basin appears to be consistent with the evolution of the maximum duration of dry sequences because a sharp decrease in the maximum duration of wet sequences could favor an increase in the maximum length of the dry sequences. This decrease (respectively increase) of the wet sequences (respectively dry sequences) in the Mono basin is a response to global warming (Sylla et al., 2016). In Benin, the work on climate indices made. Yèkambèssoun et al., 2017 showed that only the annual total precipitation, the annual total of wet days and the annual maximum rainfall recorded during 30 d present a significant decreasing trend while the other rainfall indicators appear to remain stable for the period 1960–2000. Likewise rainfall during the months of June to September appears to have witnessed declining trends over 1961–1993 in Nigeria (Oguntundé et al., 2011; Easterling, et al., 2000).
The contribution of our study in the area is the use of several variables (analyzed with several models) based exclusively on precipitation and other parameters (e.g. temperature) to analyze the rainfall season patterns and determine the factors of their temporal variability. The results of this study could enable policy makers to adapt strategies needed for better management of water and natural disasters and the development of a resilient agricultural system in the face of climate change. Since assessments of the impacts of climate change in West-Africa are one of the issues most addressed by the IPCC, the use of multi-models for future extreme temperature and precipitation assessment under the greenhouse gas emission scenario RCP4.5 and RCP8.5 over Mono basin is a promising prospect that would contribute to a better understanding of the potential effects of climate change
A new multi-source dataset is used in this paper to analyze changes in extreme temperature and rainfall events over the Mono basin on the far future (2071–2100) and the historical period (1971–2000). The analysis of these climatic data has contributed to the knowledge of extreme phenomena and their evolution in the future over the Mono basin. These extreme climatic phenomena are very random and highly variable in space and time. Their knowledge is therefore fundamental to protect against natural disasters. The RCMs as well as their average showed that rain will decrease over the Mono basin while temperatures (Maximum and minimum) will increase. Moreover, others climatic indices have also been analyzed in order to characterize these events. In this way, for the simple daily intensity index and five-day maximum rainfall, the models have presented variable structures but the average of the models showed a moderate diminution on almost whole Mono basin except on some parts. The analysis of wet and dry sequences showed that the most of RCMs point out a fairly significant decrease in maximum duration of the number of consecutive rainy days and an increase of the maximum duration of the number of consecutive dry days almost all over the Mono basin. Projections of the RCMs showed that these extreme rain events do not evolve in the same direction as precipitation and this could lead to flooding intense in some parts of Mono basin particularly in the north. Seasonal evolutions were investigated to provide more detail about intra-annual behavior in extreme parameters for the Mono river basin. The results show that declining mean precipitation heights at all scales and irregular rainy seasons may be associated with a palpable increase in temperatures in the Mono river watershed by 2100.
All data can be accessed via the references: The Table 1 presents the data used in this study. It is a set of eight climatic models outputs with daily time step and spatial resolution of 0.44∘ and available at: https://esgf-data.dkrz.de/projects/esgf-dkrz/ (last access: 3 August 2017). The observed data used, are provided by the Togo National Meteorology Agency (Météo Togo). Please, contact the authors if you are interested in this research data.
BL and AEL conceived and designed the research; CM and DLO contributed in providing data; BL performed the research, analyzed the data and wrote the paper.
The authors declare that they have no conflict of interest.
This article is part of the special issue “Hydrological processes and water security in a changing world”. It is a result of the 8th Global FRIEND–Water Conference: Hydrological Processes and Water Security in a Changing World, Beijing, China, 6–9 November 2018.
I acknowledge the financial support from the Deutscher Akademischer Austausch Dienst (DAAD).
All my gratitude to UNESCO-IHP and local organizers who gave me financial support and took charge of my participation in the 8th World Conference on Large River Basins in China. We are also grateful to the anonymous reviewers whose thoughtful and constructive comments have improved the quality of the article.
This research has been supported by UNESCO-IHP.
Aguilar, E., Barry, A. A., Brunet, M., Ekang, L., Fernandes, A., Massoukina, M., and Zhang, X.: Changes in temperature and precipitation extremes in western central Africa, Guinea Conakry, and Zimbabwe, 1955–2006, J. Geophys. Res.-Atmos., 114, 1–11, https://doi.org/10.1029/2008JD011010, 2009.
Batablinlè, L., Lawin, E., and Agnide, C. M.: Africa Cordex Simulations Projection of Future Temperature, Precipitation, Frequency and Intensity Indices Over Mono Basin in West Africa, J. Earth Sci. Clim. Change, 9, 490, https://doi.org/10.4172/2157-7617.1000490, 2018.
Bazyomo, S. D., Ouedraogo, A., and Lawin, E. A.: Seasonal trends solar radiation available at the earth’s surface and implication of future annual power outputs changes on the photovoltaic systems with one and two tracking axes, J. Clim. Weather Forecast., 5, 1–9, 2017.
Bigot, P.: Variability climatic, interaction and modification environnement, Variabilite climatique, Interaction et Modification, Environ. J. Hydrol., 4, 8141, 2003.
Diallo, I. and Camara, M.: Comparaison du climat et de la variabilite interannuelle de la pluie simulée au Sahel par les modèles climatiques regionaux (Comparison of climate and interannual variability of rainfall simulated in the Sahel by regional climate models), 24, 96–106, 2013.
Easterling, D., Evans, J., Groisman, P., Karl T., Kunkel, K., and Ambenye, P.: Observed variability and trends in extreme climate events: A brief review, B. Am. Meteorol. Soc., 81, 417–425, 200.
Emmanuel, L. A., Lamboni, B., Célestin, M., and Hodabalo, K.: Future ExtremesTemperature:Trends and Changes Assessment over the Mono River Basin, Togo (West Africa), J. Water Resour. Protect., 11, 82–98, 2019.
Ernest, A., Yves, T., Totin, H. S. V., Gil, M., and Pierre, C.:Dynamique et modélisation des crues dans le bassin du Mono à Nangbéto (Togo/Bénin), Hydrol. Sci. J., 59, 2060–2071, https://doi.org/10.1080/02626667.2013.871015, 2015.
Gudmundsson, L., Bremnes, J. B., Haugen, J. E., and Engen-Skaugen, T.: Technical Note: Downscaling RCM precipitation to the station scale using statistical transformations – a comparison of methods, Hydrol. Earth Syst. Sci., 16, 3383–3390, https://doi.org/10.5194/hess-16-3383-2012, 2012.
Hulme, M., Doherty, R. M., Ngara, T., New, M. G., and David, L.: African climate change: 1900–2100, Clim. Res, 17, 145–168, https://doi.org/10.3354/cr017145, 2001.
IPCC: Climate Change 2013: The Physical Science Basis, Contribution of WorkingGroup I to the Fifth Assessment Report of the Intergovernmental Panel on Climate Change, edited by: Stocker, T. F., Qin, D., Plattner, G.-K., Tignor, M., Allen, S. K., Boschung, J., Nauels, A., Xia, Y., Bex, V., and Midgley, P. M., Cambridge University Press, Cambridge, United Kingdomand New York, NY, USA, 2013.
Lamboni, B., Emmanuel, L. A., and Manirakiza, C.: Future extremes Temperature and Rainfall: Trends and Changes Assessment over Mono Basin in WEST AFRICA, XXXII Colloque l'Association Internationale de Climatologie; Climatic Change, Variability and Climate Risks, Thessaloniki Greece, 9–14, 2019a.
Lamboni, B., Emmanuel, L. A., Manirakiza, C., and Djibib, Z. M.: Variability ofFuture Rainfall over the Mono River Basin of West-Africa, Am. J. Clim. Change , 8, 137–155, https://doi.org/10.4236/ajcc.2019.81008, 2019b.
Ly, M., Traoré, S. B., Alhassane, A., and Sarr, B.: Evolution of Some Observed Climate Extremes in the West African Sahel, Weather Clim. Ext., 1, 19–25, 2013.
Mason, S., Waylen, P., Mimmack, G., Rajaratnam, B., and Harrison, J.: Changes in extreme rainfall events in South Africa, Climatic Change, 41, 249–257, 1999.
MERF: Plan d'action national d'adaptation aux changements climatiques (PANA), (National Action Plan for Adaptation to Climate Change ), Lomé, Republic of Togo, 27–134, 2009.
Nelson, G. C., Rosegrant, M., Palazzo, A., Gray, I., Ingersoll, C., and Robertson, R.: Food Security, Farming, and Climate Change to 2050: Scenarios, Results, Policy Options, Washington, 2010.
Nicholson, S. E. and Webster, P. J.: Physical basis for the interannual variability of rainfall in the Sahel, Q. J. R. Meteorol. Soc., 133, 2065–2084, 2007.
Oguntundé, P., Abiodunb, B., and Lischeid, G.: Rainfall trends in Nigeria, 1901–2000, J. Hydrol, 411, 207–218, 2011.
Ozer, P., Hountondji, Y., and Laminou Manzo, O.: Evolution des caractéristiques pluviométriques dans l'est du Niger de 1940 à 2007, Evolution of rainfall characteristics in eastern Niger from 1940 to 2007, GEO-ECO-Trop, 33, 11–30, 2009.
Sarr, A. B. and Camara, M.: Projections Climatiques Sur Le Sénégal, Europ. Sci. J., 13, 206–222, https://doi.org/10.19044/esj.2017.v13n17p206, 2017.
Soro, G. E., Anouman, D., Goula Bi, T. A., and Srohorou, B.: Characterization of sequences of meteorological dryness at various time scales in Sudanese climate: case of the extreme northwest of the Ivory Coast, Larhyss J., 18, 107–124, 2014.
Sylla, M. B., Elguindi, N., and Giorgi, F. W. D.: Projected robust shift of climate zones over West Africa in response to anthropogenic climate change for the late 21st century, Climatic Change, 134, 241–253, https://doi.org/10.1007/s10584-015-1522-z, 2016.
Tall, M., Sylla, M. B., Diallo, I., Pal, J. S., Mbaye, M. L., and Amadou, T. G.: Projected impact of climate change in the hydroclimatology of Senegal with a focus over the Lake of Guiers for the 21st century, Theor. Appl. Climatol., 129, 655–665, https://doi.org/10.1007/s00704-016-1805-y, 2016.
Yèkambèssoun, N. O., Emmanuel, A. L., André, A., Benjamin, K. Y., Ganiyu, T. O., and Abel, A. A.: Decreasing past and mid-century rainfall indices over the ouémé river basin, benin (West Africa), Climate, 5, 1–28, 2017