the Creative Commons Attribution 4.0 License.
the Creative Commons Attribution 4.0 License.
 | 16 Sep 2020
Changing climate and implications for water use in the Hetao Basin, Yellow River, China
Ian White
Tingbao Xu
Jicai Zeng
Jian Yu
Xin Ma
Jinzhong Yang
Zailin Huo
Hang Chen
Balancing water allocations in river basins between upstream irrigated agriculture and downstream cities, industry and environments is a global challenge. The effects of changing allocations are exemplified in the arid Hetao Irrigation District on the Yellow River, one of China's three largest irrigation districts. Amongst the many challenges there, the impact of changing climate on future irrigation water demand is an underlying concern. In this paper we analyse trends in local climate data from the late 1950s and consider the implications for irrigation in the Basin. Since 1958, daily minimum temperatures, Tmin in the Basin have increased at three times the rate of daily maximum temperatures, Tmax. Despite this, there has been no significant increases in annual precipitation, P or pan evaporation, Epan. The difference between the increasing trends in Tmax and Tmin means that the average annual diurnal temperature range, DTR, has decreased very significantly, part of a global phenomenon. Hargreaves empirical approach is used to estimate changes in both incoming solar radiation, Rs, and potential evaporation, ET0. Changes in estimated ET0 correlated well with changes in measured pan evaporation, Epan. Paradoxically, the estimated decreasing trend in Rs does not correspond to a significant decreasing trend in Epan. Implications of changing climate on water use and soil salinity in the Basin are discussed.
- Article
(3960 KB) - Full-text XML
- BibTeX
- EndNote


The world-wide challenge of allocating water fairly between competing upstream and downstream users and the environment is exemplified in the Yellow River, the so-called “cradle of civilization” in China (Xu et al., 2005). The challenge is compounded when upstream uses include vital irrigated food production systems. The 10 000 km2 Hetao Irrigation District on the northern side of the Ordos loop of the Yellow River is one of China's three largest irrigation areas. This arid, cold region (Peel et al., 2007) in Inner Mongolia has been farmed for 2300 years, since the Qin dynasty. It is an important source of grains, oil seeds, sugar, fruits, vegetables and poultry.
Increasing water abstractions from the Yellow River for irrigation, downstream demands from rapidly expanding industrial and urban developments, obligatory environmental flows, coupled to channel elevation changes due to sediment deposition have all severely stressed the river system (Xu et al., 2005; Tang et al., 2008; Lehane, 2015). In response the Yellow River Water Conservancy Commission mandated a 15 % reduction in irrigation supply to Hetao to be phased in over time with a reduced supply target of 4.0 km3 yr−1 for the Hetao District.
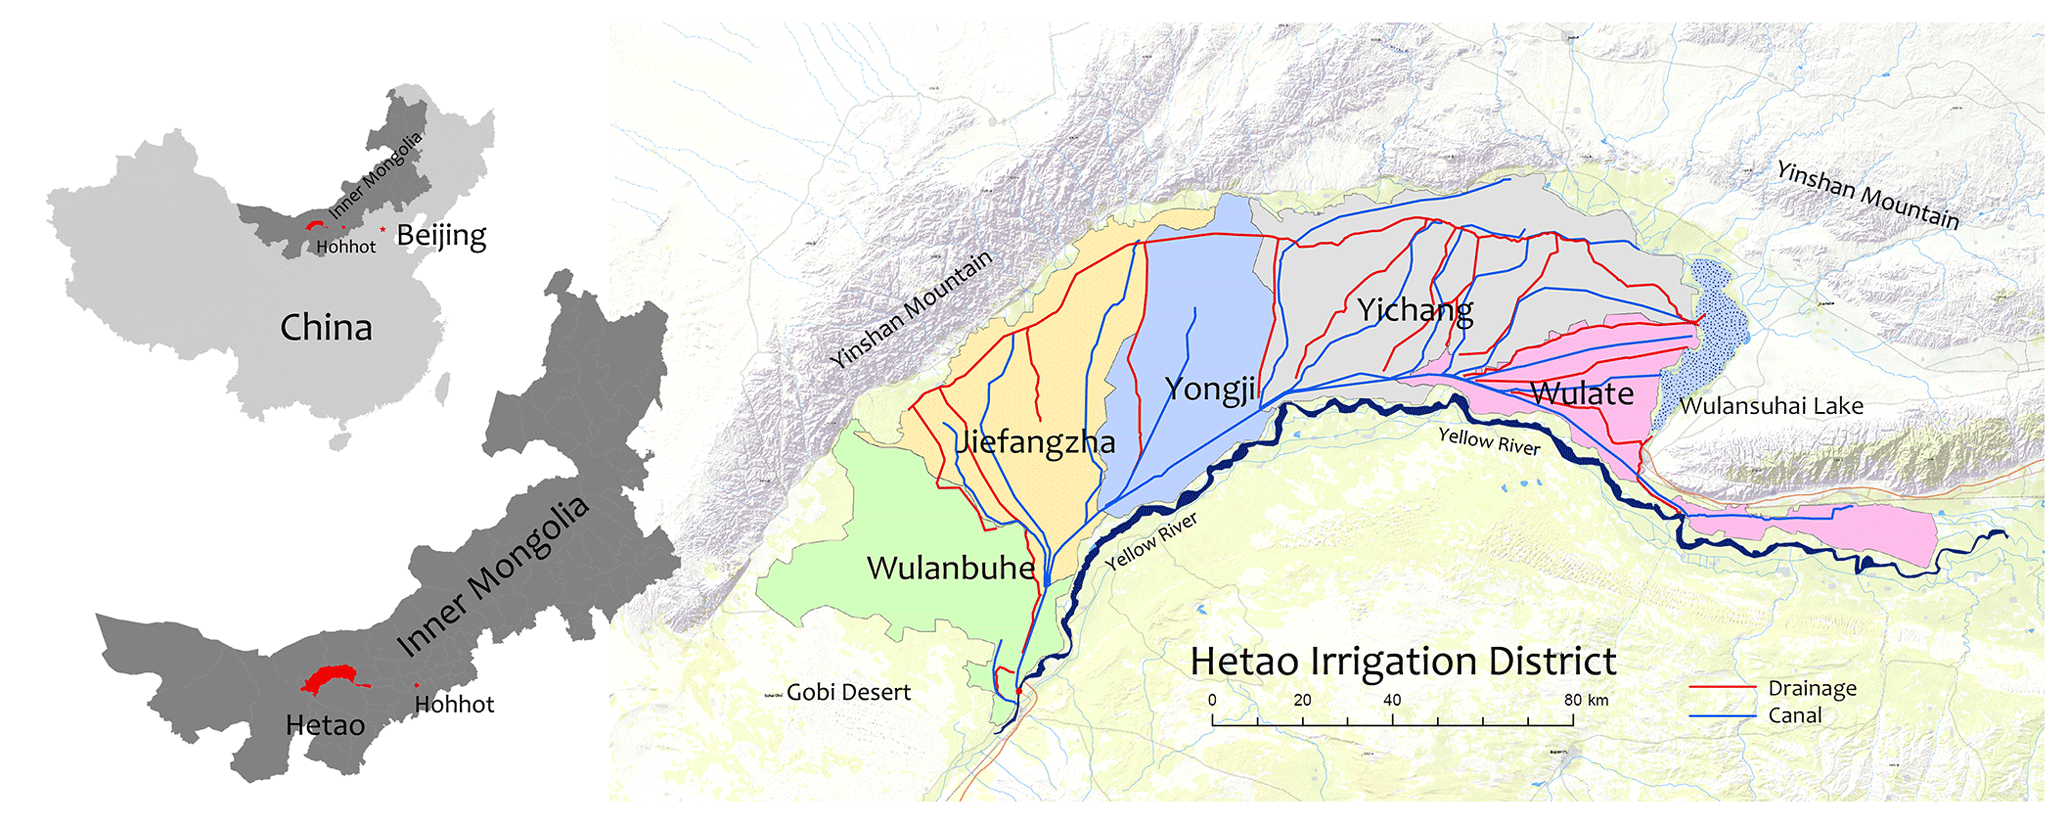
Figure 1The Hetao Irrigation District Inner Mongolia, showing the five irrigation sub-districts.
Recent research in Hetao has focussed on reducing water use while maintaining or increasing productivity (e.g. IWC-IM, 1999; Xu et al., 2010; Xue and Ren, 2017). Air temperatures have increased at a significant rate in northern and western China (Tang et al., 2010) and the impacts of climate change on irrigation water demand is a continuing concern for both regulators and irrigators. In this work we analyse trends in local measured climate parameters across Hetao, relate them to physical mechanisms and consider the implications of the already observed climate changes on irrigation water demand and salinity management.
2.1 Hetao irrigation district
The general features of the flat, bow-shaped, approximately 200 km long by 50 km wide Hetao Irrigation District are in Fig. 1 and listed in Table 1. The District is bounded to the west by the Gobi Desert, to the north by the western portion of the Yinshan Mountains and by the Yellow River in the south. This region of northern China has experienced significant increasing trends in maximum and temperatures over the past 60 years (Fig. 2). From April until early November, water is diverted from the Yellow River at Dengkou on the southwestern edge of the region and distributed throughout the District by a series of multi-level canals. Drainage discharges into Wulansuhai Lake in the eastern edge of the region.
Table 1Characteristics of the Hetao Irrigation District.
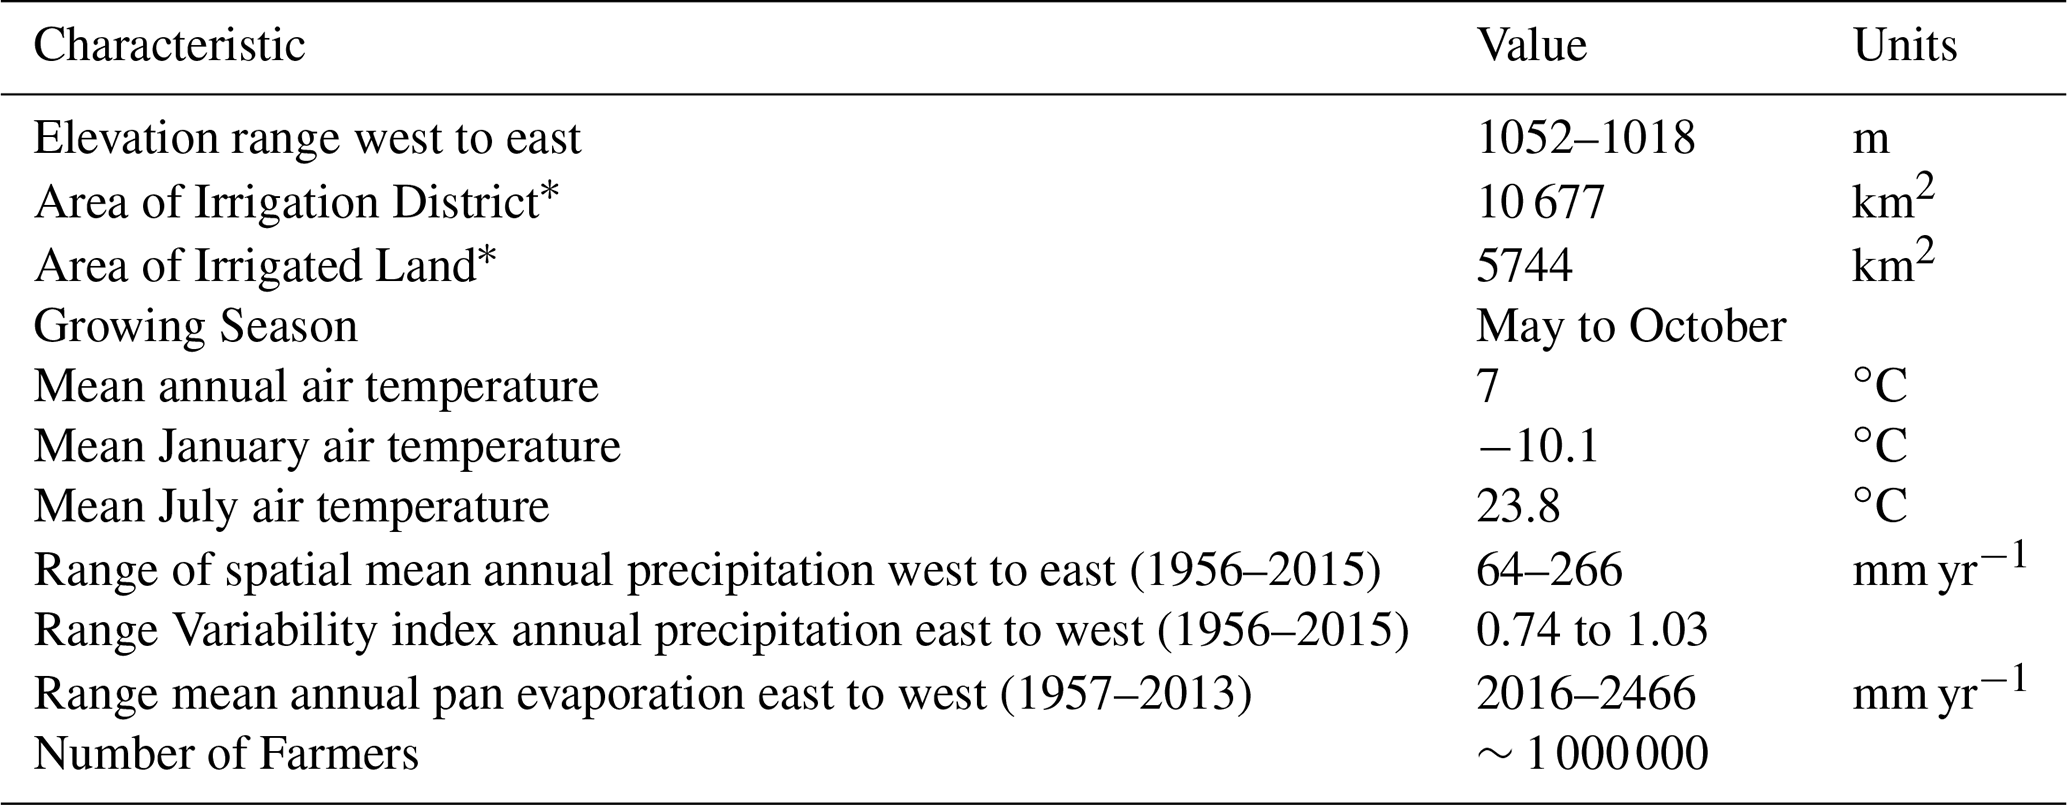
* Yang (2005).

Figure 2Trends in spatially interpolated (a) mean daily maximum and (b) minimum temperatures (∘C/100 years) in China between 1956 and 2015.
The Basin is divided into five sub-districts: Yigan (previously called Wulanbuhe), Jiefangzha, Yongji, Yichang and Wulate comprising 19.2 %, 20.7 %, 16.2 %, 30 % and 13.9 % of the total area of the District. Annual pan evaporation, Epan across the District, far exceeds annual precipitation and the variability of annual rainfall decreases with increasing rainfall across the District from west to east as does Epan (Table 1).
2.2 Sources of data
This study used data drawn from a range of disparate and scattered sources collected by different organisations over diverse time periods (Table 2).

2.2.1 Basin climate
Monthly precipitation data was available from five available stations, each within one of the five irrigation sub-districts (Table 3). Monthly Epan data was available for this study from the Yongii and Wulate stations in Table 3 for the period 1957 to 2013 together with daily maximum and minimum temperatures, Tmax and Tmin, from 1957 and 1954, respectively, to 2013. Mean monthly precipitation peaks in July and August. Because of this, mean pan evaporation peaks earlier in May but mean temperature peaks in July. On average mean atmospheric temperatures are at or below zero for 5 months of the year.
Table 3The five climate stations used to assess precipitation across Hetao (west to east) for the period 1957 to 2013.

2.2.2 Temporal trends in climate data
Trends in annual temperature, DTR, precipitation, and pan evaporation, irrigation supply, specific irrigation drainage, and groundwater and drainage salinity were determined using linear regression (LR). Trends were considered not significant when the probability, p, was less than 0.9. Because of the sensitivity of linear regression trends to start and end values of a series, weaker trends (p<0.95) were also tested using the nonparametric (NP) Theil–Sen slope estimator (Theil, 1950). The significance of nonparametric trends was determined using the Mann–Kendall test (Kendall, 1970).
2.2.3 DTR and incoming solar radiation, Rs
The daily DTR (∘C) is defined as:
FAO-56 (Allen et al., 1998) pointed out that DTR can be used as an indicator of the fraction of extra-terrestrial radiation, Ra (MJ m−2 d−1), that reaches the earth's surface. Hargreaves and Samani (1982) (see also Hargreaves and Allen, 2003) proposed that the ratio of incoming solar radiation incident on the earth's surface, Rs (MJ m−2 d−1), to Ra can be approximated by the empirical relation:
where (∘C−0.5) is an empirical adjustment coefficient (0.16 for interior regions, 0.19 for coastal regions).
Using estimates of mid-monthly Ra from FAO-56 and the latitude of the stations in Table 3, together with (∘C−0.5) in Eq. (2) and DTR data, temporal changes in the annual incoming solar radiation to Hetao can be estimated.
Good daily Tmax and Tmin data are available from 1958 to 2013 for two sites, Yongii and Wulate in the Hetao Basin listed in Table 3.
2.2.4 DTR and potential evaporation, ET0
Temperature is not the main driver of ET0. In the Penman–Monteith approach, ET0 can be expressed as (FAO-56, Allen et al., 1998):
In Eq. (3), C1, C2 are factors which depend weakly on temperature, pressure and crop characteristics, α the surface albedo, Rnl the net outgoing long wave radiation, G the soil heat flux, u the wind speed and Δe the water vapour pressure deficit. The first term in Eq. (3) represents the key contribution of Rs to ET0, the second term represents the “drying power of the air”. For arid locations, such as Hetao, the “drying power of the air” is expected to contribute significantly to ET0, although evaporation of surrounding irrigation water may confound this locally.
For Hetao, available long-term data necessary to fully evaluate trends in ET0 via the Penman–Monteith approach is not readily available. FAO-56 suggest that the approach developed by Hargreaves (Hargreaves and Samani, 1982, 1985; Hargreaves, 1994), based on daily Tmax and Tmin give useful estimates of ET0, particularly over periods longer than 5 d:
with .
Using Eq. (2), Eq. (4) can be written in terms of Rs as:
FAO-56 noted that the 1985 Hargreaves' method, Eq. (4), “has shown reasonable ET0 results with global validity”. Hargreaves and Allen (2003) did an extensive evaluation of Eq. (4) over a very wide range of global locations against the FAO-56 Penman Monteith method and concluded that: “Where equipment cost is a consideration, where data quality is questionable, or where historical data are missing, both the reduced set FAO-PM or the 1985 Hargreaves are recommended, since the two methods are surprisingly equivalent over a wide range of climates.” Use over 5 d or longer is recommended because of the influence of moving weather fronts, and large variations of wind speed and cloud cover at daily time steps.
Equation (4) appears to compensate for the lack of Rn, humidity and wind speed data required by the Penman–Monteith method. The diurnal temperature range in the equation implicitly accounts for the influence of cloudiness because DTR decreases with increasing cloudiness. As well, it has been shown that DTR correlates with relative humidity and vapor pressure deficit and is inversely influenced by wind run (Hargreaves and Allen, 2003). Hargreaves and Allen (2003) recommend that Eq. (4) should be calibrated against Penman–Monteith combination equations to produce a regionally calibrated relationship.
The temporal trend in ET0 with time follows from Eq. (5),
Whether estimated ET0 will increase or decrease with time will depend on the relative magnitude of the two terms and in Eq. (6) which may be of opposite sign.
3.1 Temperature
The trends in annual mean daily Tmax and Tmin at Yongii and Wulate over the period 1958 to 2013 were identical. As a result, the area-averaged mean temperature is used here as representative of the Hetao Basin. Figure 3 plots the average annual mean daily Tmax and Tmin average and annual mean daily precipitation, pan evaporation and temperature as a function of time. Table 4 shows that both increasing temperature trends were highly significant with Tmin increasing almost three times the rate of Tmax.
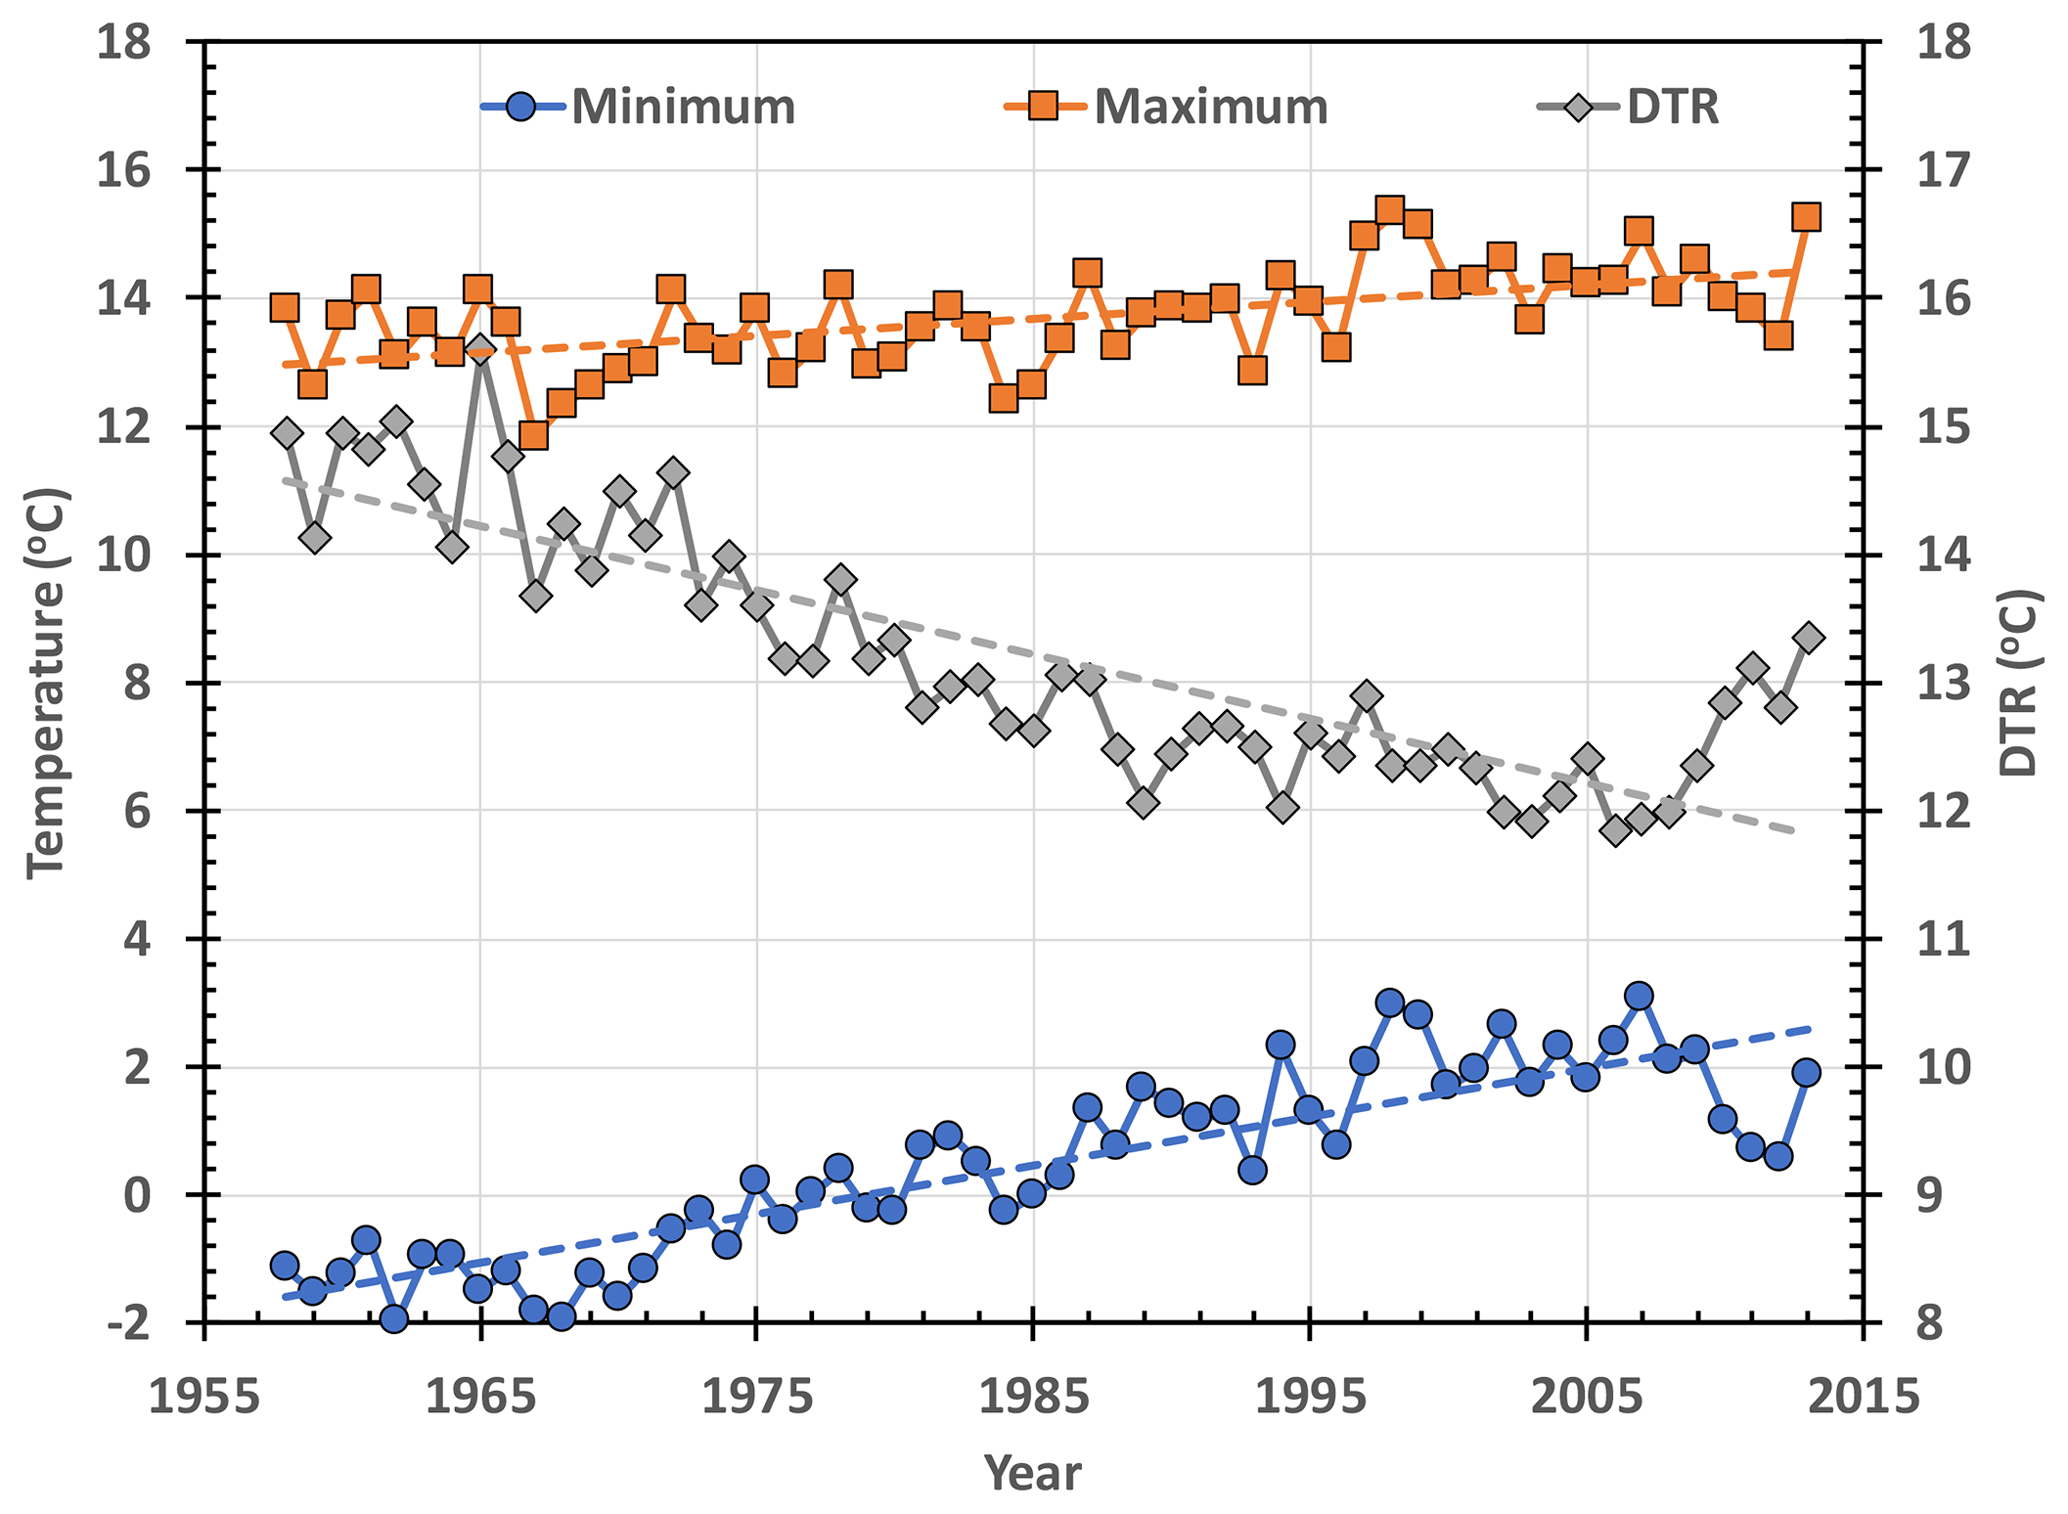
Figure 3Increasing significant trends in the area-averaged annual mean daily maximum and minimum temperatures combined from the two stations, Yongii and Wulate in Table 3 and the decreasing significant trend in mean DTR for the period 1958 to 2013.
Table 4Increasing trends in the average annual daily maximum, mean and minimum temperatures and DTR in Hetao for the period 1958 to 2013.

Analysis of monthly mean daily temperature data in Hetao shows that Tmin in all months of the year have increased very significantly and are also increasing at a greater rate than monthly Tmax. Figure 4 shows the change in the distribution of measured monthly minimum temperatures with time in Hetao as well as the projected temperature distribution for 2050 using the highly significant monthly increasing trends. Because the distribution of monthly temperatures depends on precipitation, the years chosen in Fig. 4 were selected because they had similar annual precipitations, (1960: P=155 mm; 1991: P=151 mm; 2006; P=156 mm; with the projected precipitation for 2050 of 157 mm).

Figure 4Change in the distribution of area-averaged monthly minimum temperatures in Hetao. Values for 1960, 1991 and 2006 are actual measured distributions from years with similar annual precipitation and that for 2050 is projected from monthly trends.
Figure 4 demonstrates that by 2006, the period over which the minimum temperature in Hetao was below zero had decreased by almost 2 months relative to that for 1960 so that the length of the growing season in Hetao is expanding due to increasing minimum temperatures. This also suggests that the depth to which the soil is frozen and the length of time it is frozen for has decreased. This may have implications for salt flushing from topsoil.
3.2 Annual precipitation and Epan
Area-weighted average annual precipitation for the Basin between 1957 and 2013 is plotted in Fig. 5. The large variations in annual rainfall over the period 1957 to 2013, from 64 to 288 mm yr−1, are apparent. The small trend, 0.3±4.3 mm per decade, however, is not significant (p<0.9).
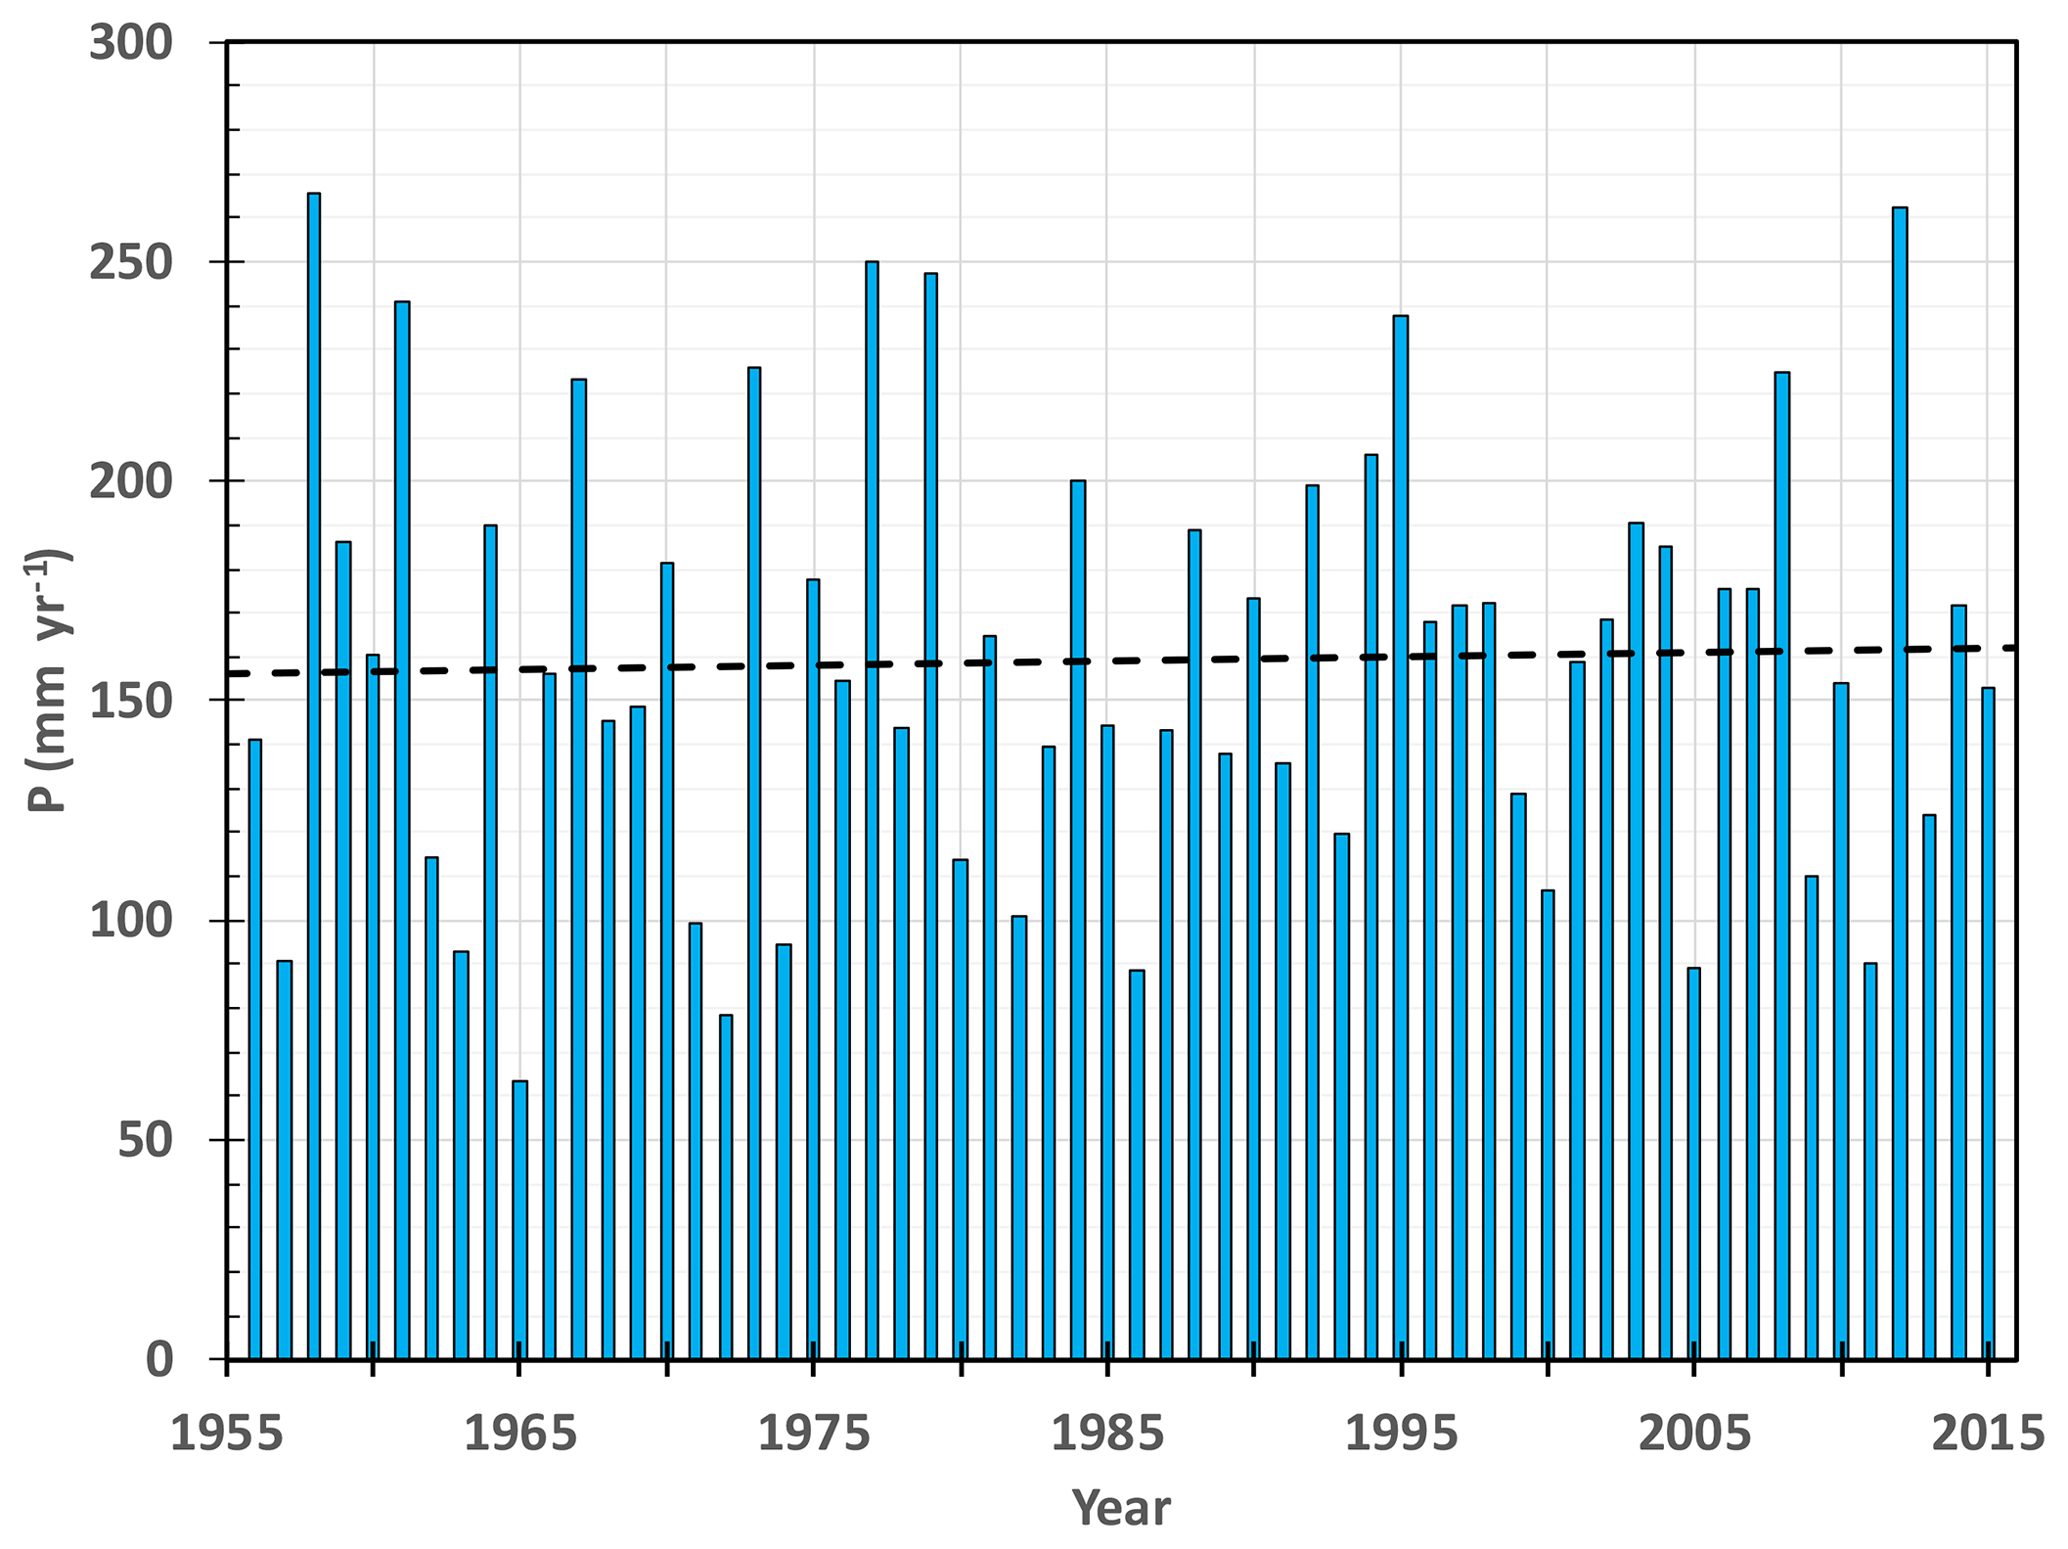
Figure 5Areal-averaged annual precipitation of the Hetao Basin, 1957 to 2013. The linear trend is not significant.
The area-averaged Epan for Hetao, between 1957 and 2013 is plotted in Fig. 6. An increasing linear regression trend of mm per decade can be seen. NP analysis gave a similar trend of +15 mm/ per decade. For both analyses, however, the trends were not significant (p<0.9). So, the highly significant increasing annual maximum and minimum temperatures in Hetao are not associated with any significant increases in annual precipitation or annual pan evaporation between 1957 and 2013.
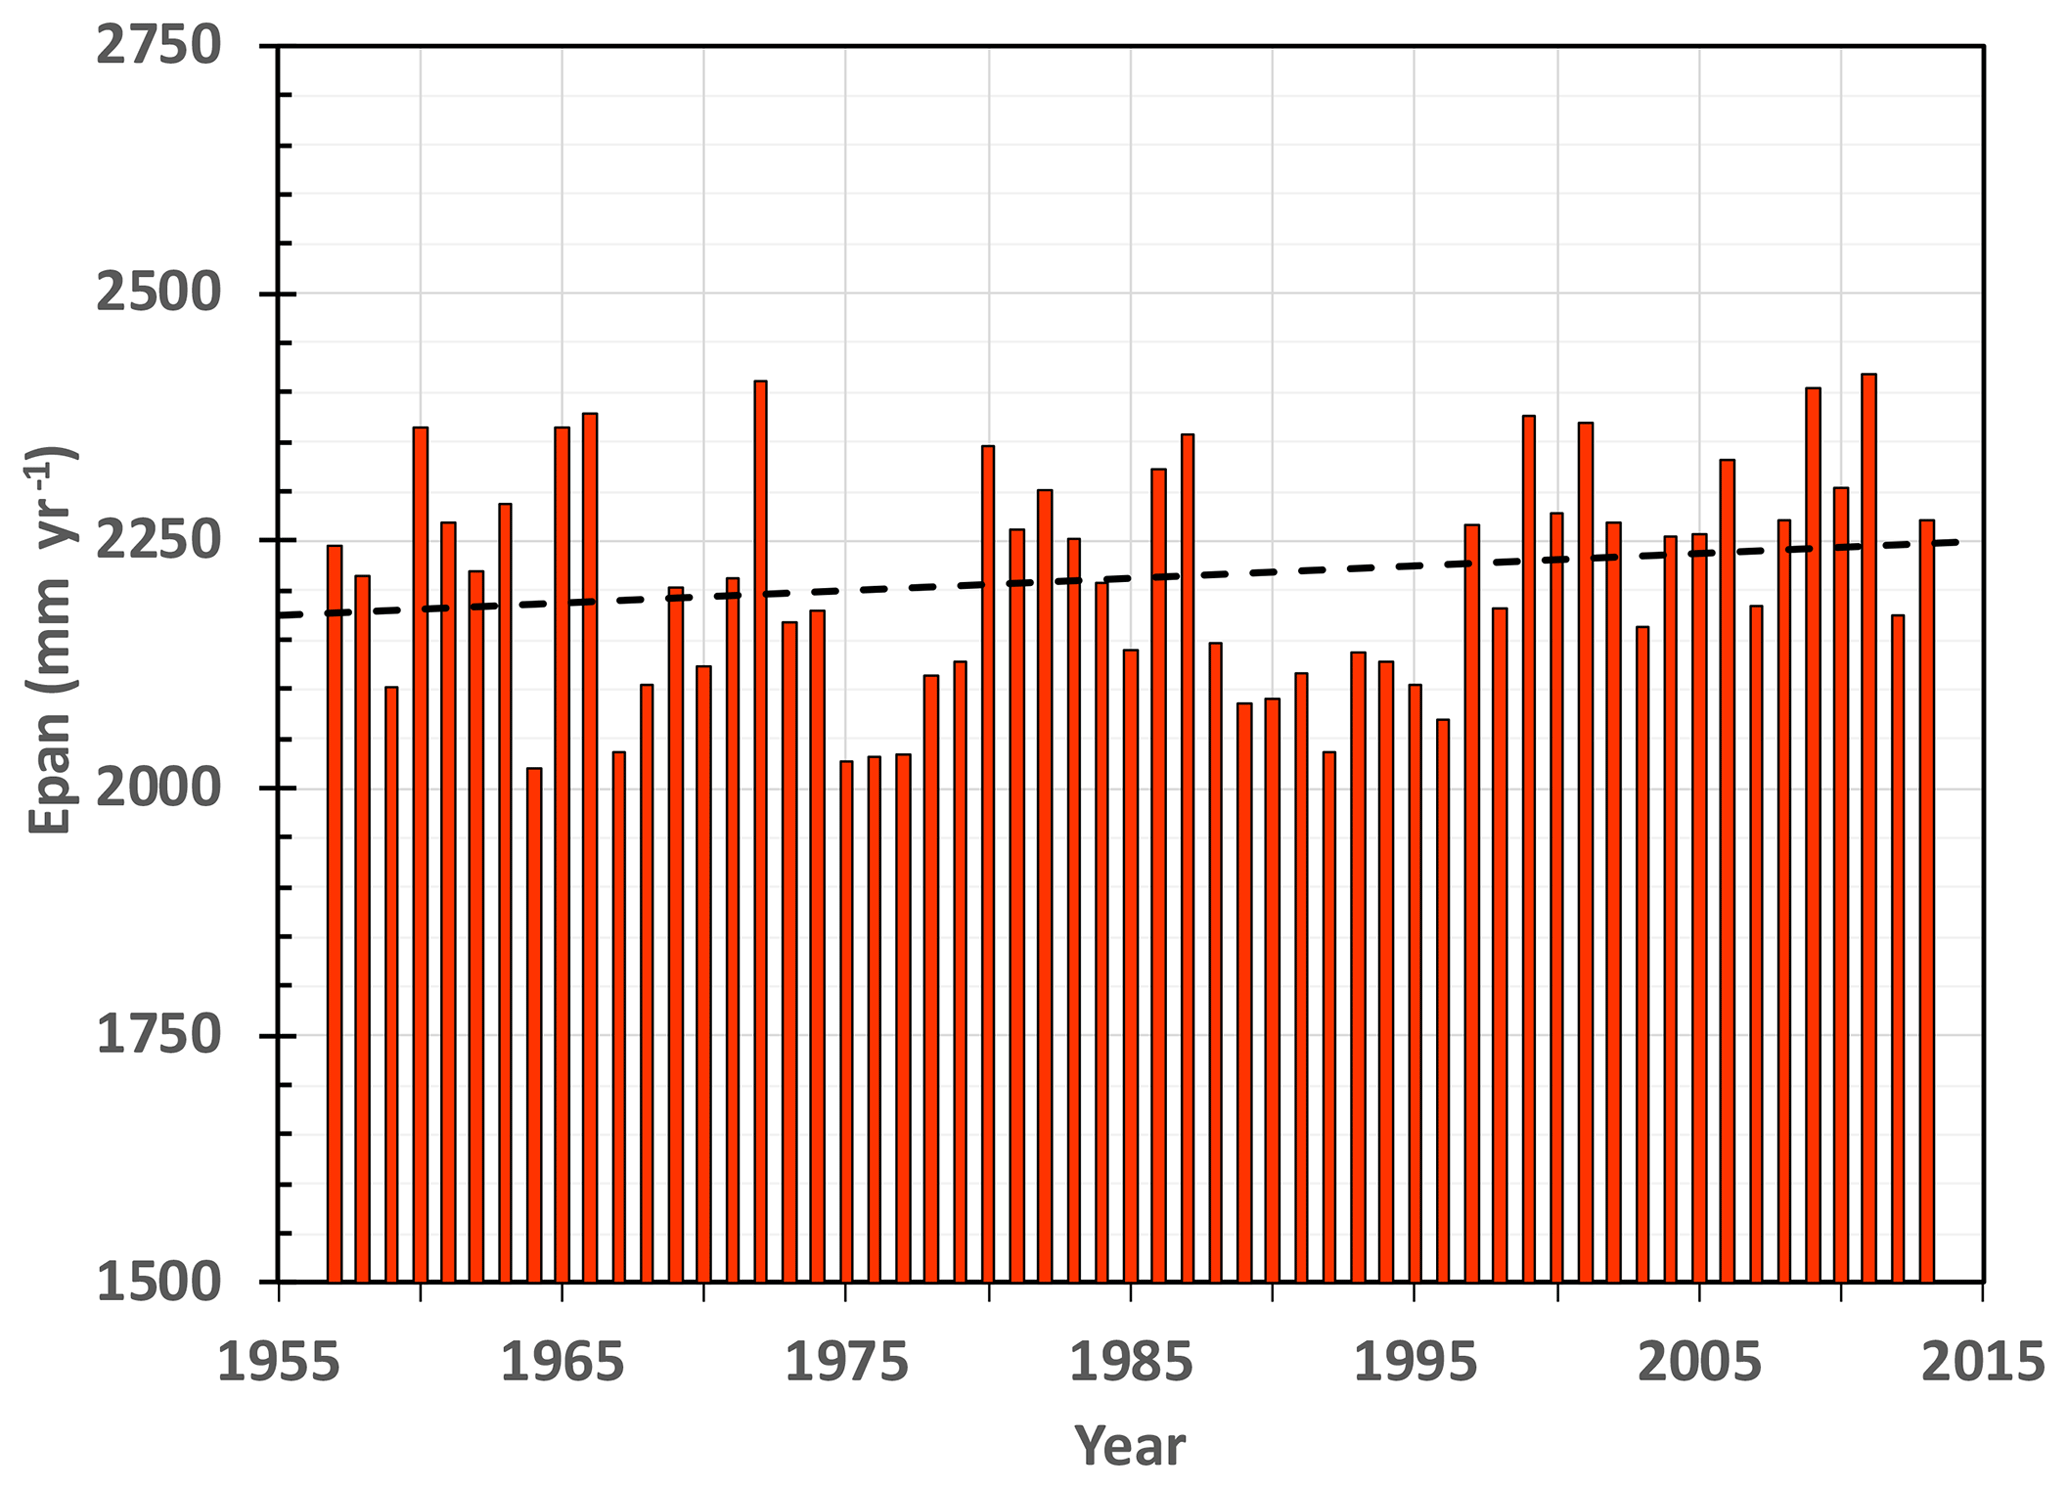
Figure 6Area-averaged pan evaporation for the Hetao Basin, 1957 to 2013. The linear trend is not significant.
3.3 Trends in DTR
Because Tmin increased at three times the rate of Tmax, DTR decreased significantly (Fig. 3) at −0.49 ∘C per decade over the period 1958–2013. This is the same absolute rate as annual mean daily temperature is increasing (Table 4).
Analyse of the data revealed that between 1958 and 1985, DTR decreased at faster rate, ∘C per decade (p>0.9999) than the full period 1958 to 2013. Between 1985 to 2013, however, the trend ∘C per decade was not significant (p<0.9). This change in trend is consistent with regionally-averaged northern hemisphere data where DTR was found to decrease significantly from 1950 to the late 1970's. Between 1979 and 2004, however there was no significant trend in DTR (Vose et al., 2005). This appears to coincide with a fundamental shift in the El Niño–Southern Oscillation phenomenon (Easterling et al., 1997).
3.3.1 Decreasing DTR and changes in Rs
Equation (2) was used to estimate temporal changes in Rs using the DTR data using the method of Hargreaves and Samani (1982). The results are given in Fig. 7 which suggests the annual incoming solar radiation to Hetao decreased at a rate of MJ m−2 per decade (p>0.9999) between 1958 and 2014, or 9 % over 50 years. This is close to the 10 % to 20 % reduction reported in many places over the same period (Stanhill and Cohen, 2001). This global phenomenon is attributed by some to global “dimming” (a decrease in net radiation due to increased cloudiness or aerosols) (Easterling et al., 1997; Vose et al., 2005). It is noted in Fig. 7, however, that from about 2009 onwards, there appears to have been an increase in annual Rs.
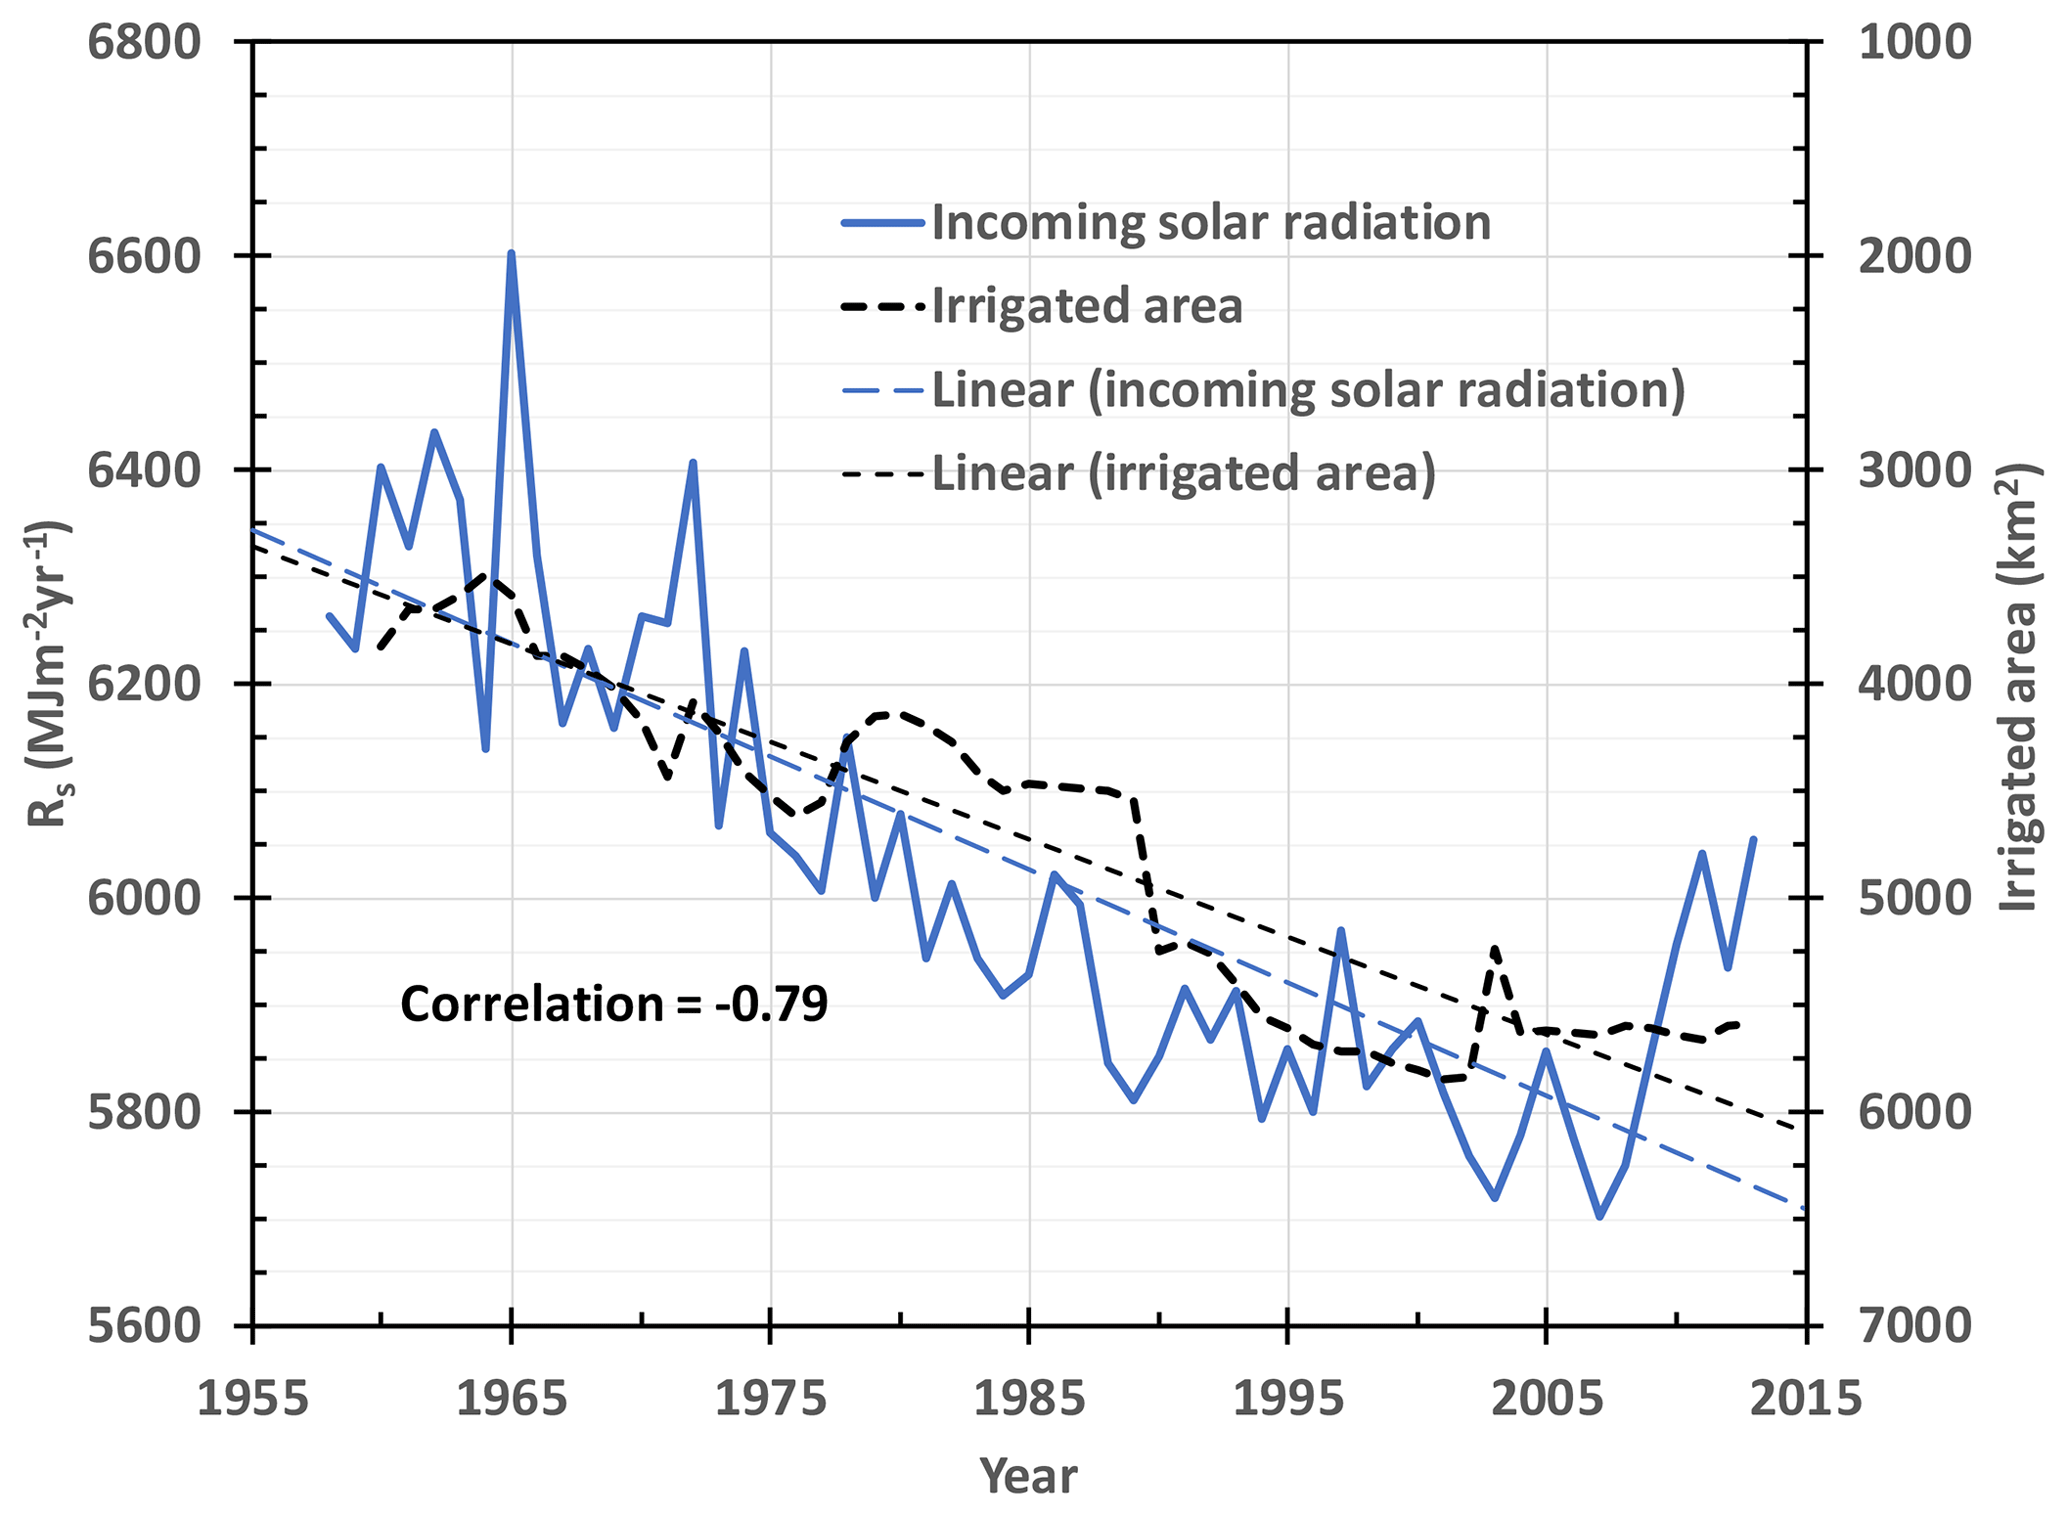
Figure 7Estimated temporal change of incoming solar radiation to Hetao from 1958 to 2013 using Eq. (2). Also shown is the change in area of land irrigated (plotted in reverse order) and significant linear trends.
The overall decrease in estimated Rs cannot be attributed to increasing cloudiness due to increasing annual precipitation, since, as shown above, annual precipitation in Hetao has not increased significantly between 1957 and 2013. The correlation between estimated annual Rs and annual precipitation, P is weakly significant (p>0.9) with MJ m−2 mm−1. This correlation between Rs and P appears to be mainly due to a correlation with fluctuations around the decreasing trend in Rs Some of the fluctuations of Rs about the trend line in Fig. 7 may be caused by annual changes in cloud cover associated with annual variations in precipitation.
From Eq. (3) it is expected that the decrease in incoming solar radiation in Fig. 7 associated with a decrease in potential evaporation in Hetao. We next examine that proposition.
3.3.2 DTR and ET0
In discussing Eq. (6) above it was noted that any trend in ET0 will depend on the terms and . In Hetao, (Table 4) but (Fig. 7), so depending on their relative magnitudes, ET0 could increase, decrease or remain constant with time.
Monthly values of ET0 were estimated from Eq. (5) which were summed to give an estimate of annual ET0. The estimated change of ET0 between 1958 and 2013 is plotted in Fig. 8.
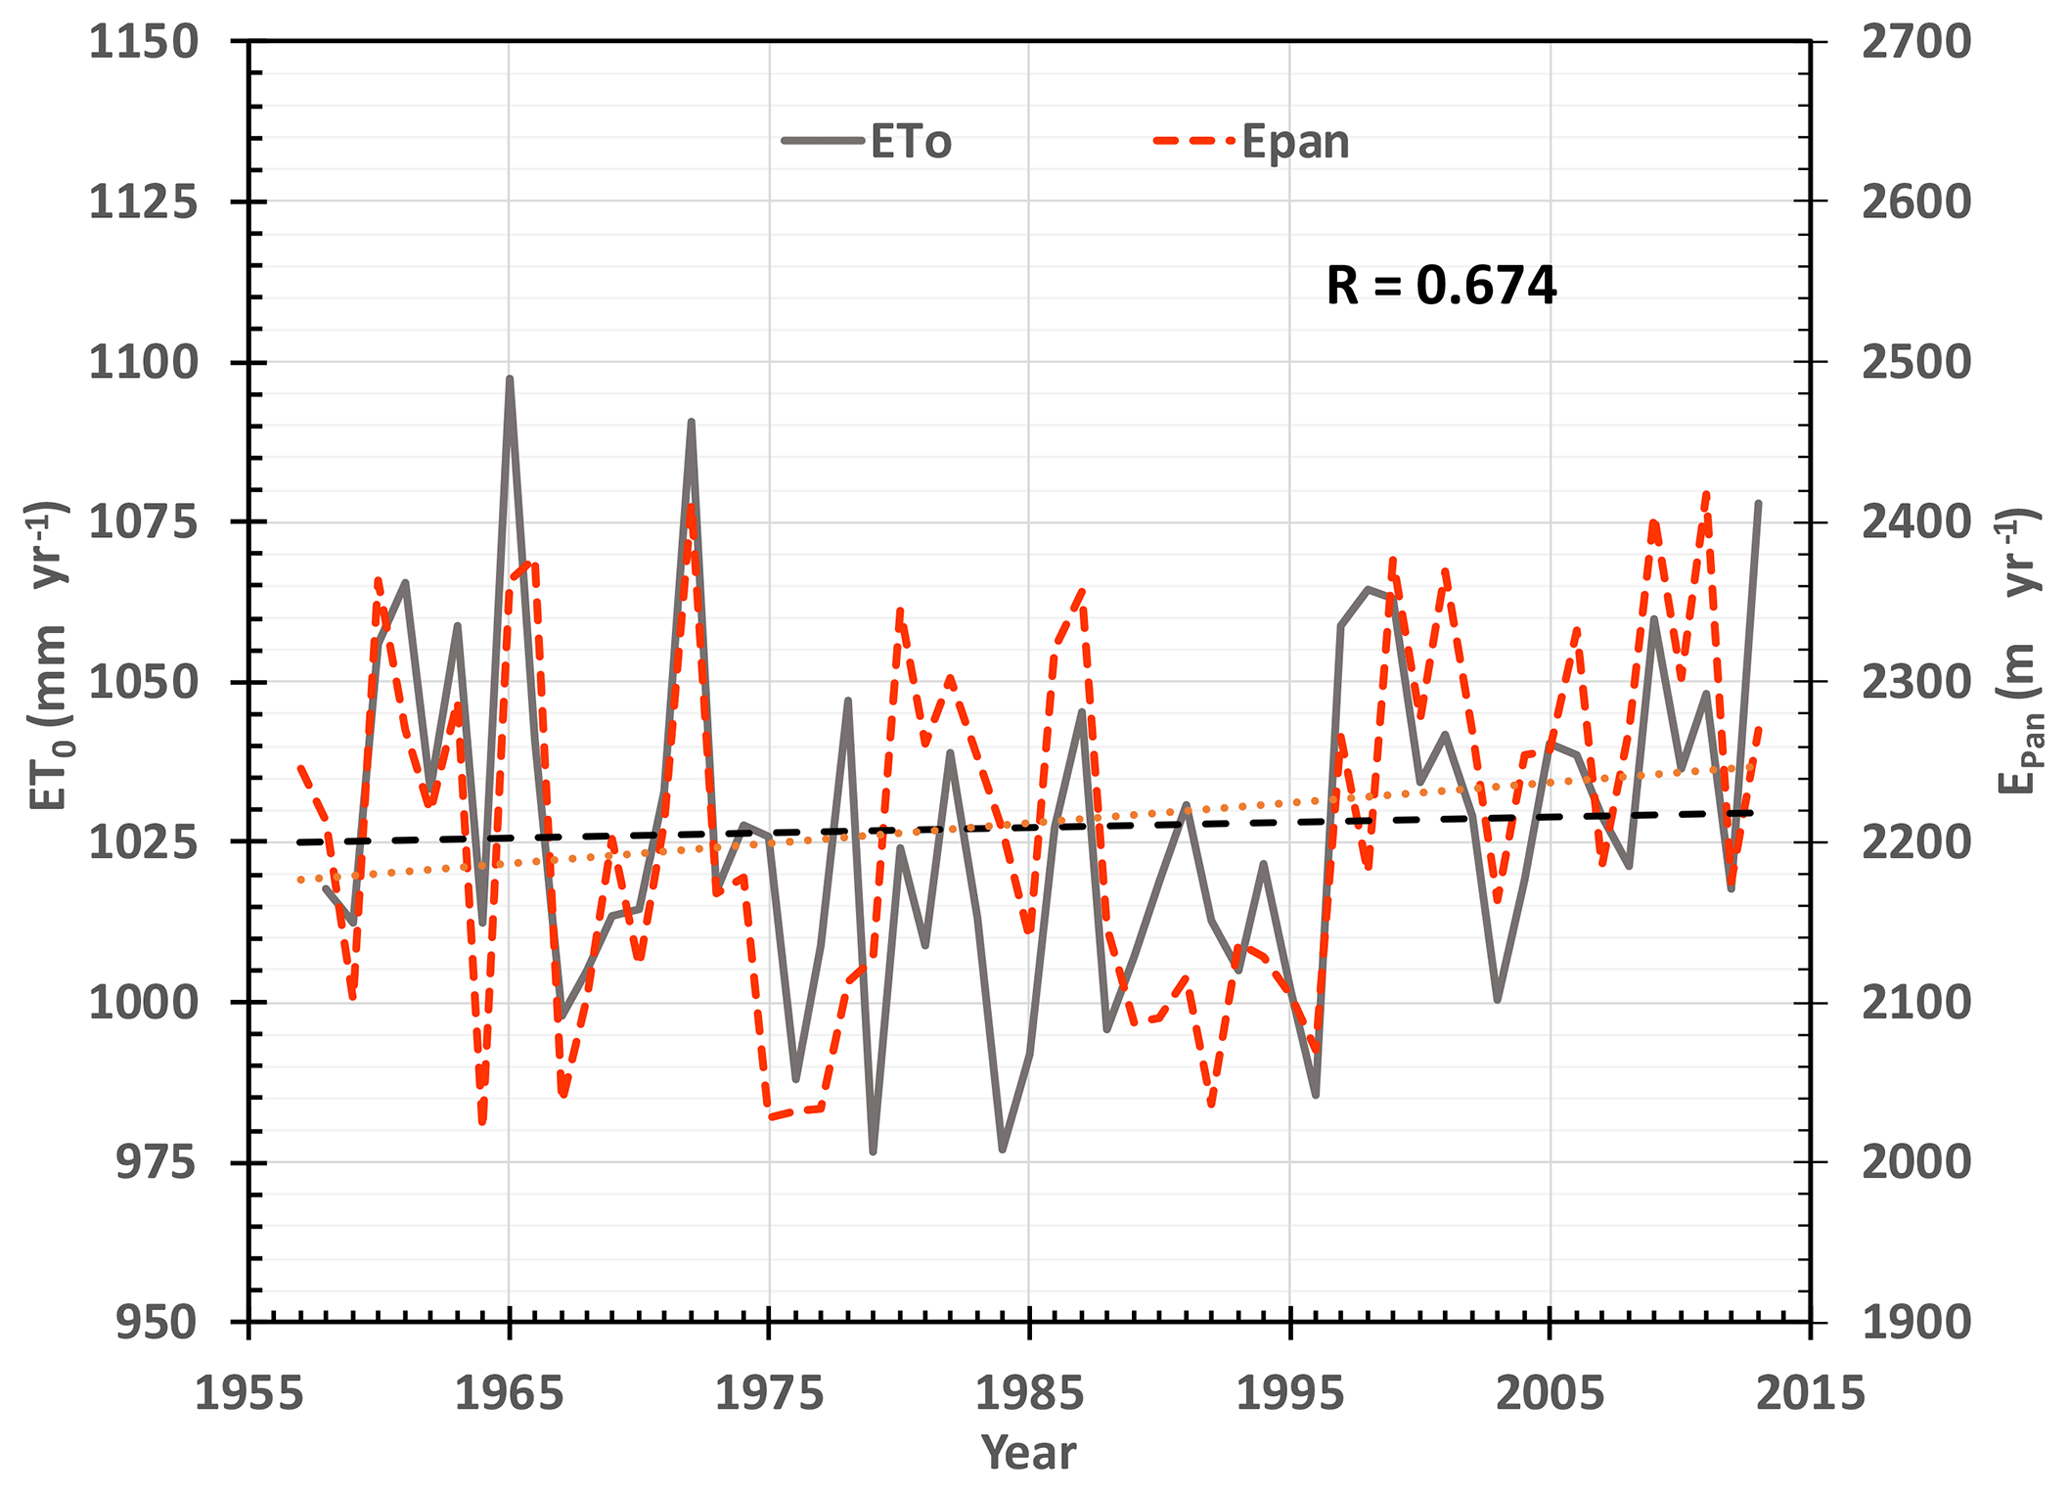
Figure 8Comparison between annual potential evaporation estimated from Eq. (5) and the area weighted annual pan evaporation for Hetao over the period 1958 to 2013. The linear temporal trends are not significant.
The temporal trend in annual ET0 estimated from Eq. (5), shown in Fig. 8, using linear regression, is mm yr−1 per decade. Nonparametric analysis gave a trend of +1.7 mm yr−1 per decade. Both trend estimates were not significant (p<0.9) over the period 1958 to 2013.
Over this period, the mean annual potential evaporation estimated from Eq. (5) was 1027±26. This is considerably larger than the actual evapotranspiration evaluated by Hao and Yang (2016) using two approaches based on a water balance approach and using NDVI and the FAO-56 Penman–Monteith equation. Their water balance for the period 1960 to 2013 gave actual annual evaporation of 601 mm yr−1 and the NDVI Penman–Monteith approach gave 605 mm yr−1 for the period 2006–2010. Yang et al. (2012) used remote sensing to estimate evapotranspiration over the cropping season and found a mean value of 605 mm yr−1 between the years 2000 and 2010. Over the May to September growing season Eq. (5) predicts that ET0 was 742±21 mm. Hargreaves and Allen (2003) recommended that Eq. (6) should be calibrated against Penman–Monteith combination equations to produce a regionally calibrated relationship.
3.3.3 Estimated ET0 and measured Epan
Figure 8 shows the comparison between annual ET0 estimated from Eq. (8) and area weighted annual Epan for Hetao. Between 1958 and 2013, the correlation between ET0 and Epan was very significant (p>0.99999) with correlation, R=0.67. As discussed previously, the linear regression trend in pan evaporation, mm per decade was not significant (p<0.9) as was the trend in estimated ET0. From 1958 to 1975 the correlation between ET0 and Epan was stronger, R=0.83 (p>0.9999) but between 1976 and 2013, the correlation was lower, R=0.59 but still very significant (p>0.9999).
This comparison has demonstrated a reasonably good correlation between annual ET0estimated from Eq. (8) and area weighted mean pan evaporation, Epan, for Hetao. It also reveals that despite the significant increasing maximum and minimum temperatures and the significant decreases in DTR and in estimated Rs, there are no significant trends in either estimated ET0 or in Epan over the period 1958 and 2013.
The dramatic trends found in annual mean daily Tmax and Tmin between 1958 and 2013 in the Hetao Basin are not accompanied by any significant trends in annual precipitation or pan evaporation. The significant disparity between the rates of change Tmax and Tmin mean that DTR is decreasing. This is accord with world-wide observations (e.g. Stanhill and Cohen, 2001). In Hetao, however, the rate of decline of DTR seems more intense and has persisted longer than elsewhere. Decreases in DTR and in Epan (not found here) have been variously attributed to global “dimming” (a decrease in net radiation due to increased cloudiness or aerosols) or global “stilling” (a decrease in wind speed close to the surface) (Easterling et al., 1997; Stanhill and Cohen, 2001; Roderick and Farquhar, 2002; Vose et al., 2005).
Numerous hypotheses have been advanced for the changes occurring globally in DTR and in Epan including changes in cloud cover, aerosol concentrations, precipitation, soil moisture, atmospheric circulation, land use and decreasing wind speeds (Peterson et al., 1999; Roderick and Farquhar, 2004; Vose et al. 2005; Roderick et al., 2007; McVicar et al., 2012). The consensus is that decreasing DTR is a consequence of firstly a general decrease in net radiation, and secondly a decrease in wind speed close to the surface.
It was found here that that between 1958 and 1985, DTR decreased at faster rate than over the full period 1958 to 2013. Between 1985 to 2013, however, the was not significant. This change in trend is consistent with regionally-averaged northern hemisphere data (Vose et al. 2005). This change in trend appears to coincide with a fundamental shift in the El Niño–Southern Oscillation phenomenon (Easterling et al., 1997).
In Hetao, one explanation for the changing trend in DTR could be the impact of evaporation of surrounding irrigation water. Increase in water vapour concentration in the atmosphere decreases Rs but increases in coming long-wave radiation at night, raising Tmin. If this is the case, one might expect that the area of land being irrigated might impact on estimated Rs. Figure 8 compares the decreasing trend in estimated Rs with the increasing trend in irrigated land area. There is a strong, highly significant negative correlation, . The decline in trend in Rs after 1985 also corresponds approximately to a period of almost no growth in irrigated area and to the use of plastic film on the soil surface to minimise soil evaporation. While correlation does not imply causality, the impact of the extent of irrigation on incoming short wave and long-wave radiation is worth researching.
Despite the estimated decline in Rs, there was no significant trend in Epan or estimated ET0 between 1958 and 2013. This absence of a trend appears to imply that the declining radiative component is balanced by an increasing drying power of the air. This is counter intuitive since the 46 % increase in area irrigated in Hetao between 1960 and 2013 should have decreased the water saturation deficit. In terms of Eq. (5), the absence of a significant annual trend in ET0 over the full period indicates .
The annual ET0 estimated here using the empirical approach of Hargreaves were higher than other available estimates but correlated well with measured Epan. It has been recommended that despite widespread testing of the Hargreaves approach, its estimates of ET0 should be calibrated locally.
Implications of changing climate
The available data in the Hetao Basin shows that between 1958 and 2013, annual mean daily minimum temperatures increased at three times the rate of maximum temperatures. Between 1960 and 2010, the period over which minimum temperatures were below zero decreased by over one month. If these increases continue, by 2050 that period could decrease by two months. That may imply a longer growing season and increased water demand in Hetao.
These increasing temperatures also mean that topsoil in the Basin will be frozen for a shorter period and to a shallower depth than in the past. Soil freezing has at least two important roles. Firstly, it appears to promote formation of soil structure and improves early season infiltration and root growth. Secondly, the propagation of the freezing front downwards may expel salt that accumulated over the growing season deeper into the soil profile and away from the root zone. A decrease in the time and depth the soil is frozen may lead to a lower efficiency of salt removal.
Annual daily temperatures in the Inner Mongolia region of northern China have increased dramatically over the past 60 years. The limited available records in Hetao show that the period that temperatures are below zero has shortened significantly suggesting that the length of the growing season is expanding. Because minimum temperatures are increasing at three times the rate of maximum temperatures, DTR is decreasing. This implies that either incoming solar radiation or wind run is decreasing or both.
Despite the dramatic change in temperatures, annual rainfall, pan evaporation and estimated potential evaporation, have no significant trends over this period. This means that only an expansion of the length of the growing season could cause an increase in future water demand.
The rapid increase in Tmin means that if the trend continues, the soil will be frozen for a shorter period and to a shallower depth. This has implications for soil structure formation, infiltration and root growth as well as the efficiency of salt flushing from the soil. All require further research.
All data sources used in this work are given in Table 2.
JYu and JYa initiated, co-hosted and supported the research, IW drafted the paper and analysed trends, TX carried out the spatial interpolation of mean daily maximum and minimum temperatures throughout China, JZ provided critical insights particularly on all aspects of water in the Hetao Basin as well as invaluable translations, XM provided details of irrigation practices in the basin, ZH and HC shared their research results on the Hetao Basin, especially on evapotranspiration.
The authors declare that they have no conflict of interest.
This article is part of the special issue “Hydrological processes and water security in a changing world”. It is a result of the 8th Global FRIEND–Water Conference: Hydrological Processes and Water Security in a Changing World, Beijing, China, 6–9 November 2018.
This work was supported by the Major Special Project of Inner Mongolia Science and Technology: Research and Demonstration of the Key Technologies of Drip Irrigation Using the Multi-source of Water in Yellow River Irrigation Areas of Inner Mongolia (2013–2017).
This research has been supported by the Major Special Project of Inner Mongolia Science and Technology: Research and Demonstration of the Key Technologies of Drip Irrigation Using the Multi-source of Water in Yellow River Irrigation Areas of Inner Mongolia (grant no. 2013-2017).
Allen, R. G., Pereira, L. S., Raes, D., and Smith, M.: Crop Evapotranspiration, FAO Irrigation and Drainage Paper 56, FAO, Rome, 300 pp., 1998.
Easterling, D. R., Horton, B., Jones, P. D., Peterson, T. C. Karl, T. R., Parker, D. E., Salinger, M. J., Razuvayev, V., Plummer, N., Jamason, P., and Folland, C. K.: Maximum and minimum temperature trends for the globe, Science, 277, 364–367, 1997.
Hao, P. and Yang, J.: Spatial distribution of crop evapotranspiration in Hetao Irrigation District based on NDVI and FAO56 Penman–Monteith, J. Irrig. Drain., 35, 20–25, 2016.
Hargreaves, G. H.: Simplified coefficients for estimating monthly solar radiation in North America and Europe, Departmental Paper, Dept. of Biol. And Irrig. Engrg., Utah State University, Logan, Utah, 1994.
Hargreaves, G. H. and Allen, E. G.: History and evaluation of Hargreaves evapotranspiration equation, J. Irrig. Drain. Eng., 129, 53–63, https://doi.org/10.1061/(ASCE)0733-9437(2003)129:1(53), 2003.
Hargreaves, G. H. and Samani, Z. A.: Estimating potential evapotranspiration, J. Irrig. Drain. Eng.-ASCE, 108, 223–230, 1982.
Hargreaves, G. H. and Samani, Z. A.: Reference crop evapotranspiration from temperature, T. ASAE, 1, 96–99, 1985.
IWC-IM: Construction and rehabilitation planning project for water-saving in Hetao Irrigation District of the Yellow River basin, Inner Mongolia, Institute of Water Conservancy and Hydropower of Inner Mongolia, Hohhot, 1999.
Kendall, M. G.: Rank Correlation Methods, 4th Edn., Griffin, London, 1970.
Lehane, S. Water Management in the Yellow River Basin, Future Directions International Pty Ltd., Dalkeith, WA, 9 pp., available at: http://www.futuredirections.org.au/publication/water-management-in-the-yellow-river-basin/ (last access: 23 July 2020), 2015.
McVicar, T. R., Roderick, M. L., Donohue, R. J., Li, L. T., Van Niel, T. G., Thomas, A., Grieser, J., Jhajharia, D., Himri, Y., Mahowald, N. M., Mescherskaya, A. V., Kruger, A. C., Rehman, S., and Dinpashoh, Y.: Global review and synthesis of trends in observed terrestrial near-surface wind speeds: Implications for evaporation, J. Hydrol., 416–417, 182–205, https://doi.org/10.1016/j.jhydrol.2011.10.024, 2012., 2012.
Peel, M. C., Finlayson, B. L., and McMahon, T. A.: Updated world map of the Köppen–Geiger climate classification, Hydrol. Earth Syst. Sci., 11, 1633–1644, https://doi.org/10.5194/hess-11-1633-2007, 2007.
Peterson, T. C., Gallo K., Lawrimore, J., Owen, T., Huang, A., and McKittrick, D.: Global rural temperature trends, Geophys. Res. Lett., 26, 329–333, 1999.
Roderick, M. L. and Farquar, G. D.: Changes in Australian Pan Evaporation from 1970 To 2002, Int. J. Climatol., 24, 1077–1090, 2004.
Roderick, M. L., Rotstayn, L. D., Farquhar, G. D., and Hobbins, M. T.: On the attribution of changing pan evaporation, Geophys. Res. Lett., 34, L17403, https://doi.org/10.1029/2007GL031166, 2007.
Stanhill, G. and Cohen, S.: Global Dimming: A Review of the Evidence for a Widespread and Significant Reduction in Global Radiation with Discussion of Its Probable Causes and Possible Agricultural Consequences, Agr. Forest Meteorol., 107, 255–278, https://doi.org/10.1016/S0168-1923(00)00241-0, 2001.
Tang, G., Ding, Y., Wang, S., Ren, G., Liu, H., and Zhang, L.: Comparative Analysis of China Surface Air Temperature Series for the Past 100 Years, Adv. Clim. Change Res., 1, 11–19, https://doi.org/10.3724/SP.J.1248.2010.00011, 2010.
Tang, Q., Oki, Y., Kanae, S., and Hu, H.: Hydrological cycles change in the Yellow River Basin during the last half of the Twentieth Century, J. Climate, 21, 1790–1806, https://doi.org/10.1175/2007JCLI1854.1, 2008.
Theil, H.: A rank-invariant method of linear and polynomial regression analysis, I, II, III, in: Proceedings of the Royal Netherlands Academy of Arts and Sciences, Koninklijke Nederlandse Akademie van Wetenschappen, Amsterdam, 386–392, 521–525, 1397–1412, 1950.
Vose, R. S., Easterling, D. R., and Gleason, B.: Maximum and minimum temperature trends for the globe: An update through 2004, Geophys. Res. Lett., 32, L23822, https://doi.org/10.1029/2005GL024379, 2005.
Xu, X., Huang, G., Qu, Z., and Pereira, L. S.: Assessing the groundwater dynamics and impacts of water saving in the Hetao Irrigation District, Yellow River basin, Agr. Water Manage., 98, 301–313, 2010.
Xu, Z., Takeuchi, K., Ishidaira, H., and Liu, C.: An Overview of Water Resources in the Yellow River Basin, Water Int., 30, 225–238, 2005.
Xue, J. and Ren, L.: Assessing water productivity in the Hetao Irrigation District in Inner Mongolia by an agro-hydrological model, Irrig. Sci., 35, 357–382, https://doi.org/10.1007/s00271-017-0542-z, 2017.
Yang, J.: Water Resources Planning Report [R], Water Supplies Bureau of Bayan Nur, 2005.7, Wuhan University, Wuhan, 2005.
Yang, Y., Shang, S., and Jiang, L.: Remote sensing temporal and spatial pattern of evapotranspiration and response to water management in a large irrigation district in North China, Agr. Forest Meteorol., 164, 112–122, 2012.