the Creative Commons Attribution 4.0 License.
the Creative Commons Attribution 4.0 License.
 | 16 Sep 2020
Stress testing as complement to climate scenarios: recharge scenarios to quantify streamflow drought sensitivity
Michael Stoelzle
Maria Staudinger
Kerstin Stahl
Markus Weiler
Precipitation deficits and temperature anomalies are often the main cause for low flows and summer streamflow droughts. However, where groundwater is the main contribution to sustain water availability and ecological integrity during dry spells, the role of recharge and catchment storage is crucial to understand streamflow drought sensitivity. Here we introduce recharge stress tests as complement to climate scenarios to characterize and quantify the streamflow drought sensitivities of catchments. The stress tests are presented by applying them to six headwater catchments in Switzerland with various catchment and streamflow characteristics. The stress tests drive the bucket-type hydrological model HBV in a framework, in which pre-drought recharge conditions can be decreased to test how catchments respond to and recover from drought. We identified an upper limit of stress test durations around 12 months as indicator of maximum recharge- and storage-memory for the study catchments. Varying response on stress testing across the catchments suggests different storage properties and thus different recovery times from drought. From the stress test simulations, we found up to 200 d longer summer streamflow droughts with additional streamflow deficits which account for up to 40 d of median flow. Using a worst-case pre-drought recharge in stress test simulation leads to minimum flow reductions of 50 %–80 % compared with the reference simulation. Based on the results we conclude with recommendations for further stress test research in drought hydrology.
- Article
(2918 KB) - Full-text XML
- BibTeX
- EndNote


To assess the sensitivity of catchments to drought it is important to understand how hydrological systems might respond to changes in future climate. Unfortunately, climate change studies often fail to distinguish between inherent climate variability and projected climate change signal. For instance, different temporal structures of future climate input can affect low flows, but the sequencing of simulated wet and dry spells is not altered (Vormoor et al., 2017). Climate change scenarios introduce large uncertainties to hydrological assessment of future streamflow droughts and low flow events (Addor et al., 2014). A way forward to reduce these uncertainties is a generic model framework in which climate input of a reference simulation from a hydrological model can be altered to test the response of catchments regarding periods with low streamflow (Stoelzle et al., 2014; Staudinger et al., 2015). Here we introduce a novel stress testing framework based on historical data to quantify how sensitive catchments are to decreased recharge before a drought. In the stress test (ST) framework pre-drought recharge is reduced while the catchment-specific climate variability is preserved. Through alteration of pre-drought recharge and thus water availability, a new sequencing in drought propagation is tested.
Besides uncertainties of climate scenarios another reason to apply drought stress testing is the increasing demand of complementary information for water agencies to develop reliable water management plans to make provision for future streamflow droughts. In many regions world-wide regional climate models project decreasing summer precipitation and lower summer water availability. Those projections often provide regional and seasonal patterns of hydrological change but miss out on catchment- and event-specific drought propagation characteristics. By using stress tests water managers could answer typical “what-if”-questions to better understand how extreme historical streamflow droughts were and what could have happened if drought preconditions had been more severe.
Magnitude, frequency and duration of low flow periods and streamflow droughts are often primarily controlled by groundwater contribution. This groundwater contribution depends on a varying connectivity between groundwater and rivers and the recharge rates that (re-)fill groundwater storages. Recharge compared with precipitation and temperature is hence considered as a dominant control of low flow magnitude and eventually streamflow drought severity. Recharge conditions in pre-drought periods can influence deficit, duration and intensity of subsequent drought periods. As streamflow regimes are more or less groundwater-dominated the duration of these periods should vary to identify and account for different relevant time scales of drought propagation.
In the presented STs recharge before summer low flow periods is altered. This alteration is implemented in the bucket type hydrological model HBV as model experiment, which allows to obtain ST simulations and compare them all to a reference streamflow simulation. As a direct permutation of recharge in HBV is not supported we realize the stress testing by replacing the original precipitation (P) and temperature (T) data of a certain period with P and T data from other years that have less simulated reference recharge. In stress testing “stress” is defined as systematic decrease of recharge, and “test” is the quantification of change in streamflow response in a systematic framework related to this decrease. STs are not about hydrological prediction but identifying the sensitivity of a catchment to drought conditions. Similar to climate change model chain experiments, all streamflow simulations from STs are compared with the HBV reference simulation and never against observed streamflow to account for model biases. In the HBV model, recharge is defined as the percolation from the soil box into the groundwater box. The percolation rate can be decreased by evapotranspiration and increased by snow melt.
We present two types of stress testing approaches. The first stress test is based on annual natural variability (STNAT) with a fixed one-year permutation scheme in which the original pre-drought year is altered. The second stress test (STWORST) embeds different stress durations, extracts worst-case pre-drought recharge periods from data and starts at the event-specific onset of the drought period. An overview of the stress testing is shown in Fig. 1 and technical procedures are described in Sect. 3.3 and 3.4.
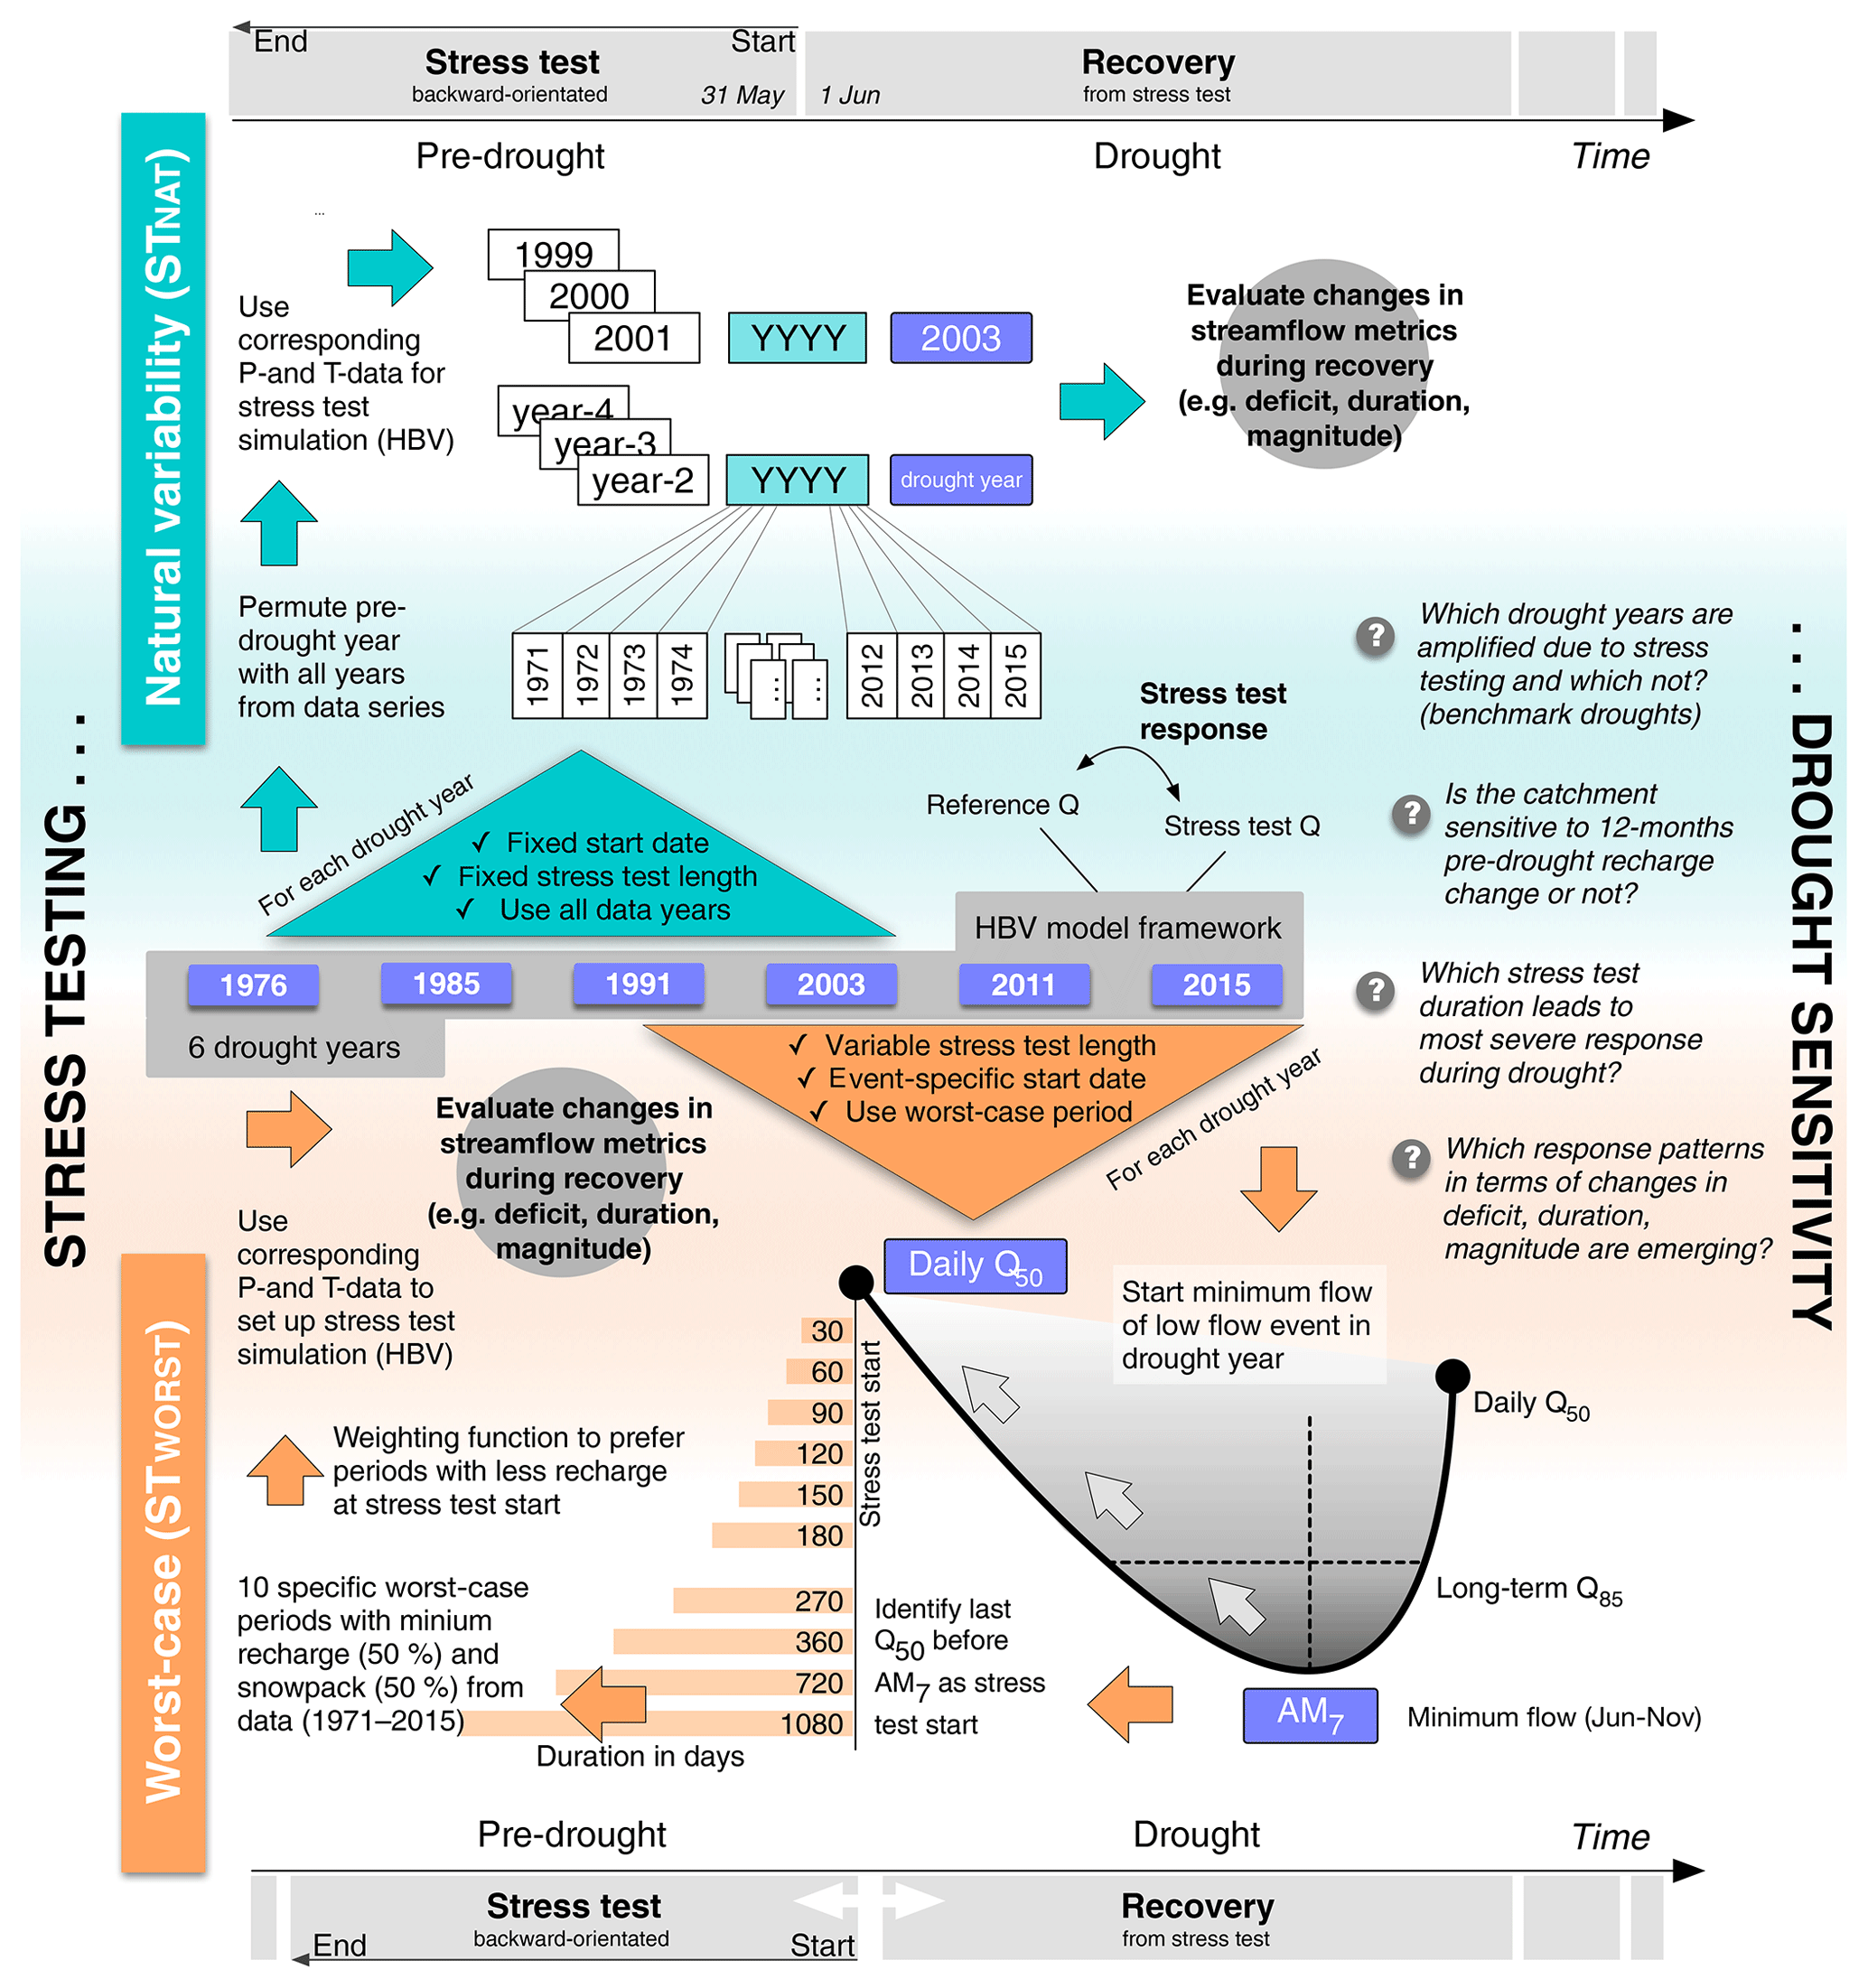
Figure 1Overview of general stress testing approach, research questions and the procedures for stress tests STNAT and STWORST.
3.1 Study sites and data
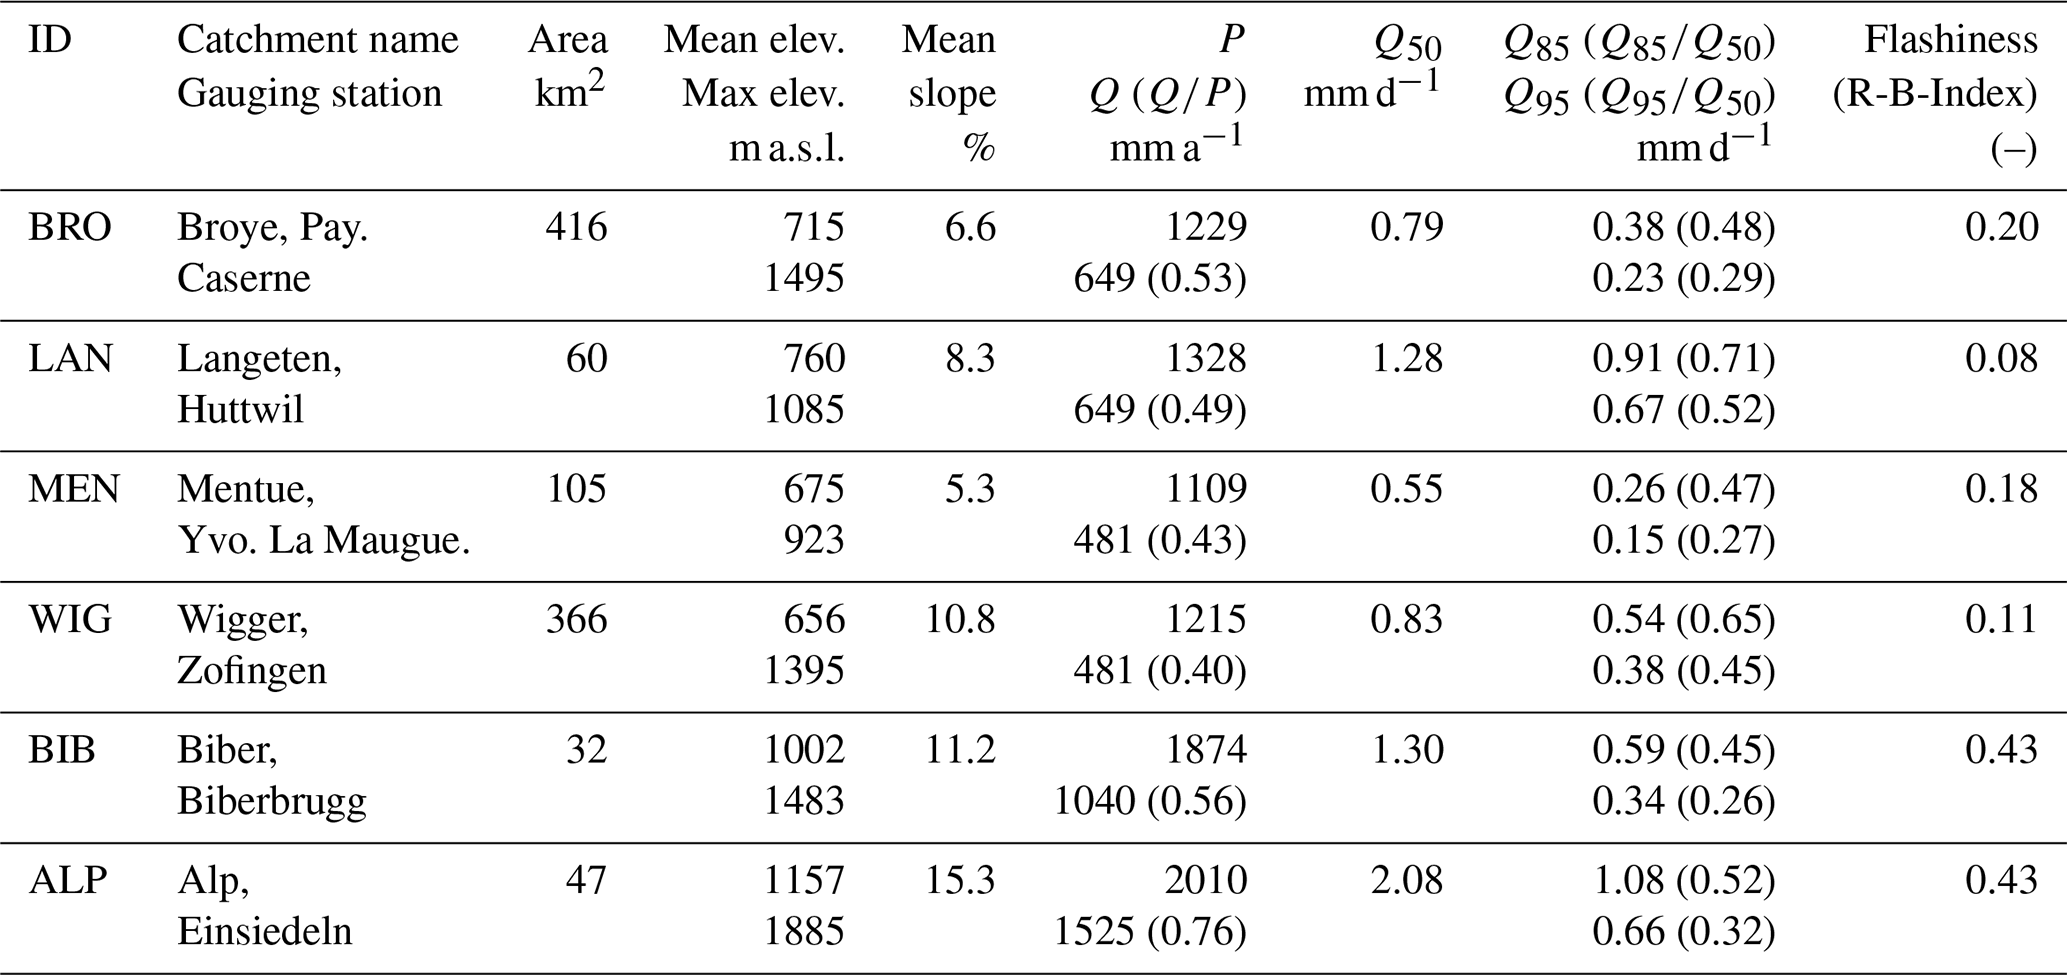
We perform STs in six mostly rainfall-dominated catchments in Switzerland that can be classified as headwater catchments with minor anthropogenic influences, small urbanization and near-natural streamflow. However, influences due to hydropeaking and wastewater treatment are possible, but considered to have a negligible influence with respect to ST design. Table 1 gives an overview on catchment characteristics and some hydrometeorological metrics. Annual precipitation in the catchments is relatively high (1100–2000 mm a−1) and they differ in catchment area (32–416 km2), runoff ratios (0.40–0.76), low flow stability (Q85∕Q50, Q95∕Q50) and flashiness. Gridded daily precipitation P (MeteoSwiss RHiresD, 2 km interpolated observations data set) and mean daily air temperature T, (MeteoSwiss, TabsD, 2 km interpolated observations data set) – are aggregated to daily averages for the catchments. Observed streamflow is provided by the Swiss Federal Office for the Environment (FOEN).
Table 1Catchments characteristics, climate and streamflow metrics. Metrics are based on observed precipitation (P) and simulated streamflow (Q, Q50, Q85, Q95) time series from 1976 to 2015. Ratios in brackets are related to P and Q50, respectively. Flashiness is a metric to quantify and compare the path length of the hydrograph (Baker et al., 2004), the higher the value, the flashier the hydrograph.
3.2 HBV modelling
For the HBV reference simulation, the model parameters were derived from a GAP-calibration (Seibert, 2000). We used the HBV model in the version HBV-light 4.0 with 100 m elevation zones and snow-, soil and groundwater routines, where groundwater is separated into a faster and a slower box (Seibert and Vis, 2012). The calibration period was set to 1980–2000, but P- and T-data were available for the period 1971–2018. All HBV runs (calibration and ST simulation) have the same model warm-up, i.e. 10 years of data (1961–1970) that are not included for ST period selection. Gradients of P and T were derived based on input data. For the calibration we used an objective function Effw, that combines the adapted Kling-Gupta-Efficiency (70 % weight) from Pool et al. (2018) and the Mean Absolute Relative Error MARE (30 % weight) to account for low flows and volumetric bias reduction in the calibration.
3.3 Natural variability stress test (STnat)
The overriding question of the ST on natural variability (STNAT) is: what would have happened in a drought year if the pre-drought year with its specific recharge rates was changed? To answer this question, we permute the preconditions of each drought year (e.g. 2003) by replacing the pre-drought year (e.g. 2002) with all other 39 years from the 40-year time series (1976–2015). P- and T-input for HBV is hence replaced between 31 May of the drought year (e.g. 31 May 2003) and the 1 June of the pre-drought year (e.g. 1 June 2002) to obtain 39 different ST simulations for each drought year (i.e. 6 drought years ×39 permutations =234 STNATs per catchment). For this ST recovery always starts from 1 June of the drought year. After the 31 May the HBV-model input is the same for reference and ST simulation.
3.4 Worst-case stress test (STworst)
As the yearly time scale of STnat might be too long to test a catchments' sensitivity to decreased recharge, STworst is based on drought year- and catchment-specific low flow events and variable ST durations. First the minimum flow is identified for each catchment by the day of the 7 d minimum flow, AM7, from June through November for all six drought years. The last exceedance of daily Q50 before AM7 is defined as the onset of the low flow period and the first exceedance of daily Q50 after the occurrence of AM7 is defined as termination of the low flow period. The date of the onset of low flow is also the end date for all STWORST (Fig. 1). The ST end date is the starting point for ten different simulations with durations of 30, 60, 90, 120, 150, 180, 270 d and 1, 2 and 3 years. For each duration the worst-case period with minimum recharge is identified based on the reference simulation, i.e. the worst-case period is selected from the period 1971–2015 with 45 data years. Occasionally the original period is the worst-case period, then no ST can be performed. Here more data years compared to STNAT are used to allow for prolonged STs before the drought year 1976.
To prefer periods with drier conditions near the end of the ST (i.e. 31 May) a weighted recharge sum is used. A triangular function weights the daily recharge at the beginning of the ST with factor 0, the last day of ST with factor 1 and uses a linear increase to derive daily weights in between. Zappa and Kan (2007) have shown that snow- and glacier-melt substantially buffered summer low flows during the 2003 heatwave. This underpins that both recharge and snow pack must be considered to identify reliable worst-case periods for stress testing. Hence, snow water equivalent (SWE) from the reference simulation at the end date of ST is added to the weighted recharge sums. In this study both components are equally weighted, but also another weighting between recharge and snow pack might be plausible to select worst-case periods. By adding up recharge and snowpack it is possible to rank all potential worst-case periods according to their potential “water availability” during the pre-drought period. From the ranking of 44 potential worst-case periods the one with the lowest combination of weighted recharge sum and snow pack is set to be the “worst-case period”. This period must have a smaller amount of unweighted recharge sum combined with snow pack than the reference simulation. If not, the next period in ranking with slightly higher amount of weighted recharge and snow pack is used. A new ST simulation is prepared where P- and T-data as model input from the reference simulation is replaced by P- and T-data from the selected worst-case period.
3.5 Evaluation of stress test response
Recovery duration (in days) is used to quantify how long the system requires to return to “normal” state, i.e. recovery is terminated on the day when ST streamflow converges with references streamflow (with 2 % tolerance) after the ST has ended. Recovery in this study does not imply total recovery from drought, but is used as a metric to quantify the persistence of the ST signal.
Minimum streamflow (change in %) during streamflow droughts is important for ecological integrity of rivers, various water users, water quality and water temperature. We thus test the effect of pre-drought recharge stress on the relative change in minimum flow (AM7) during the original drought period.
Streamflow deficit (mm and normalized days) is an integrative measure of streamflow drought severity, because some events show rather low minimum flow but others show prolonged durations. We calculate streamflow deficit below the seasonal Q85 (June–November) of the reference streamflow to ensure that the additional ST streamflow deficit is meaningful regarding drought intensification. Subsequently streamflow deficit is normalized based on Van Loon et al. (2014) by Q50-days to compare ST effects across catchments and relate the deficit to an average water availability in a catchment (i.e. the recovery potential of a catchment).
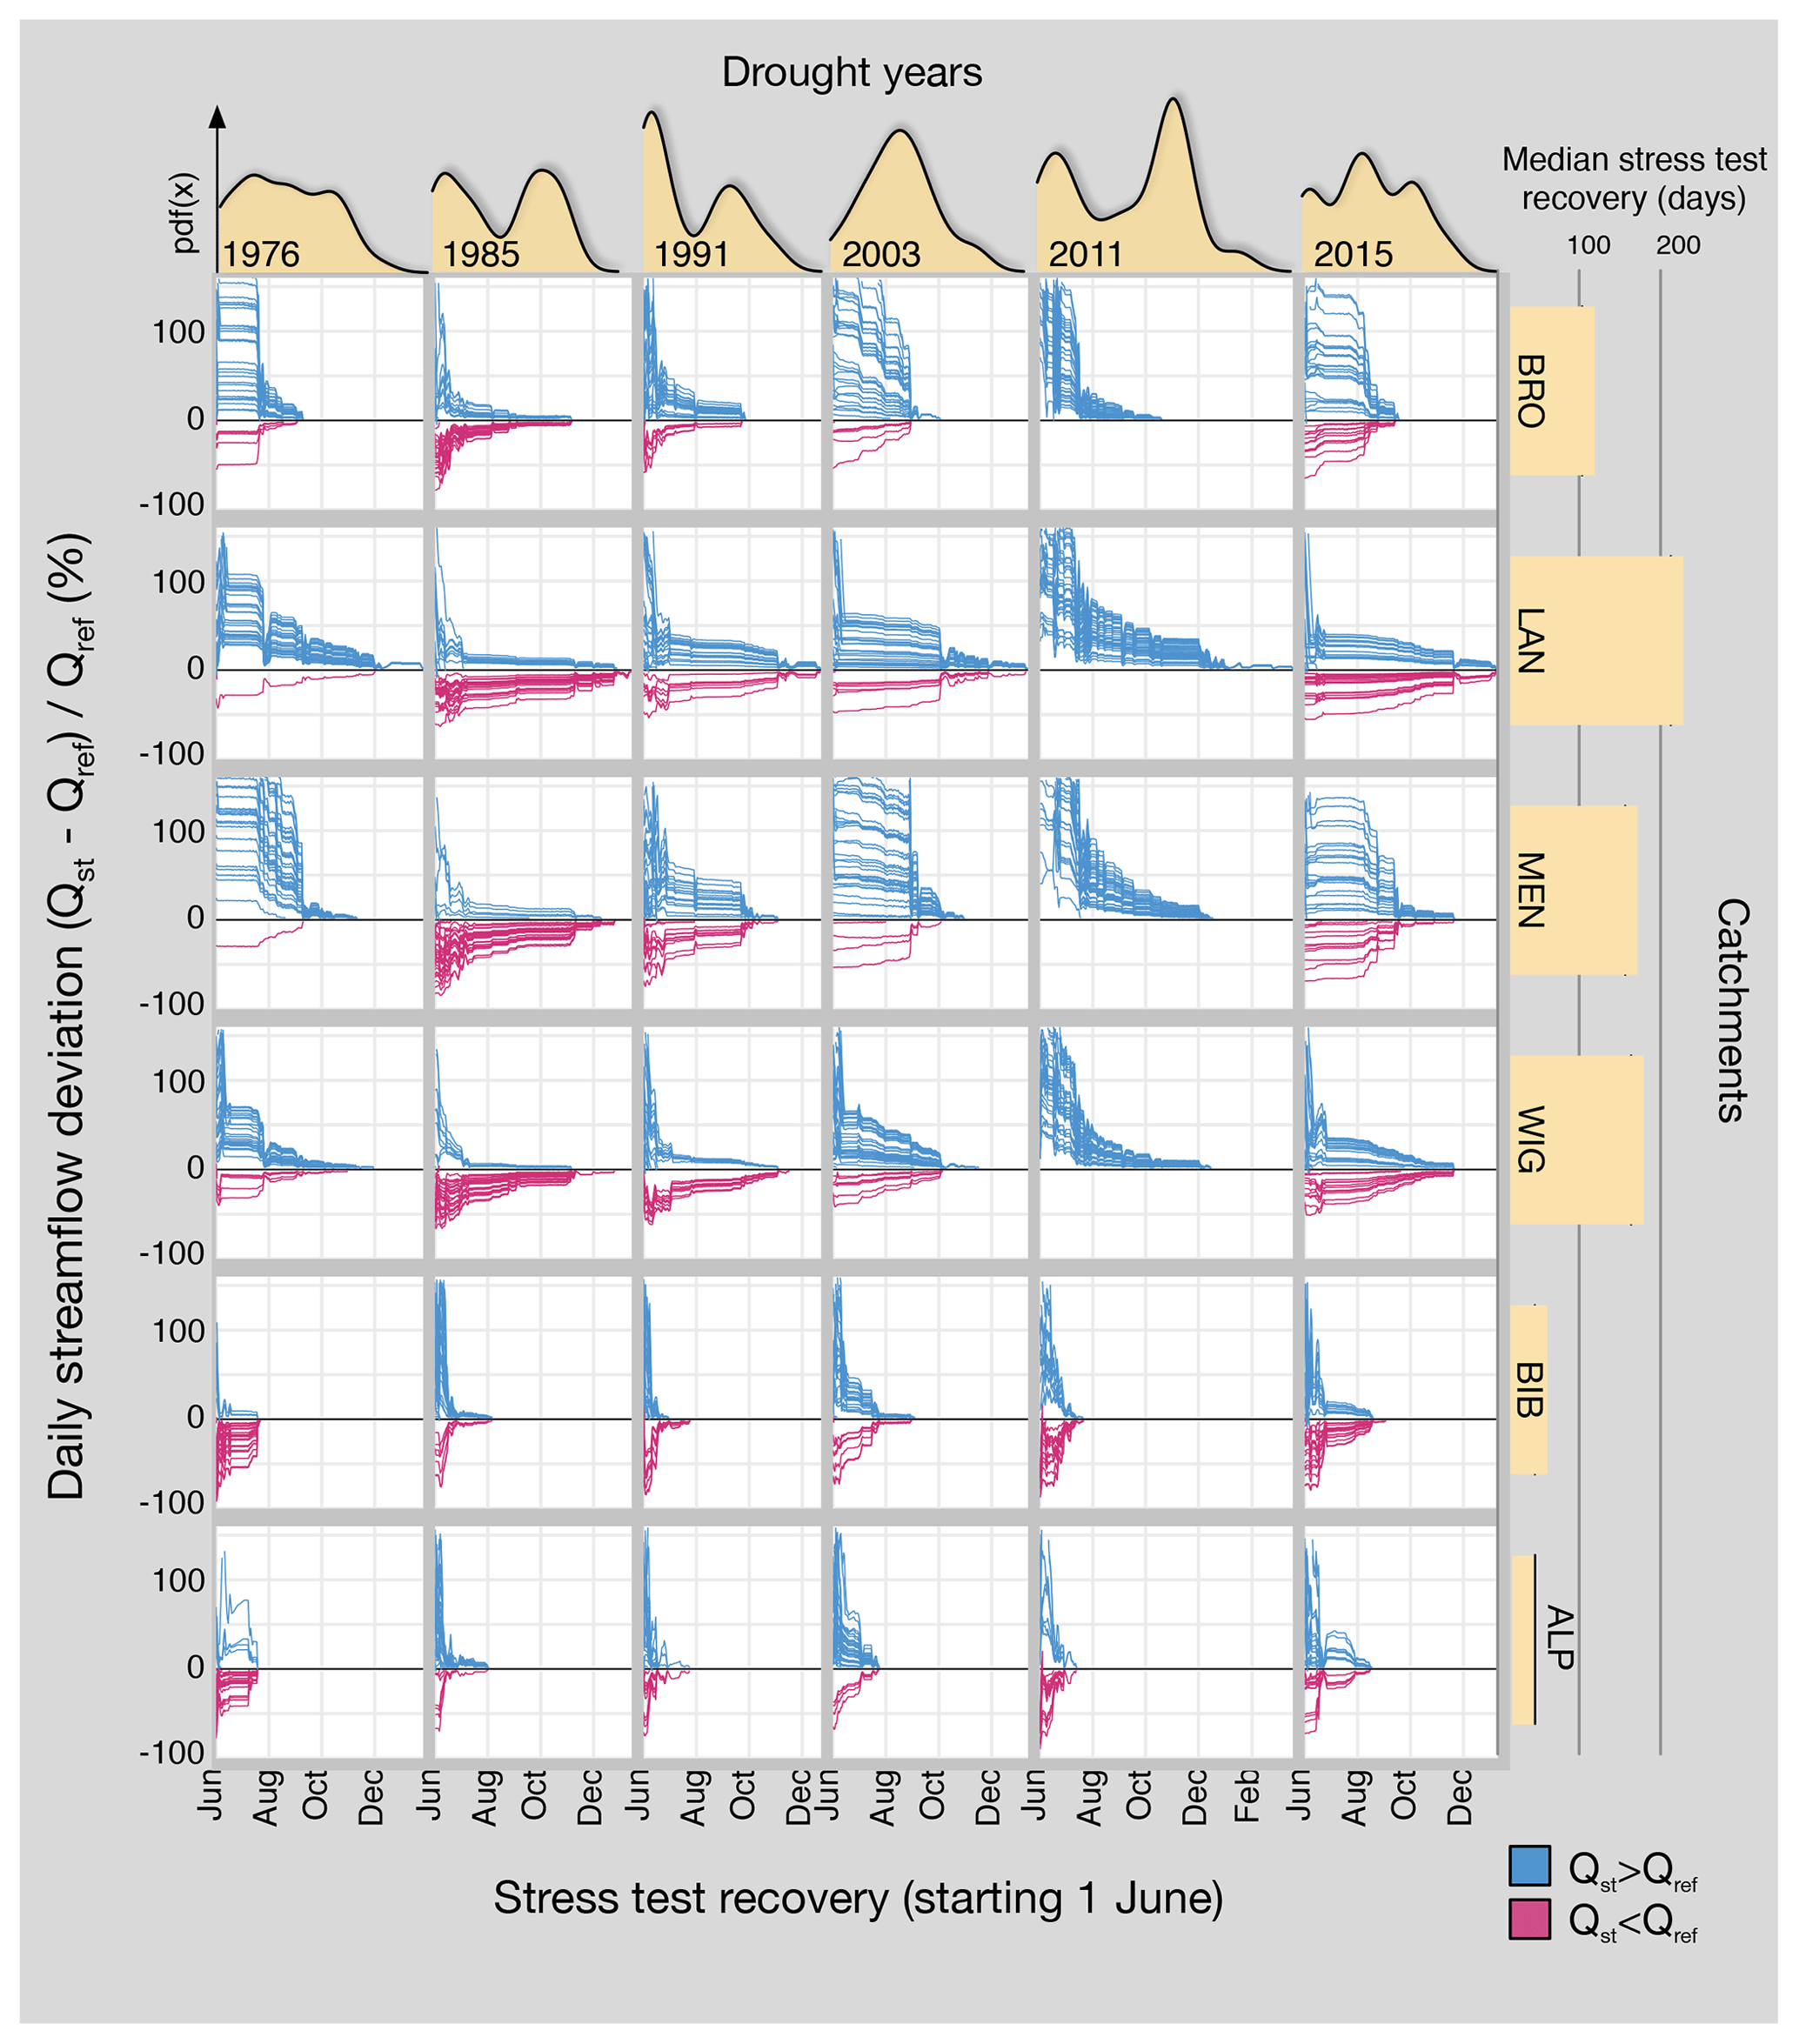
Figure 2Evaluation of recovery time after STNAT for different drought years (columns) and catchments (rows) where Qst is streamflow from stress test simulation and Qref is streamflow from reference simulation. Density curves (top) and barplots with median values (right) show the distributions of recovery times across drought years or catchments. y-axis is truncated at +150 % to improve visualization.
4.1 Performance of HBV model
From the GAP-calibration the model parameterization from the simulation with the highest Effw out of 100 simulations is used for further analysis. Effw ranges between 0.81 and 0.87 for all catchments. Since all STs are compared to the reference runs the differences between model reference and observation are not further considered in this study. However, the model efficiency illustrates that in general hydrograph representation is suitable for stress testing.
4.2 Evaluation of STNAT
The permutation of pre-drought years leads to drier and wetter preconditions and causes changes of the original drought periods (after 1 June) with more and less streamflow (Fig. 2). However, response patterns vary markedly across the catchments and drought years. Median recovery times are ∼200 d (LAN), ∼150 d (MEN, WIG), 100 d (BRO) and 25–45 d (BIB, ALP). For the last group the altered pre-drought conditions lead only occasionally to long recovery times (< 100 d) indicating that those catchments are less sensitive to alteration of complete pre-drought years. One reason for that could be the relatively high flashiness indicating short turnover times between precipitation input and streamflow response. In other catchments (LAN, MEN, WIG) we found longer recovery times where the ST signal persists until the end of the drought year. Focusing on differences between the drought years it is apparent that altered pre-drought years could have led to more severe droughts in 1985 and 2015. On the contrary, original pre-conditions in 1976 and 2011 must have been very dry as the analysis shows only recovery lines with positive streamflow deviations compared to the reference (turquoise-coloured lines in Fig. 2). Indeed, climate records show that April and May 2011 were exceptionally warm and dry in Switzerland. However, negative deviations of ST streamflow compared to reference streamflow for ALP and BIB in 2011 give some evidence that altered pre-drought years could have decreased low streamflow in those flashier catchments until end of July.
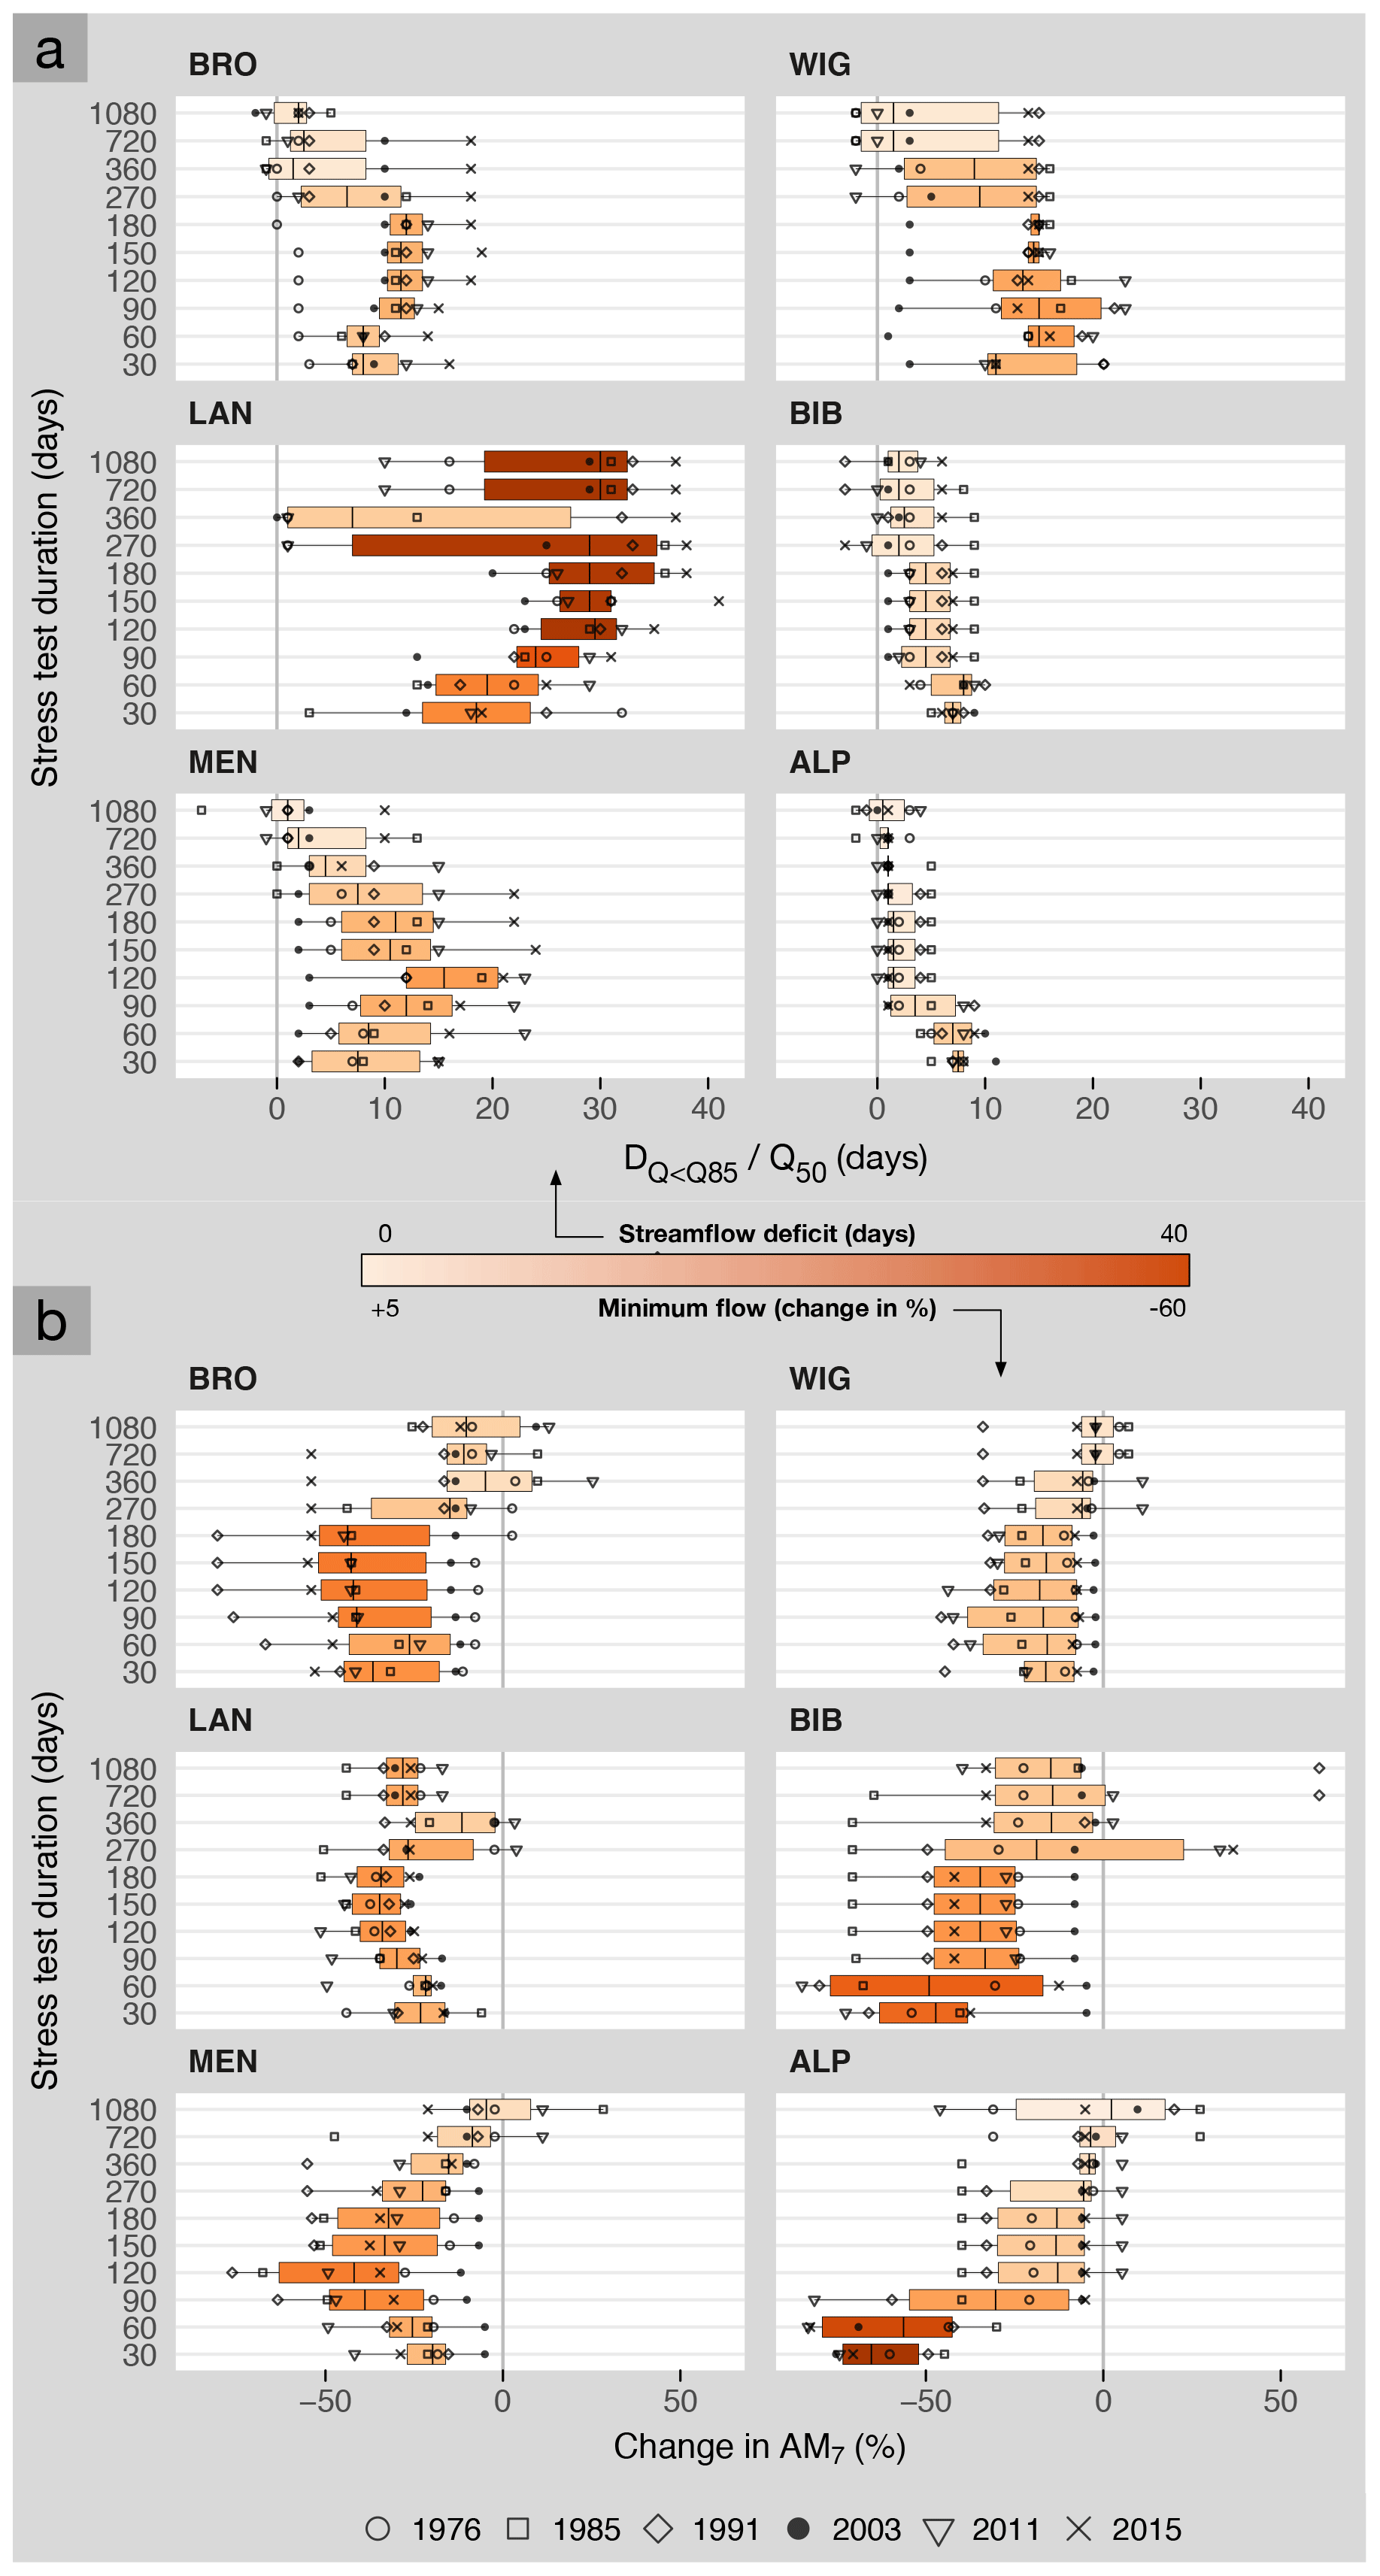
Figure 3Streamflow response due to STWORST with different durations (30–1080 d) analysed by (a) streamflow deficit and (b) change in minimum streamflow. Higher colour saturation of boxplots indicates more severe droughts due to stress testing.
Comparing prominent recent drought years (i.e. 2003 and 2015) we found that in 2003 across all catchments 72 % of the STNAT pre-drought years were drier than the original pre-drought year, but only in 14 % the recovery periods are drier (i.e. less streamflow) than the reference. For the 2003 drought this suggests that the year between May 2003 and June 2002 was relatively wet. For 2015 around 50 % of pre-drought years were drier and in 41 % the recovery periods have less streamflow than the reference. This unveils that drought propagation is controlled by a combination of catchment characteristics (e.g. hydrogeology) and drought event characteristics (e.g. pre-conditions, seasonal timing of drought, precipitation and temperature anomalies). The 2003 drought appears to be more controlled by the extreme heatwave during the actual streamflow drought event than by pre-drought recharge deficits (i.e. the winter 2002/2003). In contrast, stress testing the drought year 2015 suggests that this event could be amplified and prolonged by pre-drought recharge decrease. In both cases the early parts of the streamflow droughts might be classified as flash droughts due to their rapid rate of event intensification (Otkin et al., 2018). Additionally, the drivers and characteristics of those flash droughts appear to be different and hence might be classified as “heatwave” flash drought (2003) and “precipitation” flash drought (2015) following the definition of Mo and Lettenmaier (2016) interpreting the drivers of hydrological drought. Unimodal distributions of ST recovery times (years 1976 and 2003 in Fig. 2) might be an indicator of heatwave-induced flash droughts when high temperature anomalies superimpose the differences in pre-drought recharge across the permuted years. However, more data analysis is needed to justify this assumption, although evaluation of STWORST in the next section supports these findings.
4.3 Evaluation of STWORST
The major difference in stress test design between STNAT and STWORST is that the latter allows for event-specific starting dates and different ST durations. In 5 % of all STWORST-simulations the original pre-drought recharge was already the worst case (i.e. absolute minimum recharge in data). Only for 30 and 60 d STWORST new worst-case periods could be found for all catchments and drought years. We used two different drought metrics (i.e. streamflow deficit and change in minimum flow) to evaluate a catchments' sensitivity on reduced recharge (Fig. 3). Results show that up to 40 d of median flow are needed to refill the deficit induced by stress testing (Fig. 3a). In general, the deficit curves showed their maximum at ST durations around 120–270 d. However, larger deficits for shorter durations can be found in the WIG, BIB and ALP catchments. Here stress testing with longest ST durations leads occasionally to negative deficits (i.e. a streamflow surplus). For BRO, LAN and MEN the largest streamflow deficit occurs in the drought year 2015, for BIB and ALP the drought year 1985 is prominent if the response of very short STs is neglected. Maxima in streamflow deficit for STs with durations smaller than 360 d indicate that our study catchments are rather sensitive to intra-annual recharge deficits than to multi-year reduction in pre-drought water availability. Focusing on ST durations a negative correlation between ST duration and pre-drought recharge reduction is revealed. STs with 30, 60–150 and ≥360 d duration are based on 90 %, 60 %–70 % and 20 %–25 % combined recharge- and snowpack-reduction, respectively. However, the snowpack/recharge-ratio at the end of the STs is in 95 % of all simulations were below 1 %, only in 1976 we found considerable snowpack in one catchment (5 %–60 %). The most severe response in the ALP catchment is generated with a 30 d ST indicating that this catchment is more exposed to “flash droughts” (Otkin et al., 2018) due to assumingly smaller catchment storages (Staudinger et al., 2017) and/or smaller water retention ability (i.e. higher Q∕P-ratios). In comparison the LAN catchment shows in some drought years increasing streamflow deficit when longer ST durations are applied (> 120 d).
Analogous to streamflow deficit the patterns of change in minimum flow (AM7) also show a tendency for larger decrease in AM7 when shorter STs are used (Fig. 3b). Maximum AM7 reduction is ∼50 % (LAN, WIG) and ∼80 % (BRO, MEN, BIB, ALP) which is caused by ST durations ≤150 d. Longer ST durations (≥360 d) lead to increased AM7 in some cases. The different response patterns depending on drought years and ST durations highlight that drought assessment is a complex task and that multiple drought events should be analysed during stress testing to gain a comprehensive picture on streamflow drought sensitivity of a catchment. Without multiple drought years the most extreme changes in streamflow deficit or minimum flow might be missed. However, ST durations of 1–2 years as upper limit appear to be sufficient for the analysis of sensitivity.
In this study we present a hydrological model experiment to stress pre-drought recharge in order to test drought sensitivity across several headwater catchments in Switzerland. The concept of stress testing is complementary to climate change scenarios and is hence of great interest for hydrological research and water management. Event-specific stress tests with variable durations (STWORST) appear to be superior to stress tests with fixed start dates and fixed durations (STNAT). However, with STNAT a direct assessment of the severity of historical drought years and their potential intensification is possible. In general, varying ST durations show that the six study catchments have a recharge/storage-memory of around 6 to 12 months when focusing on summer low flows. From ST analysis it is apparent that recovery last 25–200 d, minimum flows during summer droughts are 50 %–80 % smaller and additional ST-induced streamflow deficits account for 10–40 d of median flow (Q50). These metrics are often-requested hydrological estimates for improved water management. A catchment classification by such hydrological metrics can help better predict future low flow hazards. It is, for example, important to note that more groundwater-dominated catchments tend to have larger streamflow deficits during drought, and more flashy catchments are more sensitive to larger decrease in minimum flow (Fig. 3). Here streamflow metrics like flashiness or the Q95∕Q50-ratio help to classify different catchments. Our results suggest that future research on stress testing should put more emphasis on event analysis and different drought (propagation) types (e.g. precipitation vs. heatwave flash droughts). However, worst-case periods from data are limited to test extreme pre-conditions with duration longer than 90–120 d as the historical climate in Switzerland provides no longer lasting “zero recharge” periods. To cope with this limitation the stress test design may include estimated recharge droughts based on return periods (e.g. 100-year recharge drought) for different stress test durations. An extension of the stress tests to more catchments, other streamflow regimes (e.g. snowmelt-dominated) and other climatic regions (i.e. varying P- and T-patterns as drivers of summer streamflow droughts) appears useful to further explain future low flow sensitivity.
Data are not freely available, but streamflow and meteorological data can be requested through the agencies (Swiss Federal Office for the Environment (FOEN) and Federal Office of Meteorology and Climatology MeteoSwiss). The hydrological model HBV light is freely available (Seibert and Vis, 2012).
All authors developed the main research idea. MiS and MaS performed the analyses and evaluated the stress tests. MiS wrote the manuscript with contributions and revisions from all authors.
The authors declare that they have no conflict of interest.
This article is part of the special issue “Hydrological processes and water security in a changing world”. It is a result of the 8th Global FRIEND–Water Conference: Hydrological Processes and Water Security in a Changing World, Beijing, China, 6–9 November 2018.
Streamflow and catchment metadata were provided by the Hydrology Division of the Swiss Federal Office for the Environment (FOEN; BAFU). We thank Irene Kohn and Marit van Tiel for their comments on the manuscript. This study contributes to the projects “Low Flows and Groundwater” (Swiss Federal Office of the Environment FOEN) and TrenDHy (German Research Foundation DFG).
Addor, N., Rössler, O., Köplin, N., Huss, M., Weingartner, R., and Seibert, J.: Robust changes and sources of uncertainty in the projected hydrological regimes of Swiss catchments, Water Resour. Res., 50, 7541–7562, https://doi.org/10.1002/2014WR015549, 2014.
Baker, D. B., Richards, R. P., Loftus, T. T., and Kramer, J. W.: A new flashiness index: Characteristics and applications to midwestern rivers and streams, J. Am. Water Resour. Assoc., 40, 503–522, https://doi.org/10.1111/j.1752-1688.2004.tb01046.x, 2004.
Mo, K. C. and Lettenmaier, D. P.: Precipitation Deficit Flash Droughts Over the United States, J. Hydrometeorol., 17, 1169–1184, https://doi.org/10.1175/JHM-D-15-0158.1, 2016.
Otkin, J. A., Svoboda, M., Hunt, E. D., Ford, T. W., Anderson, M. C., Hain, C., and Basara, J. B.: Flash Droughts: a Review and Assessment of the Challenges Imposed by Rapid-Onset Droughts in the United States, B. Am. Meteorol. Soc., 99, 911–919, https://doi.org/10.1175/BAMS-D-17-0149.1, 2018.
Pool, S., Vis, M. J. P., and Seibert, J.: Evaluating model performance: towards a non-parametric variant of the Kling-Gupta efficiency, Hydrolog. Sci. J., 63, 1941–1953, https://doi.org/10.1080/02626667.2018.1552002, 2018.
Seibert, J.: Multi-criteria calibration of a conceptual runoff model using a genetic algorithm, Hydrol. Earth Syst. Sci., 4, 215–224, https://doi.org/10.5194/hess-4-215-2000, 2000.
Seibert, J. and Vis, M. J. P.: Teaching hydrological modeling with a user-friendly catchment-runoff-model software package, Hydrol. Earth Syst. Sci., 16, 3315–3325, https://doi.org/10.5194/hess-16-3315-2012, 2012.
Staudinger, M., Weiler, M., and Seibert, J.: Quantifying sensitivity to droughts – an experimental modeling approach, Hydrol. Earth Syst. Sci., 19, 1371–1384, https://doi.org/10.5194/hess-19-1371-2015, 2015.
Staudinger, M., Stoelzle, M., Seeger, S., Seibert, J., Weiler, M., and Stahl, K.: Catchment water storage variation with elevation, Hydrol. Process., 31, 2000–2015, https://doi.org/10.1002/hyp.11158, 2017.
Stoelzle, M., Stahl, K., Morhard, A., and Weiler, M.: Streamflow sensitivity to drought scenarios in catchments with different geology, Geophys. Res. Lett., 41, 6174–6183, https://doi.org/10.1002/2014GL061344, 2014.
Van Loon, A. F., Tijdeman, E., Wanders, N., Van Lanen, H. J., Teuling, A. J., and Uijlenhoet, R.: How climate seasonality modifies drought duration and deficit, J. Geophys. Res.-Atmos., 119, 4640–4656, https://doi.org/10.1002/2013JD020383, 2014.
Vormoor, K., Rössler, O., Bürger, G., Bronstert, A., and Weingartner, R.: When timing matters-considering changing temporal structures in runoff response surfaces, Climatic change, 142, 213–226, https://doi.org/10.1007/s10584-017-1940-1, 2017.
Zappa, M. and Kan, C.: Extreme heat and runoff extremes in the Swiss Alps, Nat. Hazards Earth Syst. Sci., 7, 375–389, https://doi.org/10.5194/nhess-7-375-2007, 2007.