the Creative Commons Attribution 4.0 License.
the Creative Commons Attribution 4.0 License.
 | 16 Sep 2020
The Groundwater Drought Initiative (GDI): Analysing and understanding groundwater drought across Europe
Daniela Cuba
John P. Bloomfield
David M. Hannah
Christopher Jackson
Ben P. Marchant
Benedikt Heudorfer
Anne F. Van Loon
Hélène Bessière
Bo Thunholm
Gerhard Schubert
In Europe, it is estimated that around 65 % of drinking water is extracted from groundwater. Worryingly, groundwater drought events (defined as below normal groundwater levels) pose a threat to water security. Groundwater droughts are caused by seasonal to multi-seasonal or even multi-annual episodes of meteorological drought during which the drought propagates through the river catchment into the groundwater system by mechanisms of pooling, lagging, and lengthening of the drought signals. Recent European drought events in 2010–2012, 2015 and 2017–2018 exhibited spatial coherence across large areas, thus demonstrating the need for transboundary monitoring and analysis of groundwater level fluctuations. However, such monitoring and analysis of groundwater drought at a pan-European scale is currently lacking, and so represents a gap in drought research as well as in water management capability. To address this gap, the European Groundwater Drought Initiative (GDI), a pan-European collaboration, is undertaking a large-scale data synthesis of European groundwater level data. This is being facilitated by the establishment of a new network to co-ordinate groundwater drought research across Europe. This research will deliver the first assessment of spatio-temporal changes in groundwater drought status from ∼1960 to present, and a series of case studies on groundwater drought impacts in selected temperate and semi-arid environments across Europe. Here, we describe the methods used to undertake the continental-scale status assessment, which are more widely applicable to transboundary or large-scale groundwater level analyses also in regions beyond Europe, thereby enhancing groundwater management decisions and securing water supply.
- Article
(1043 KB) - Full-text XML
- BibTeX
- EndNote


Groundwater is the primary source for public water supply, agricultural irrigation and industry in many countries. It also supports flow and water levels in rivers, lakes, and wetlands, maintaining healthy ecosystems, and providing amenity value and supporting livelihoods associated with these areas. In the European Union (EU), about three quarters of public water supplies come from groundwater, but some areas, such as Denmark, are entirely dependent on groundwater as drinking water source (EEA, 1999). When managed appropriately, groundwater generally is a reliable resource that can sustain water demand throughout the year, and that is relatively independent from short-term climatology. However, recharge of this valuable resource depends on natural year-on-year variations in rainfall (particularly meteorological conditions during the wet season), and drought signals from major meteorological droughts may propagate into the subsurface, causing groundwater heads to fall below normal (Van Lanen and Peters, 2000). These periods of below normal groundwater levels, termed groundwater droughts, have a number of unwelcome effects, such as reduced production of groundwater from boreholes, and the drying up of groundwater-dependent ecosystems with resulting implications for wildlife and livelihoods.
Major episodes of drought often affect large areas across national boundaries. For example, the long groundwater drought in the UK from 2010–2012 showed the same drought effects over large parts of continental Europe, particularly France. Increasing awareness of transboundary drought events in Europe has resulted in a series of international research initiatives. For example, Phase 8 of the UNESCO IHP Programme has a focus on water security in a changing environment. In Europe, projects such as the ongoing EURO FRIEND-Water Low Flow and Drought (http://ne-friend.bafg.de/servlet/is/7402/, last access: 28 July 2020) and the related WATCH (2007–2011, http://www.eu-watch.org/, last access: 28 July 2020), DEWFORA (2011–2014), DROUGHT-R&SPI (2011–2014, https://www.wur.nl/en/show/drought-r-spi.htm, last access: 28 July 2020), and DrIVER (2014–2017, https://www.drought.uni-freiburg.de/, last access: 28 July 2020) have all focussed on water resources and drought. In the UK, the Natural Environment Research Council (NERC) commissioned the UK Drought and Water Scarcity Programme (2013–2019, https://nerc.ukri.org/research/funded/programmes/droughts/, last access: 28 July 2020), consisting of several projects that will support decision-making regarding droughts and water scarcity. The EURO FRIEND-Water Low Flow and Drought project has subsequently established an enduring Low Flow and Drought network (LFD network) with a focus on surface water droughts in Europe. However, there is currently no co-ordination of relevant groundwater information or groundwater drought research across Europe, and no groundwater drought status is monitored, or its impacts assessed at the continental scale.
In this context, a new pan-European project, the Groundwater Drought Initiative (GDI) has been established to bring together data holders of existing groundwater level data and researchers with an interest in groundwater drought across Europe. The main objectives of the GDI are to (i) assess groundwater drought status across Europe from 1960 to the present, (ii) assess and analyse the impacts of major groundwater droughts at the European scale, and to (iii) establish enduring international collaborations and partnerships to enable the development of impactful research into groundwater drought. This paper describes the background to the GDI and introduces the methodological approach that is being developed to assess groundwater status at the European scale (i.e. the first objective of the GDI), using selected groundwater level data from across Europe.
2.1 Groundwater drought and impacts of groundwater droughts
Hydrological droughts propagate from a meteorological signal (precipitation deficit), through soils (soil moisture deficit), and, via reduced recharge, cause lowered groundwater levels. The spatio-temporal characteristics of the drought signal change as it passes through the terrestrial water cycle (Changnon, 1987; Peters et al., 2003; Tallaksen and Van Lanen, 2004; Van Loon, 2015). Due to the potentially large storage changes in aquifers, groundwater systems act to attenuate and add lags to meteorological drought signals, thus mitigating the effects of relatively short monthly to sub-seasonal droughts (Tallaksen and Van Lanen, 2004). However, groundwater resources are highly susceptible to prolonged (multi-seasonal to multi-annual) episodes of drought, where pooling, lagging and lengthening of multiple consecutive sub-seasonal or sub-annual drought periods can lead to extended drought events in groundwater systems (Van Loon and Van Lanen, 2012; Van Loon, 2015). The efficacy of these pooling, lagging and lengthening effects depends on catchment and aquifer characteristics (Van Lanen et al., 2013) and may be impacted by anthropogenic influences such as groundwater abstraction (Bloomfield and Marchant, 2013; Bloomfield et al., 2015; Tallaksen et al., 1997; Tallaksen and Van Lanen, 2004; Van Loon and Laaha, 2015; Van Loon et al., 2016).
The impacts of groundwater drought are wide-ranging and have important consequences for society and ecosystems. For example, public water supply, energy production and industry, agriculture and livestock farming, freshwater and terrestrial ecosystems, tourism and recreation may all be adversely impacted by major droughts (Lange et al., 2017; Stahl et al., 2016). Specifically, a reduction in deployable output from boreholes due to lower than normal groundwater levels during major droughts may also lead to costly restrictions to public supply, or to reduced abstractions for agriculture and industry, thus causing economic strain to society (Van Loon, 2015). Good examples of this are the last major groundwater drought in the UK in 2010–2012 when seven water companies in south and east England had to impose temporary use bans (colloquially known as “hosepipe bans”) on about 20 million people, including the farming sector in spring of 2012, and the 2015 drought in Europe with dried up wells and boreholes leading to issues providing drinking water for cattle (e.g. in Germany; Van Lanen et al., 2016).
2.2 The challenge of developing a Europe-wide groundwater drought assessment
Improved understanding of drought propagation in similar aquifers (such as the Chalk of the Anglo-Paris Basin) and in a wider range of hydrogeological settings across Europe would provide insights into generic groundwater drought processes, opening the possibility for a systematic analysis of drought propagation from meteorological, soil moisture and surface water to groundwater droughts at the continental scale (Van Lanen et al., 2016), and thus contribute to improved preparedness and more informed decisions associated with the use of drought triggers.
During the 2015 event, the EURO FRIEND-Water LFD-network collated and analysed data to characterise meteorological and streamflow drought conditions, and impacts across Europe (Ionita et al., 2017; Laaha et al., 2017; Van Lanen et al., 2016). However, an equivalent data synthesis and analysis of the 2015 groundwater drought situation was not possible due to the lack of co-ordination of groundwater level data and research across Europe (Laaha et al., 2017; Van Lanen et al., 2016; Van Loon et al., 2017). This highlights a major gap in European drought research capability. In addition, there have recently been initiatives to better inform policy makers, water managers, and the general public of drought status, for example in Europe through on-line monitoring services such as the European Drought Observatory (EDO, https://edo.jrc.ec.europa.eu/edov2/php/index.php?id=1000, last access: 28 July 2020) and the European Drought Centre (EDC, http://europeandroughtcentre.com/, last access: 28 July 2020). The EDO is mapping droughts and drought indicators but does not include groundwater droughts. EDC hosts the European Drought Reference (EDR) database, a collection of data on historic European meteorological and streamflow droughts, and a web-based viewer of meteorological drought status. EDC also hosts the European Drought Impact Report Inventory (EDII), an account of documented impacts of droughts. However, the EDII does not distinguish impacts of groundwater droughts and up to date, there is no attempt to establish a stand-alone database for the groundwater domain.
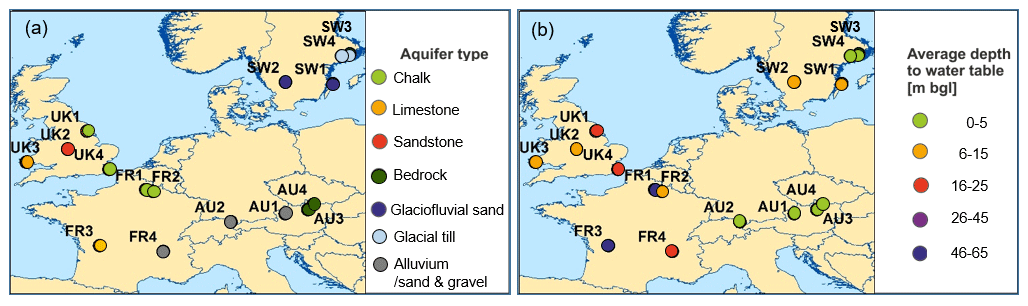
Figure 1Site map of groundwater gauges categorized by (a) aquifer type, and (b) average depth to water table in metres below ground level (m b.g.l.). The average depth to water table was calculated based on simulated values of the site's groundwater levels from 1955–2018. Map image is the intellectual property of Esri and is used herein under license. Copyright © 2019 Esri and its licensors. All rights reserved.
In summary, despite some early attempts to highlight the importance of research into groundwater droughts across Europe (Hisdal et al., 2004; Peters et al., 2001; Van Lanen and Peters, 2000) recent projects and initiatives mentioned above lack a systematic approach of clearly integrating groundwater droughts into their drought analysis. With few exceptions (Van Loon et al., 2013), they focus instead on droughts in the driving meteorology and consequences of droughts only in the soil and surface water compartments of the terrestrial water cycle. Therefore, the following research gaps can been identified: (i) although the skills are present across Europe, there is a major gap in European drought research capability related to groundwater droughts, primarily due to a lack of co-ordination between hydrogeologists and hydrologists with appropriate expertise (Staudinger et al., 2019); (ii) there is a gap in research capability to provide a timely, integrated and consistent overview of groundwater level data at the continental scale under conditions of drought, and hence to assess the status of groundwater drought in a manner comparable with other hydrometeorological drought signals; and, (iii) there has to date been no systematic attempt to undertake an assessment of the impacts of groundwater droughts at the continental scale.
The GDI aims to deliver the first pan-European assessment of groundwater drought status (∼1960 to present), and will analyse the most recent European groundwater droughts, thereby addressing the research gaps identified above. The GDI is collaborating on a state-by-state basis with dataholders and researchers to collect available groundwater level data and site characteristics (including human influence) from unconfined aquifers across Europe. In this section, we introduce the GDI workflow for groundwater drought assessment with examples from four different European countries.
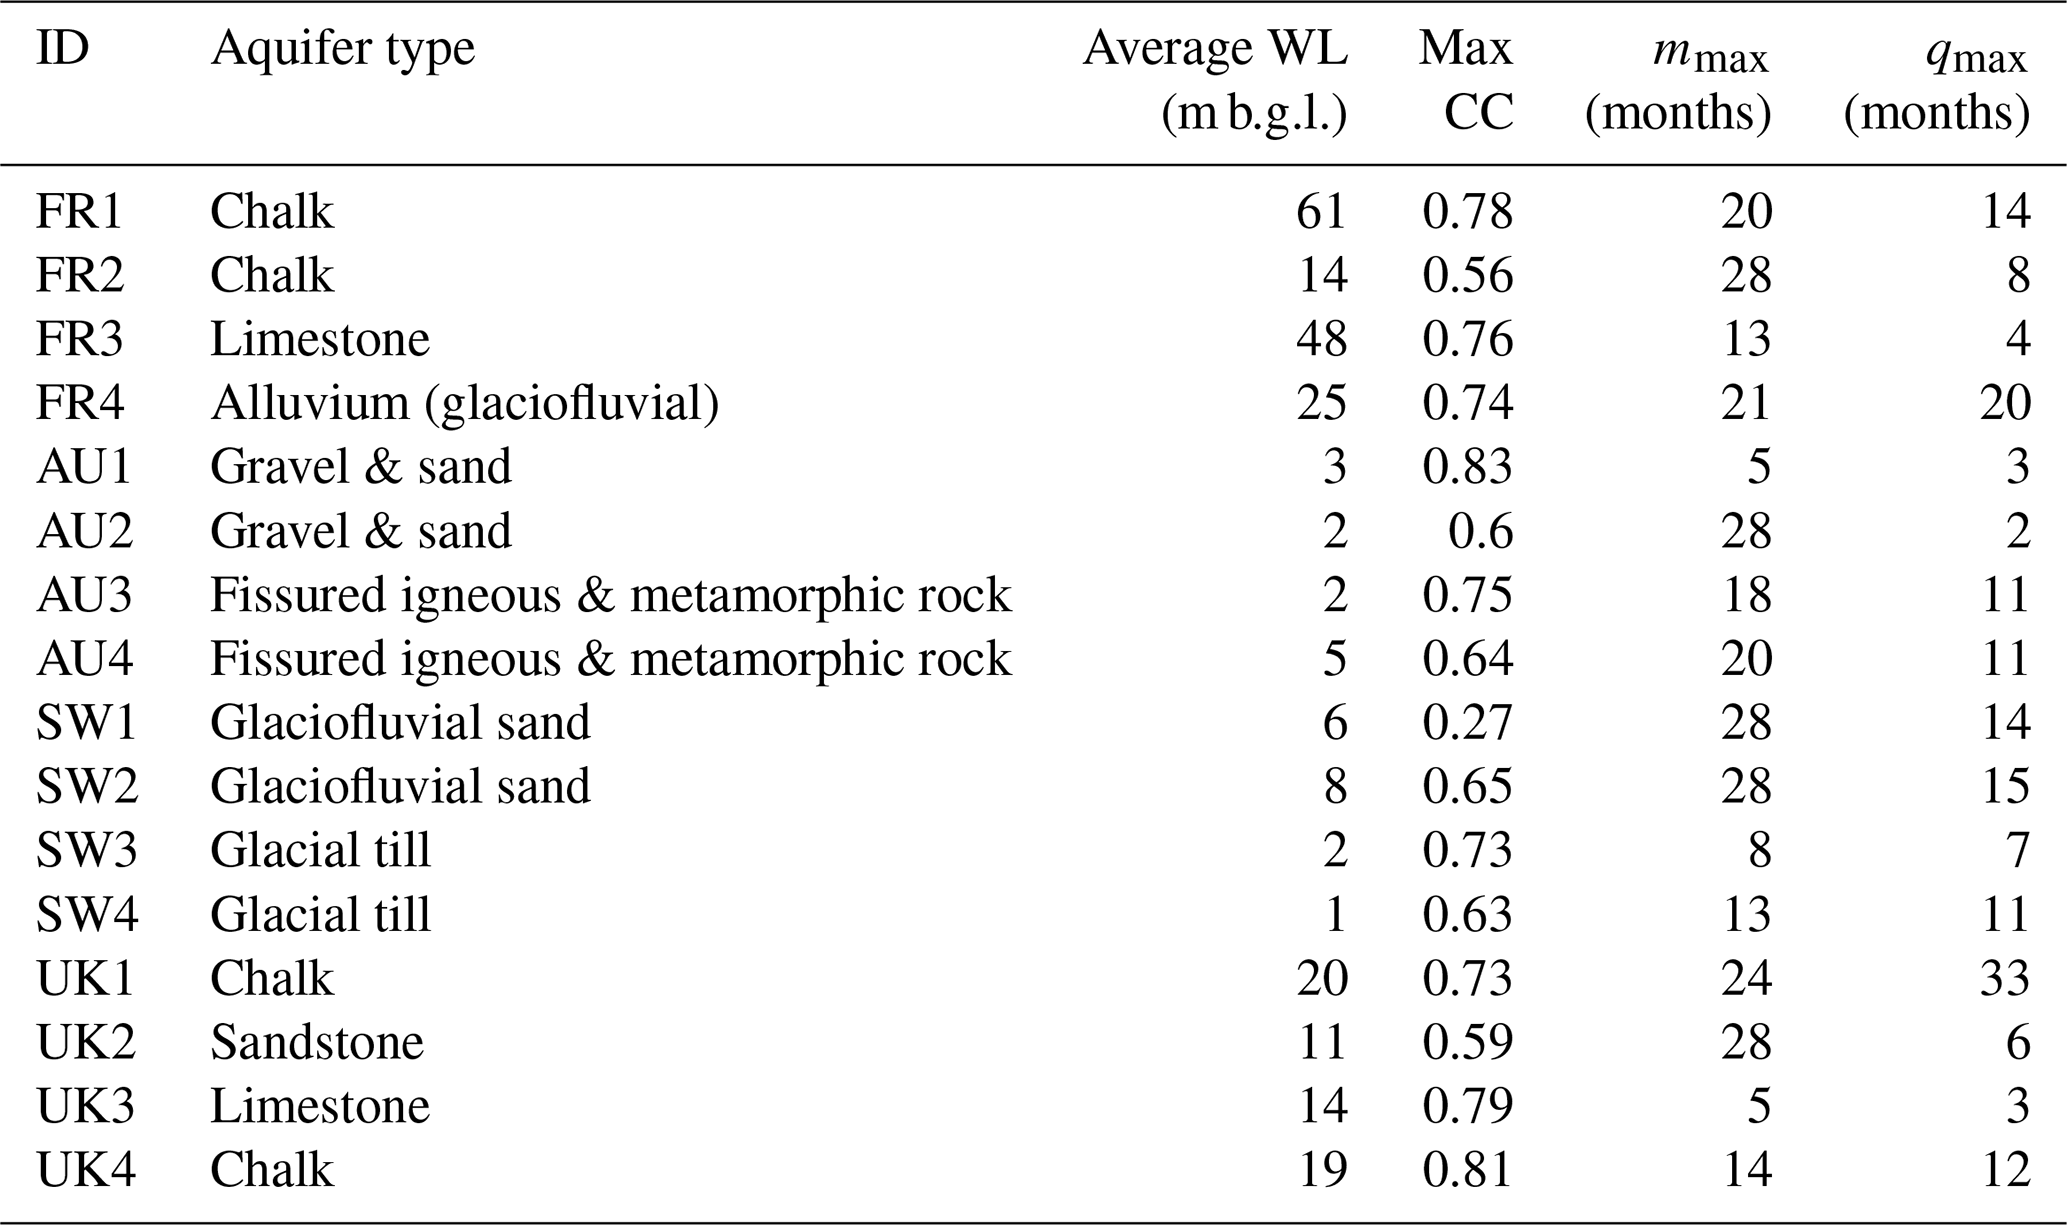
Table 1Table showing aquifer types per site, average water level in metres below ground level (m bgl; average depth was calculated based on the interpolated groundwater levels 1955–2018), maximum cross-correlation (CC) between SPI and SGI, autocorrelation range (mmax) of the SGIs, and the accumulation period (qmax) with maximum cross-correlation between SPI and SGI.
3.1 Study sites
Sixteen sites from four countries (Austria, France, UK, and Sweden) have been chosen for analysis and to illustrate the GDI workflow. The main selection criteria for these sites were the availability of relatively long, mostly continuous series of groundwater level data from unconfined aquifers and the representation of different hydrogeological settings. For a brief comparison between aquifer settings, we additionally chose two sites from confined aquifers (SW3 and SW4). The spatial distribution of the chosen sites, Fig. 1, covers different parts of France and Austria (though with one pair of neighbouring boreholes respectively, namely FR1 and FR2 in France, and AU3 and AU4 in Austria), and the southern parts of the UK and Sweden. The aquifer types differ across the sites (Table 1), and include fissured igneous and metamorphic rocks, fractured limestone aquifers such as the Chalk of the Anglo-Paris basin, consolidated sandstones and superficial glacio-fluvial and alluvium deposits. All groundwater level data were obtained from publicly available databases of groundwater levels for each country respectively (Austria: https://ehyd.gv.at/, last access: 28 July 2020, France: https://ades.eaufrance.fr/Recherche/Index/Piezometre?g=d5acb7 (last access: 28 July 2020), Sweden: https://www.sgu.se/produkter/geologiska-data/oppna-data/grundvatten-oppna-data/grundvattennivaer-tidsserier/ (last access: 28 July 2020), UK: https://www.bgs.ac.uk/products/hydrogeology/WellMaster.html, last access: 28 July 2020).
3.2 Methodology
Figure 2 shows the overall workflow of the GDI. It is based on the analysis method developed by Marchant and Bloomfield (2018) that enables irregularly observed groundwater level data from a range of locations and variety of periods of observations to first be regularised into a common analysis frame, then standardised, and finally then to be used for characterisation of spatio-temporal variation in extracted episodes of groundwater drought. The raw time series of groundwater level data for each site is first pre-processed to provide a regularised monthly groundwater level time series using newly developed R-scripts run on a SHINY-interface. The regularisation step entails harmonisation of the observed groundwater levels to regular monthly time steps and stochastic modelling of groundwater levels (Marchant et al., 2016) to infill data gaps using the temporal correlation amongst the data and a modelled relationship with monthly precipitation data, obtained from the E-OBS gridded dataset (Haylock et al., 2008). This is achieved by estimating and predicting from a linear mixed model of the groundwater levels where the fixed effects are an impulse response function of rainfall plus a seasonal term. Random effects are temporally correlated according to a Matérn function – see Marchant and Bloomfield (2018) for a fuller description.
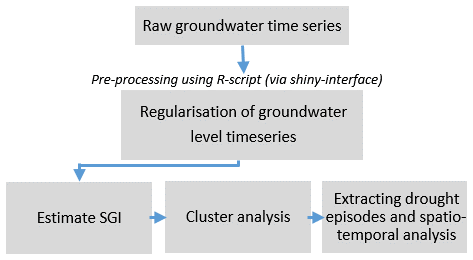
A variant of the Standardised Precipitation Index (SPI), the Standardised Groundwater level Index (SGI) approach (Bloomfield and Marchant, 2013; McKee et al., 1993; Svoboda and Fuchs, 2016) is then used to standardise the groundwater level data. The SGI is a non-parametric approach, which assigns a standardised value to the reconstructed groundwater levels for each month, thereby resulting in normalised monthly indices that allow for comparison across the sites (see Bloomfield and Marchant, 2013). Additionally, cluster analysis using the k-means approach is undertaken to obtain information about similarities between hydrographs across the study area. Due to the limited number of sites that have been modelled and analysed in the present study, only two clusters have been identified to illustrate the approach. As a more extensive set of hydrographs becomes available, the number of clusters used may be increased to help identify spatially coherent groundwater hydrographs and hence coherent groundwater drought behaviour. Simple statistics are applied to each site for comparison of drought frequency and duration across the sixteen sites. Drought is thereby defined as intervals with SGI < 0, in which there is at least one occurrence of SGI ≤ −1, following the convention of the World Meteorological Organization (Svoboda et al., 2012).
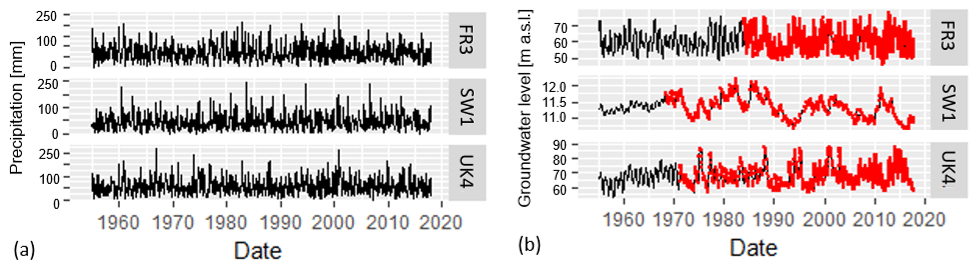
Figure 3(a) Time series of precipitation (mm/month), and (b) observed (red) and simulated (black) time series of groundwater levels for selected sites (FR3, SW1, and UK4) in metres above sea level (m a.s.l.). Daily precipitation data was extracted from the E-OBS dataset and used to calculate the monthly accumulated rainfall for each site.
3.3 Preliminary results
Data availability for the selected sites varied and ranged between near-complete time series from 1955–2018 (UK1) to datasets with observations starting only in the 1990s (AU3, AU4, UK3). An example of the driving precipitation data, the observed groundwater levels, and the regularised groundwater level time series for three of the sites is shown in Fig. 3, demonstrating different degrees of flashiness (response of the aquifer to precipitation events) across the sites.
Table 1 shows cross-correlation (CC) between the estimated SGI for each of the sixteen sites and the corresponding SPI for the period 1955 to 2018. There was a reasonably strong correlation (>0.5) between the SGI time series and the corresponding SPI series accumulated over an appropriate number of months for all sites except SW1. These accumulation periods (qmax), which maximise the correlation, were determined for each site and ranged 2–33 months. The CC can potentially be improved by selecting a shorter time period with a later onset, and by choosing sites with more homogenously distributed observations across time, thereby avoiding decadal gaps in the data. Table 1 also shows the maximum autocorrelation range (mmax) in the estimated SGI, a measure of the “memory” of groundwater levels at each site, ranging 5–28 months.
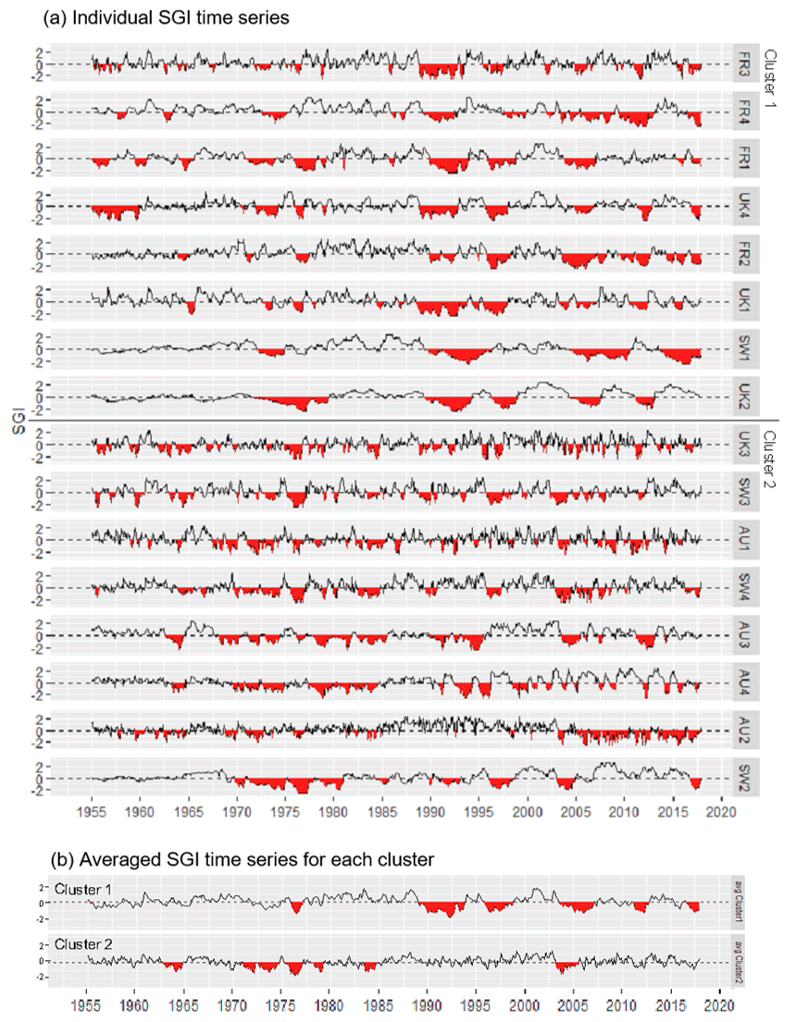
Figure 4Combined graphic showing (a) the Standardized Groundwater level Index (SGI) for each site, and (b) the time series of calculated mean SGI values for each cluster, deriving from k-means clustering.
The SGI time series for the sixteen sites (Fig. 4a) demonstrate the different response patterns to driving meteorology. Some of the sites are characterised by fewer, but longer droughts (e.g. SW1, SW2, UK2) and others exhibit more frequent, but shorter drought periods (e.g. AU1, UK3). This is also reflected in differences in mmax and qmax, which are lower for the sites with frequent, short droughts, and higher for the sites with less frequent, longer droughts (Table 1).
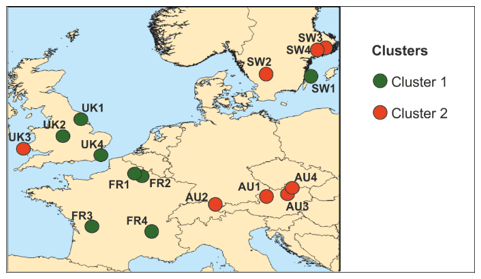
Figure 5Geographical distribution of determined clusters. Map image is the intellectual property of Esri and is used herein under license. Copyright © 2019 Esri and its licensors. All rights reserved.
The k-means clustering in two groups (Fig. 5) highlights the divide between slow- and fast-responding systems (Fig. 4b), Cluster 1 and Cluster 2 respectively. Even though only a limited number of sites are included in this analysis, there appears to be some spatial coherence of the hydrographs based on the two clusters. For example, there appears to be spatial coherence among the Austrian sites. However, the identification of spatial coherence in the clusters needs to be tested with the inclusion of more hydrographs in future analyses. In addition to the clustering capturing systematic differences in the responsiveness or flashiness of the hydrographs, the clusters also appear to reflect a systematic difference in the degree to which sites in each cluster were impacted by the drought in the early 1990s, with Cluster 1 being highly impacted and Cluster 2 showing no significant impact of drought. This can be seen both in the individual SGI hydrographs (Fig. 4a) and in the differences in the mean hydrographs of each cluster (Fig. 4b). In contrast, a major drought episode in the summer of 1976 is present in both clusters and most of the sites.
Table 2Summary table of number of droughts and drought duration (in months) for each site for the period 1955–2018.
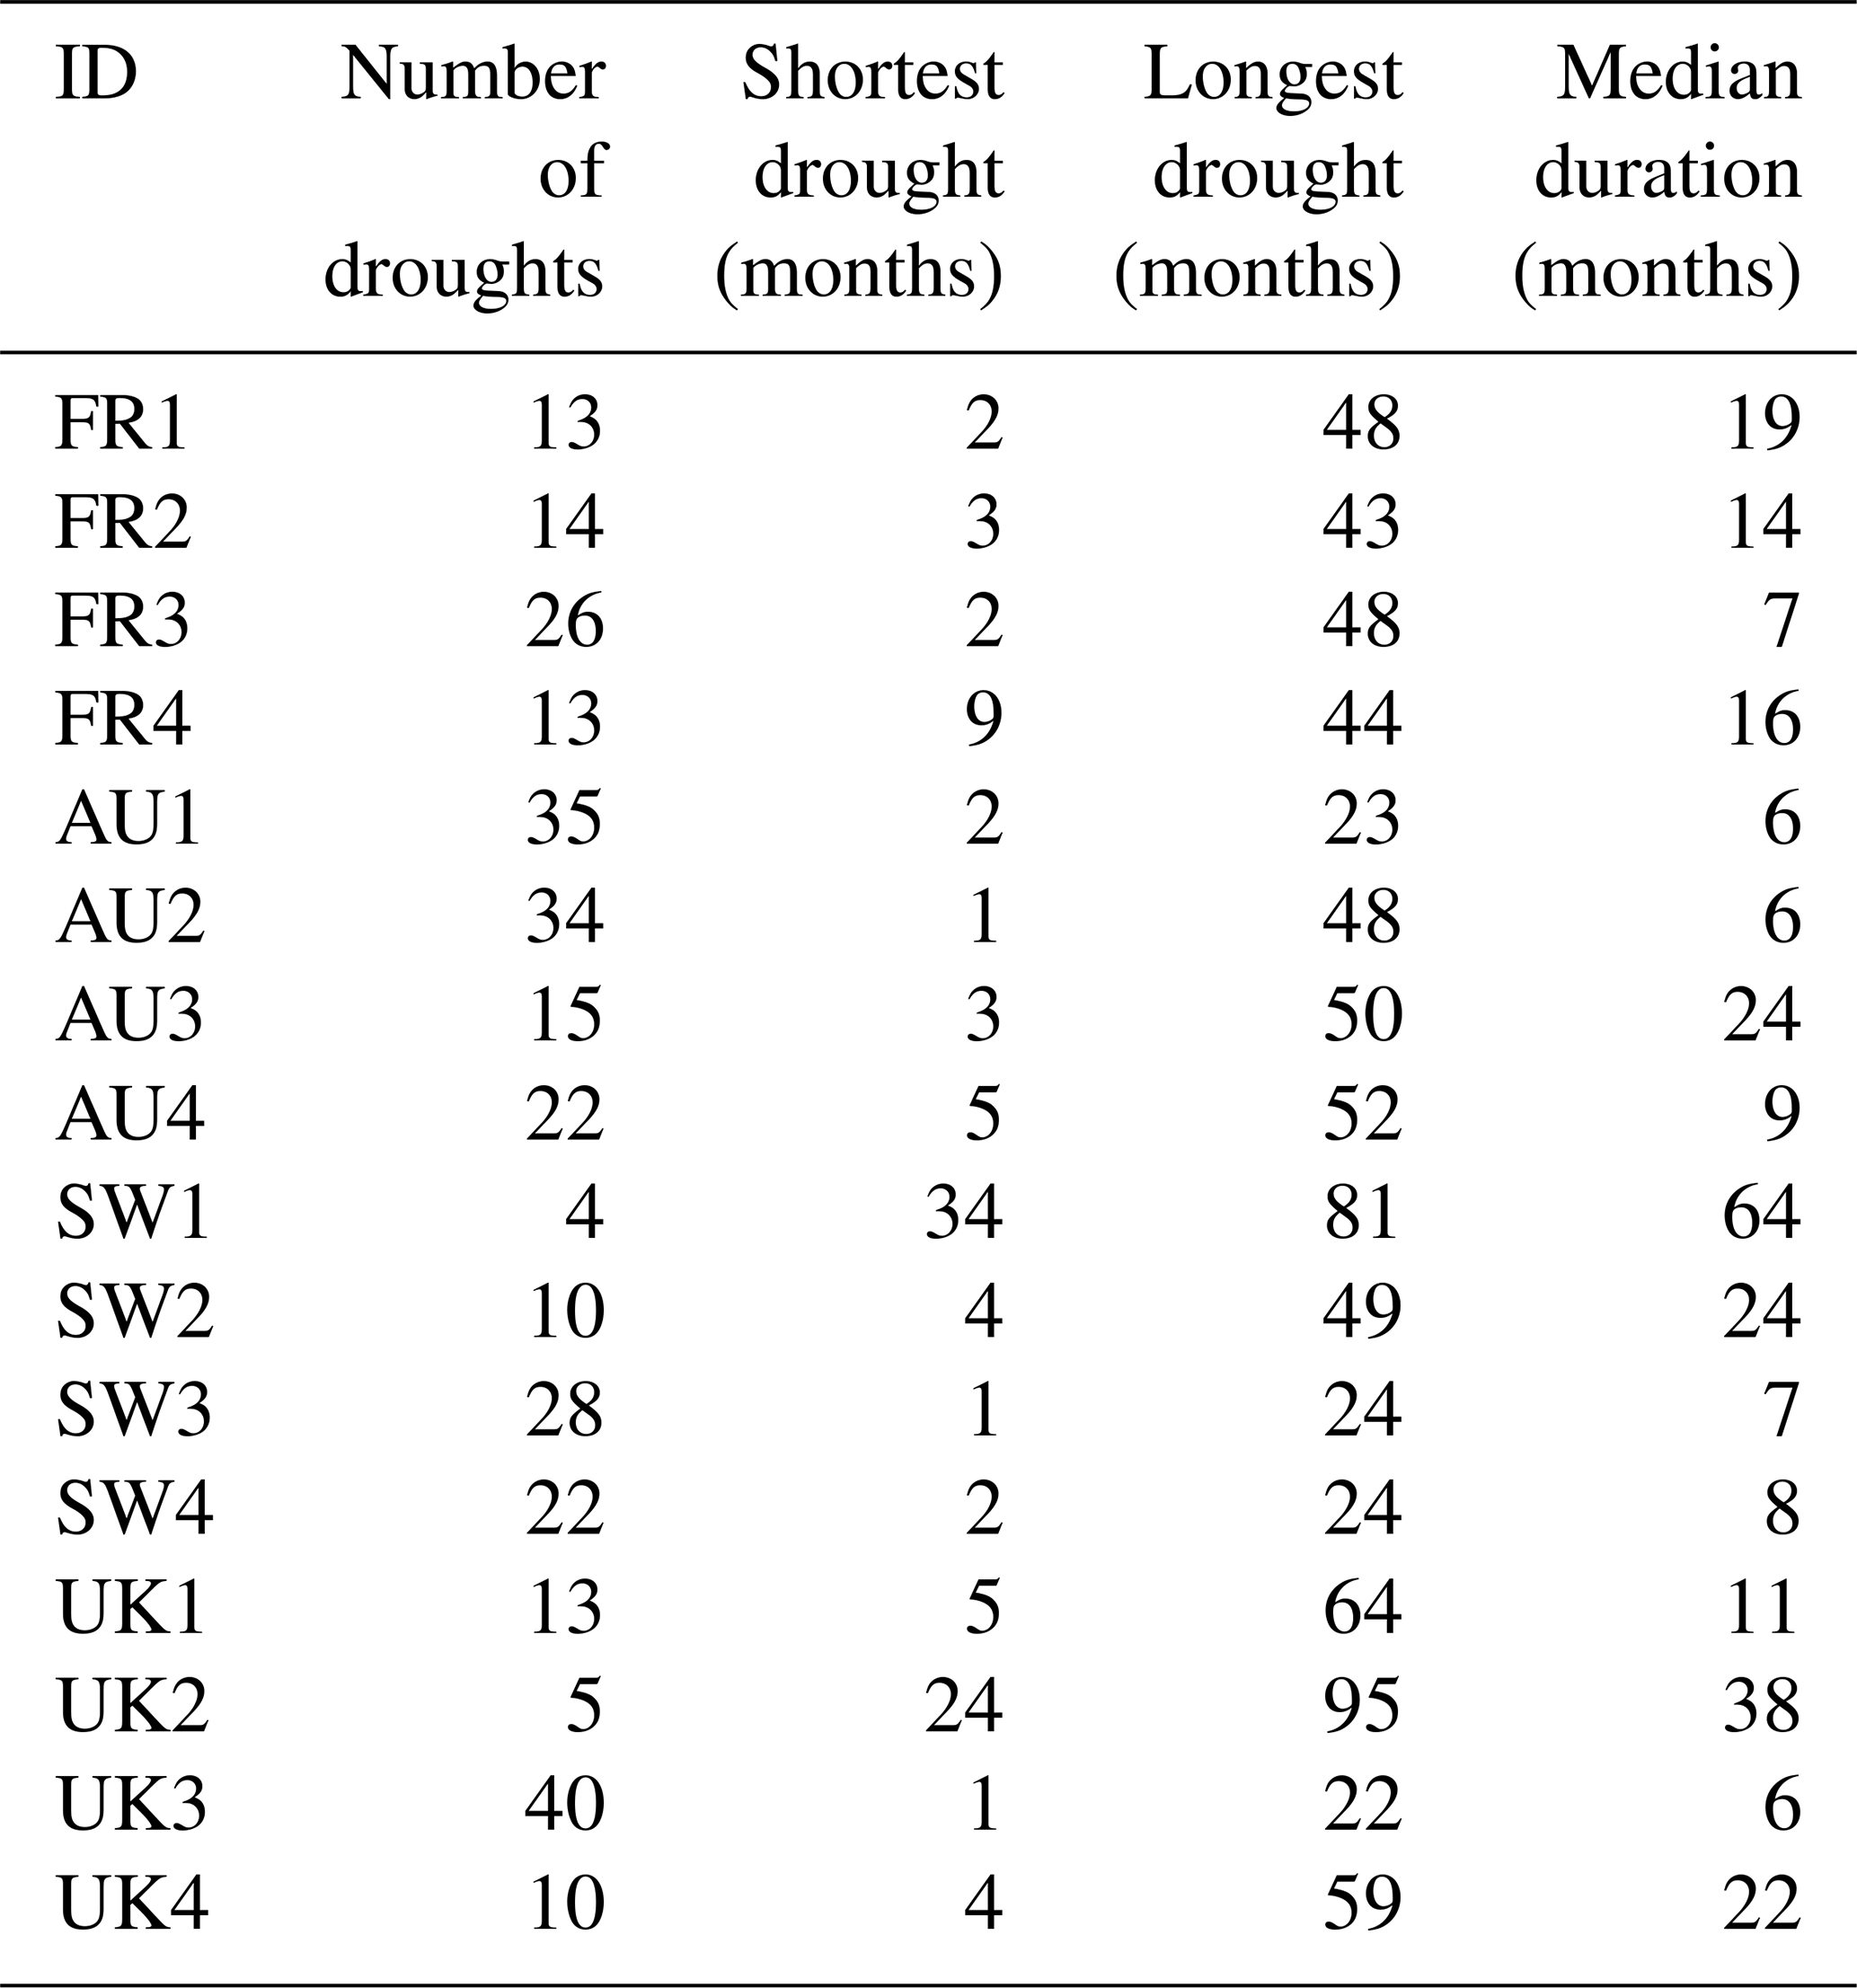
Drought statistics related to drought frequency, duration and intensity can be extracted from the prepared SGI series. For illustration, Table 2 summarises drought frequency and duration for each site. It shows a total number of droughts per site between as few as four 4 (SW1) to as many as 40 (UK3). It is noteworthy that the median drought duration differs substantially between aquifer types, ranging for example from only 6–7 months at limestone (FR3 and UK3) and gravel/sand sites (AU1 and AU2), to 11–22 at Chalk sites (FR1, FR2, UK1, and UK4), and 24–64 months in glaciofluvial sand aquifers (SW1, SW2); thereby confirming the importance of aquifer type in drought propagation as previously observed in other studies (Bloomfield and Marchant, 2013; Bloomfield et al., 2015; Tallaksen et al., 1997; Tallaksen and Van Lanen, 2004; Van Lanen et al. 2013; Van Loon and Laaha, 2015; Van Loon et al., 2016).
In this paper, the methodological approach for a pan-European groundwater drought assessment was presented and applied to selected sites across four countries and different hydrogeological settings across Europe. The analysis shows that groundwater level time series can be successfully regularised using a stochastic model, and that the standardisation procedure using the Standardised Groundwater level Index (SGI) allows for comparison between sites. Varying strength of observed relationships between drought characteristics of the sites were found in terms of geographical proximity and between common types of aquifers; thereby supporting the theory that hydrogeological settings play an important role in groundwater drought propagation.
Further improvement to the analysis procedure will be undertaken in the future workflow of the GDI, such as using more advanced clustering techniques and advances in the methodology for groundwater drought event extraction from the dataset. This can be done for example by using sequent peak algorithms to collate separate drought events during which the aquifer has not fully recovered yet from the first drought episode. An improved analysis of drought events, for example by using mid-points of droughts and calculating the percentage of sites in drought at a given time, will allow for a better description of their spatio-temporal distribution and evolution.
Although the focus of the analysis is on sites relatively unaffected by abstraction or irrigation returns, identification of sites with poor correlation between precipitation and groundwater will present an opportunity for research into anthropogenic effects on groundwater droughts to allow distinction between climate and human affected droughts. In addition, it is hoped that comparative studies of the impacts of groundwater drought between semi-arid regions, e.g. southern Europe, and more temperate north-western Europe could provide additional, complementary insights into to the impacts of extremely low groundwater levels during droughts, thus informing future drought management planning across Europe.
The methodology used in the GDI is generic and could also be employed beyond Europe to other geographic regions. The approach is equally applicable to high groundwater level stands. Consequently, generic insights from the GDI will be of interest to the international groundwater research community, particularly to those interested in better understanding of extreme events in groundwater.
The data presented here are from an ongoing and yet incomplete project. The datasets generated during the current study are available on request from the corresponding authors.
JPB, DMH and AFVL conceptualised overarching research aims and secured funding, BPM, JPB and DC developed methods and models, DC performed numeric modelling and statistical analysis, HB, BT, and GH provided data and expertise, BB collated and visualised data and wrote the original draft, all co-authors reviewed and provided feedback.
The authors declare that they have no conflict of interest.
This article is part of the special issue “Hydrological processes and water security in a changing world”. It is a result of the 8th Global FRIEND-Water Conference: Hydrological Processes and Water Security in a Changing World, Beijing, China, 6–9 November 2018.
Bentje Brauns, John P. Bloomfield, Christopher Jackson, Ben P. Marchant, and Daniela Cuba publish this paper with the permission of the Executive Director of the British Geological Survey (UK Research and Innovation, UKRI). We acknowledge the E-OBS dataset from the EU-FP6 project ENSEMBLES (http://ensembles-eu.metoffice.com/, last access: 28 July 2020) and the data providers in the ECA&D project (http://www.ecad.eu, last access: 28 July 2020).
This research has been supported by the Natural Environment Research Council (grant no. NE/R004994/1).
Bloomfield, J. P. and Marchant, B. P.: Analysis of groundwater drought building on the standardised precipitation index approach, Hydrol. Earth Syst. Sci., 17, 4769–4787, https://doi.org/10.5194/hess-17-4769-2013, 2013.
Bloomfield, J. P., Marchant, B. P., Bricker, S. H., and Morgan, R. B.: Regional analysis of groundwater droughts using hydrograph classification, Hydrol. Earth Syst. Sci., 19, 4327–4344, https://doi.org/10.5194/hess-19-4327-2015, 2015.
Changnon, S. A.: Detecting drought conditions in Illinois, Illinois State Water Survey, Champaign, USA, available at: https://www.isws.illinois.edu/pubdoc/C/ISWSC-169.pdf (last access: 24 July 2020), Circular, 169, 1987.
European Environment Agency (EEA): Groundwater quality and quantity in Europe, European Environment Agency, Copenhagen, Denmark, 123 pp., 1999.
Haylock, M. R., Hofstra, N., Klein Tank, A. M. G., Klok, E. J., Jones, P. D., and New, M.: A European daily high-resolution gridded dataset of surface temperature and precipitation, J. Geophys. Res., 113, D20119, https://doi.org/10.1029/2008JD010201, 2008.
Hisdal, H., Clausen, B., Gustard, A., Peters, E., and Tallaksen, L. M.: Event definitions and indices, in: Hydrological drought-processes and estimation methods for streamflow and groundwater, Developments in water sciences 48, edited by: Tallaksen, L. M. and Van Lanen, H. A. J., Elsevier Sciences B.V., Amsterdam, Netherlands, 139–198, 2004.
Ionita, M., Tallaksen, L. M., Kingston, D. G., Stagge, J. H., Laaha, G., Van Lanen, H. A. J., Scholz, P., Chelcea, S. M., and Haslinger, K.: The European 2015 drought from a climatological perspective, Hydrol. Earth Syst. Sci., 21, 1397–1419, https://doi.org/10.5194/hess-21-1397-2017, 2017.
Laaha, G., Gauster, T., Tallaksen, L. M., Vidal, J.-P., Stahl, K., Prudhomme, C., Heudorfer, B., Vlnas, R., Ionita, M., Van Lanen, H. A. J., Adler, M.-J., Caillouet, L., Delus, C., Fendekova, M., Gailliez, S., Hannaford, J., Kingston, D., Van Loon, A. F., Mediero, L., Osuch, M., Romanowicz, R., Sauquet, E., Stagge, J. H., and Wong, W. K.: The European 2015 drought from a hydrological perspective, Hydrol. Earth Syst. Sci., 21, 3001–3024, https://doi.org/10.5194/hess-21-3001-2017, 2017.
Lange, B., Holman, I., and Bloomfield, J. P.: A framework for a joint hydro-meteorological-social analysis of drought, Sci. Total Environ., 578, 297–306, https://doi.org/10.1016/j.scitotenv.2016.10.145, 2017.
Marchant, B. P., Mackay, J., and Bloomfield, J. P.: Quantifying uncertainty in predictions of groundwater levels using formal likelihood methods, J. Hydrol., 540, 699–711, https://doi.org/10.1016/j.jhydrol.2016.06.014, 2016.
Marchant, B. P. and Bloomfield, J. P.: Spatio-temporal modelling of the status of groundwater droughts, J. Hydrol., 564, 397–413, https://doi.org/10.1016/j.jhydrol.2018.07.009, 2018.
McKee, T. B., Doesken, N. J., and Kleist, J.: The relationship of drought frequency and duration to time scales, in: Proceedings of the 8th Conference on Applied Climatology, Anaheim, USA, 17–22 January 1993, 179–184, 1993.
Peters, E., Torfs, P. J. J. F., Van Lanen, H. A. J., and Bier, G.: Propagation of drought through groundwater – a new approach using linear reservoir theory, Hydrol. Process., 17, 3023–3040, https://doi.org/10.1002/hyp.1274, 2003.
Stahl, K., Kohn, I., Blauhut, V., Urquijo, J., De Stefano, L., Acácio, V., Dias, S., Stagge, J. H., Tallaksen, L. M., Kampragou, E., Van Loon, A. F., Barker, L. J., Melsen, L. A., Bifulco, C., Musolino, D., de Carli, A., Massarutto, A., Assimacopoulos, D., and Van Lanen, H. A. J.: Impacts of European drought events: insights from an international database of text-based reports, Nat. Hazards Earth Syst. Sci., 16, 801–819, https://doi.org/10.5194/nhess-16-801-2016, 2016.
Staudinger, M., Stoelzle, M., Cochand, F., Seibert, J., Weiler, M., and Hunkeler, D.: Your work is my boundary condition!: Challenges and approaches for a closer collaboration between hydrologists and hydrogeologists, J. Hydrol., 571, 235–243, https://doi.org/10.1016/j.jhydrol.2019.01.058, 2019.
Svoboda, M., Hayes, M., and Wood, D.: Standardized precipitation index user guide, World Meteorological Organization, Geneva, Switzerland, 24 pp., 2012.
Svoboda, M. and Fuchs, B. A.: Handbook of drought indicators and indices, in: Integrated Drought Management Programme (IDMP), integrated Drought Management Tools and Guidelines Series 2, World Meteorological Organization (WMO) and Global Water Partnership (GWP), Geneva, Switzerland, 52 pp., 2016.
Tallaksen, L. M., Madsen, H., and Clausen, B.: On the definition and modelling of streamflow drought duration and deficit volume, Hydrol. Sci. J., 42, 15–33, https://doi.org/10.1080/02626669709492003, 1997.
Tallaksen, L. M. and Van Lanen, H. A. J. (Eds.): Hydrological drought: processes and estimation methods for streamflow and groundwater, Elsevier, Oxford, UK, 579 pp., 2004.
Van Lanen, H. A. J. and Peters, E.: Definition, effects and assessment of groundwater droughts, in: Drought and Drought Mitigation in Europe, Advances in Natural and Technological Hazards Research, edited by: Vogt, J. V. and Somma, F., Springer, Dordrecht, Netherlands, 14, 49–61, https://doi.org/10.1007/978-94-015-9472-1_4, 2000.
Van Lanen, H. A. J., Wanders, N., Tallaksen, L. M., and Van Loon, A. F.: Hydrological drought across the world: impact of climate and physical catchment structure, Hydrol. Earth Syst. Sci., 17, 1715–1732, https://doi.org/10.5194/hess-17-1715-2013, 2013.
Van Lanen, H. A. J., Laaha, G., Kingston, D. G., Gauster, T., Ionita, M., Vidal, J. P., Vlnas, R., Tallaksen, L. M., Stahl, K., Hannaford, J., Delus, C., Fendekova, M., Mediero, L., Prudhomme, C., Rets, E., Romanowicz, R. J., Gailliez, S., Wong, W. K., Adler, M. J., Blauhut, V., Caillouet, L., Chelcea, S., Frolova, N., Gudmundsson, L., Hanel, M., Haslinger, K., Kireeva, M., Osuch, M., Sauquet, E., Stagge, J. H., and Van Loon, A. F.: Hydrology needed to manage droughts: the 2015 European case, Hydrol. Process., 30, 3097–3104, https://doi.org/10.1002/hyp.10838, 2016.
Van Loon, A. F. and Van Lanen, H. A. J.: A process-based typology of hydrological drought, Hydrol. Earth Syst. Sci., 16, 1915–1946, https://doi.org/10.5194/hess-16-1915-2012, 2012.
Van Loon, A. F. and Van Lanen, H. A. J.: Making the distinction between water scarcity and drought using an observation-modeling framework, Water Resour. Res., 49, 1483–1502, https://doi.org/10.1002/wrcr.20147, 2013.
Van Loon, A. F.: Hydrological drought explained, Wiley Interdiscip. Rev. Water, 2, 359–392, https://doi.org/10.1002/wat2.1085, 2015.
Van Loon, A. F. and Laaha, G.: Hydrological drought severity explained by climate and catchment characteristics, J. Hydrol., 526, 3–14, https://doi.org/10.1016/j.jhydrol.2014.10.059, 2015.
Van Loon, A. F., Gleeson, T., Clark, J., Van Dijk, A. I., Stahl, K., Hannaford, J., Di Baldassarre, G., Teuling, A. J., Tallaksen, L. M., and Uijlenhoet, R.: Drought in the Anthropocene, Nat. Geosci., 9, 89, https://doi.org/10.1038/ngeo2646, 2016.
Van Loon, A. F., Kumar, R., and Mishra, V.: Testing the use of standardised indices and GRACE satellite data to estimate the European 2015 groundwater drought in near-real time, Hydrol. Earth Syst. Sci., 21, 1947–1971, https://doi.org/10.5194/hess-21-1947-2017, 2017.
groundwater droughtscan limit supply, making it crucial to understand their regional connection. The Groundwater Drought Initiative (GDI) assesses spatial patterns in historic—recent groundwater droughts across Europe for the first time. Using an example dataset, we describe the background to the GDI and its methodological approach.