the Creative Commons Attribution 4.0 License.
the Creative Commons Attribution 4.0 License.
 | 16 Sep 2020
Linking drought indices to impacts in the Liaoning Province of China
Miaomiao Ma
Juan Lv
Zhicheng Su
Jamie Hannaford
Hongquan Sun
Yanping Qu
Zikang Xing
Lucy Barker
Yaxu Wang
Drought is an inherent meteorological characteristic of any given region, but is particularly important in China due to its monsoon climate and the “three ladder” landform system. The Chinese government has constructed large-scale water conservation projects since 1949, and developed drought and water scarcity relief frameworks. However, drought still causes huge impacts on water supply, environment and agriculture. China has, therefore, created specialized agencies for drought management called Flood Control and Drought Relief Headquarters, which include four different levels: state, provincial, municipal and county. The impact datasets they collect provide an effective resource for drought vulnerability assessment, and provide validation options for hydro-meteorological indices used in risk assessment and drought monitoring. In this study, we use the statistical drought impact data collected by the Liaoning province Drought Relief Headquarter and meteorological drought indices (Standardized Precipitation Index, SPI and Standard Precipitation Evaporation Index, SPEI) to explore a potential relationship between drought impacts and these indices. The results show that SPI-24 and SPEI-24 are highly correlated to the populations that have difficulties in obtaining drinking water in four out of the six cities studied. Three impacts related to reservoirs and the availability of drinking water for humans and livestock exhibit strong correlations with SPI and SPEI of different accumulated periods. Results reveal that meteorological indices used for drought monitoring and early warning in China can be effectively linked to drought impacts. Further work is exploring how this information can be used to optimize drought monitoring and risk assessment in the whole Liaoning province and elsewhere in China.
- Article
(1885 KB) - Full-text XML
- BibTeX
- EndNote


Drought is an inherent meteorological characteristic of any given region, but is particularly important in China due to monsoon climate and “three ladder” landform system. In China, the uneven distribution of water resources and large population load results in issues of water scarcity and recurring unpredictable drought events in many regions. Water scarcity issues are exacerbated by physio-geographic conditions, including the fact that the South has 69 % of available water supplies, while the North contains 64 % of arable land for agriculture. Rainfall distribution follows the same North-South distribution, ranging from 320 mm yr−1 in the northern river systems (i.e., China north of the Yangtze River) to 1200 mm yr−1 in the southern river systems (Quinn et al., 2014). Although there have been massive efforts to transfer water from the South to the North in recent years, the Northern provinces have experienced drought problems due to low rainfall and huge water consumption.
The Chinese government has constructed large-scale water conservancy projects since the People's Republic of China was established in 1949, and has developed drought and water scarcity relief frameworks. In general, people no longer die as a result of drought in China and those affected will receive relief from the government, such as free drinking water delivery service from drought relief service teams. Although many efforts have been made by the government, drought still causes huge impacts on water supply, agriculture and ecological environment (e.g. Huang et al., 2013; Li, 1995). According to the official statistics (State Flood Control and Drought Relief Headquarters of Ministry of Water Resources, 2017), there have been 33 extreme severe drought disasters in China since 1949. The most critical drought disaster occurred in 2000 when two thirds of China was affected and crop yield loss reached to 60 billion kilograms – about 12 % of national total crop yield in that year, costing around CNY 51 billion (EUR 6.8 billion). About 28 million of the rural population and 17 million large cattle had temporary drinking water difficulties, while 620 towns had water supply shortages and 26.4 million of the urban population were affected by this disaster (State Flood Control and Drought Relief Headquarters of Ministry of Water Resources, 2017). On average, every year drought occurs in different areas in China and the drought disaster has caused millions of dollars of economic losses. The Chinese government therefore pays close attention to drought disaster reduction and has created specialized agencies for drought management called Flood Control and Drought Relief Headquarters (FCDRHs), which include four different levels: state, provincial, municipal and county.
The FCDRHs at various levels are responsible for drought relief planning work, taking early action risk reduction and mitigation measures based on predictions, delivering drought early warning, making decisions for drought emergency plan, and drought impact assessment etc. The state FCDRH shall be responsible for organizing and leading the work of nationwide drought management. Local FCDRH at provincial/municipal/county level shall be responsible for organizing and directing the drought management work within their jurisdiction. This “top to bottom” drought management system enables complete drought impact statistics to be collected. The impact datasets they collect provide an effective resource for drought vulnerability assessment, and provide opportunities to validate hydro-meteorological indices used in risk assessment and drought monitoring.
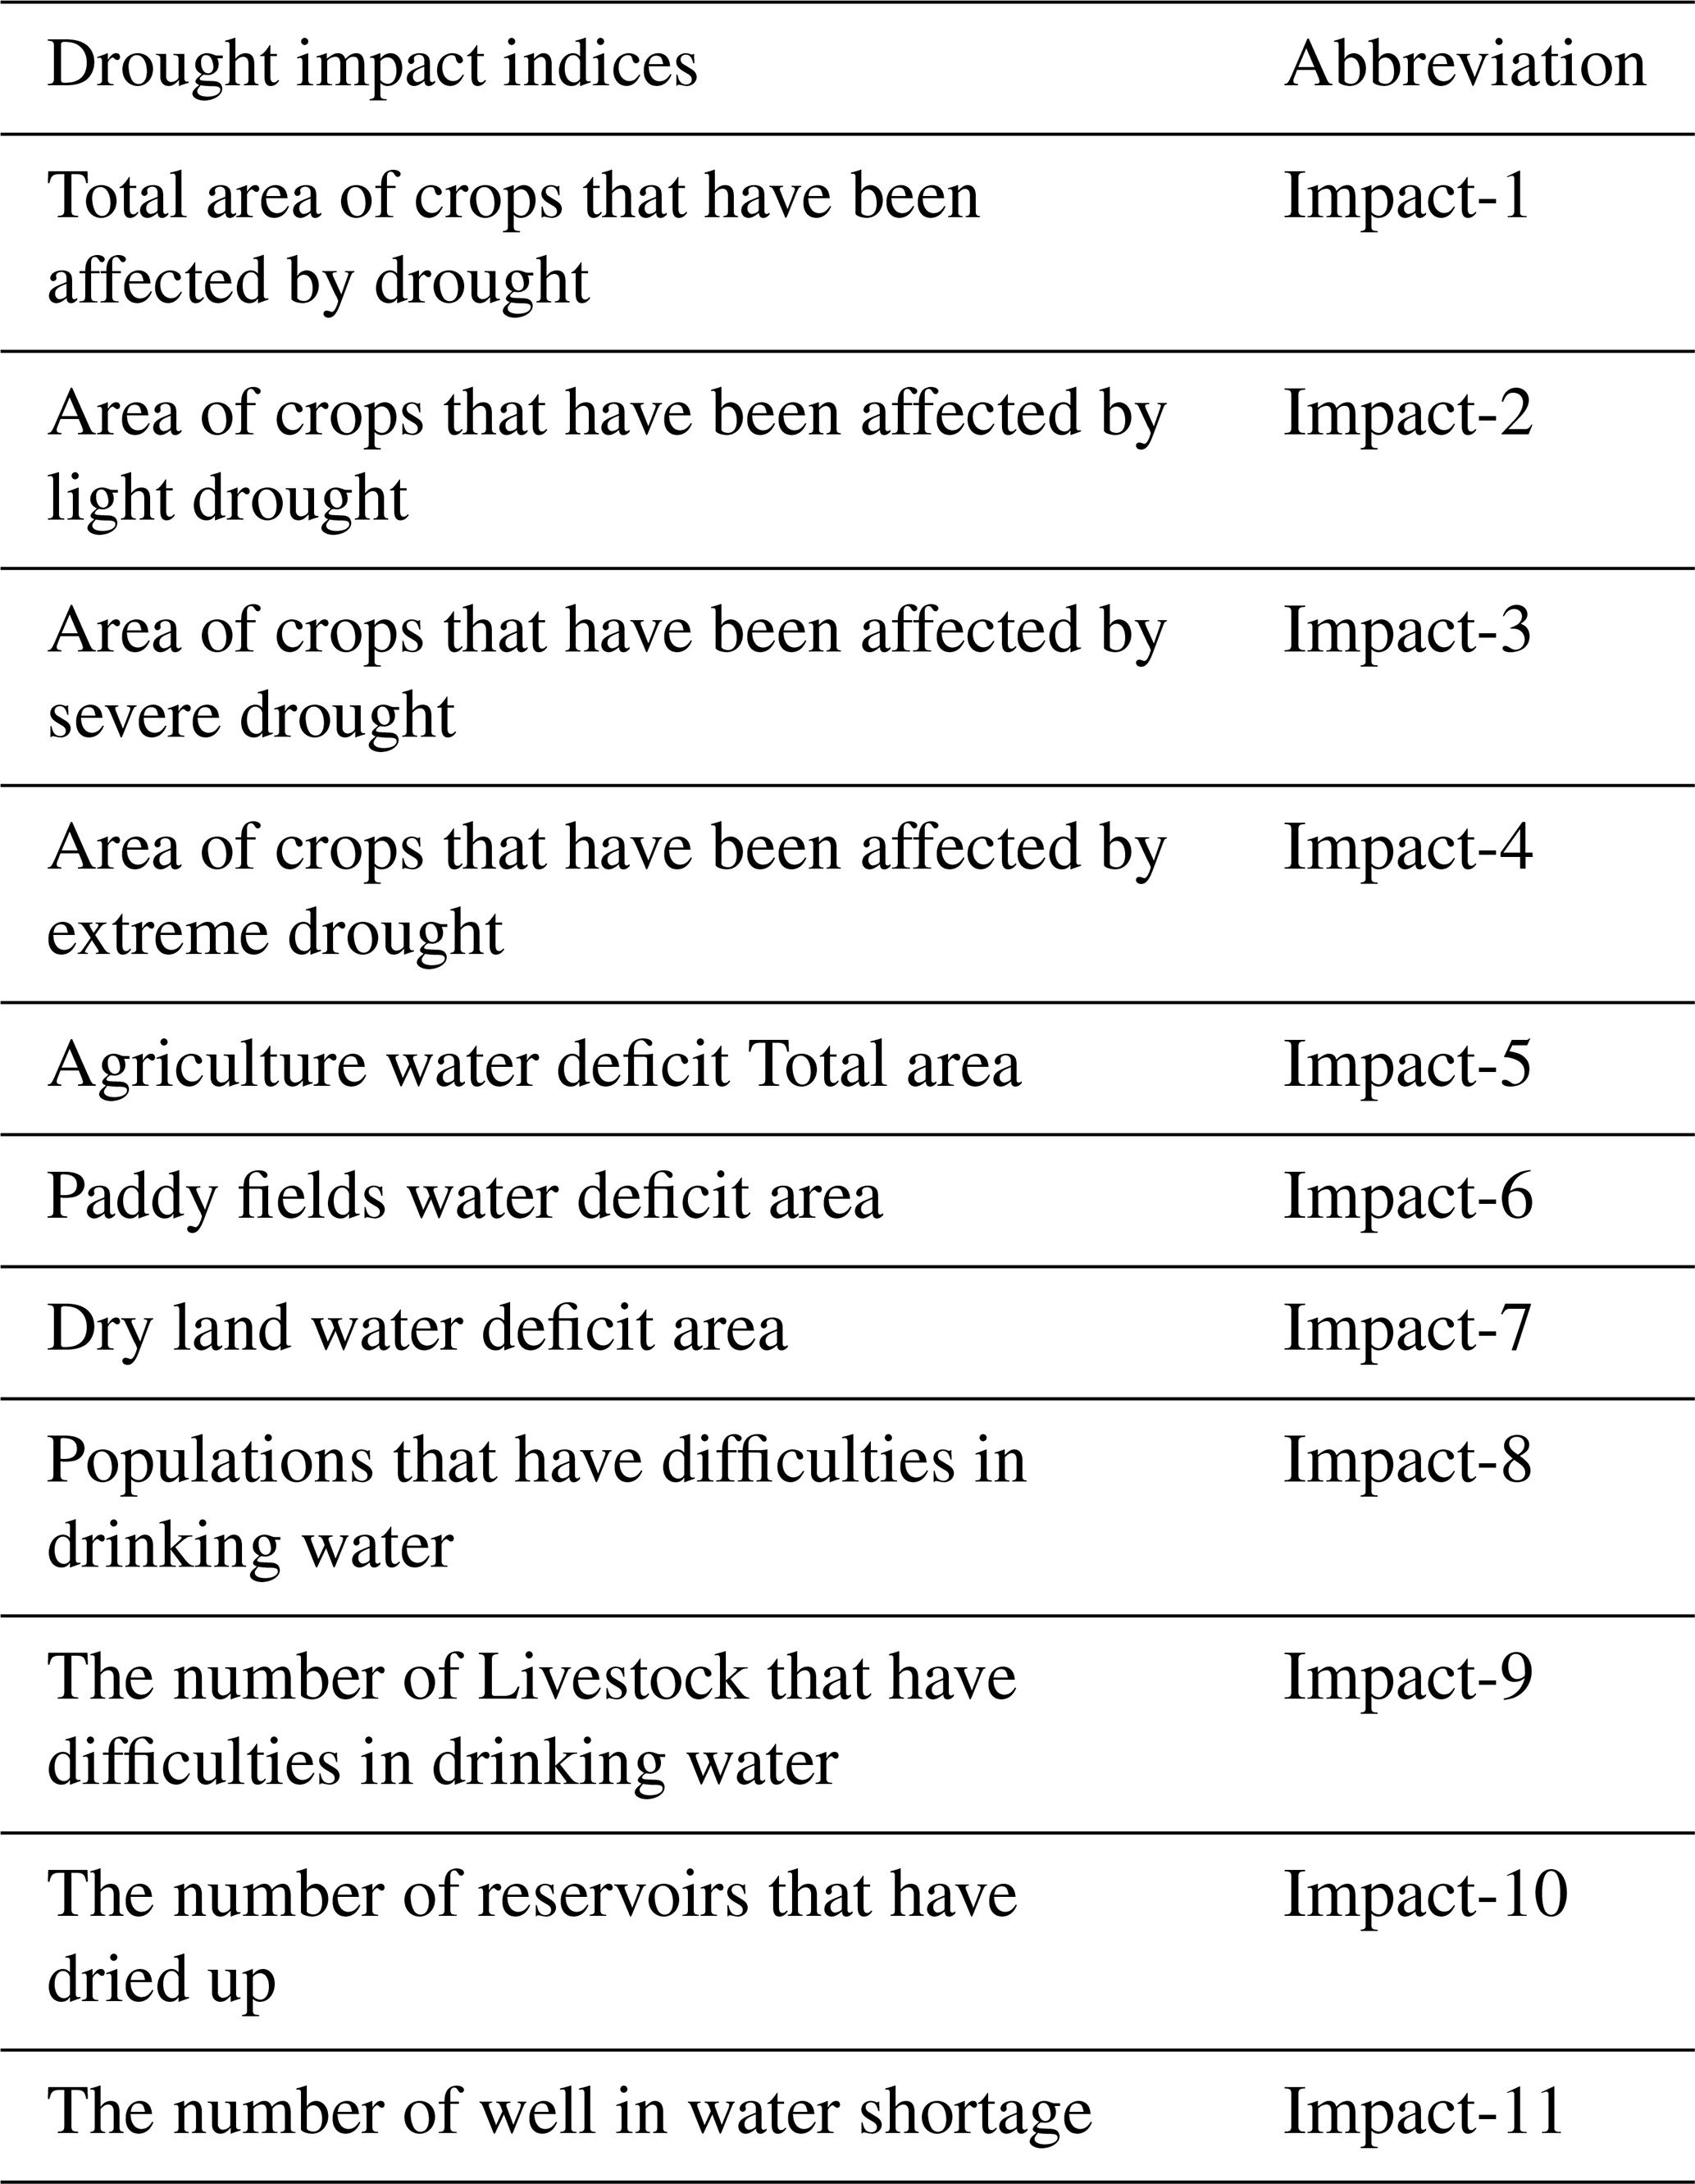
Hydrological and meteorological characterization of drought is well-known but there is a lack of knowledge on impacts (Bachmair et al., 2016a). Observed impacts reflect the real situation of a drought disaster on the ground and are key to understand baseline vulnerability. Bachmair et al. (2016a) point out that drought indices are proliferating, but they don't consider whether the indices represent the local drought conditions. Bachmair et al. (2015, 2016b) provide a quantitative analysis to objectively appraise drought indices and model European drought impacts. Compared with European drought impact data, which are collected from range of sources (Stahl et al., 2016), Chinese drought impact data are collected more systematically and are more comprehensive, which can be attributed to the “top to bottom” drought management system. In some areas, these data have been collected since 1972, and have been collected nationally from 1990. Eleven indices (Table 1) used to describe the drought impacts are counted every ten days and then gathered in the drought reporting system. These impact datasets offer huge potential for studying vulnerability and for evaluating indices in a way that is rarely possible elsewhere.
This paper aims to understand the correlations between drought indices and impacts based on the Liaoning systematic statistical drought impact data. We use the statistical drought impact data collected by the Liaoning province Drought Relief Headquarters and meteorological drought indices SPI/SPEI, to explore the potential relationship between drought impacts and these indices.
2.1 Study Area
The study area is located at the northwest part of the Liaoning province, including six cities, Chaoyang, Fuxin, Huludao, Jinzhou, Shenyang and Tieling, with a total area of 76 8000 km2 and a population of 22 million people. Figure 1 shows the six cities in the study area and the locations of the selected meteorological stations. Northwest part of the Liaoning province is the typical severe drought area of China. Annual average precipitation is about 400 mm, much lower than the provincial average of 680 mm, and it has the least rainfall in the Liaoning province. The water surface evaporation capacity reaches to 1000–1300 mm yr−1. Therefore, there are high water deficits in this area and it is the most frequent drought affected area in the Liaoning Province. Spring drought is the main drought type, occupying 30 %–65 % of drought events, followed by the spring–summer continuous drought.
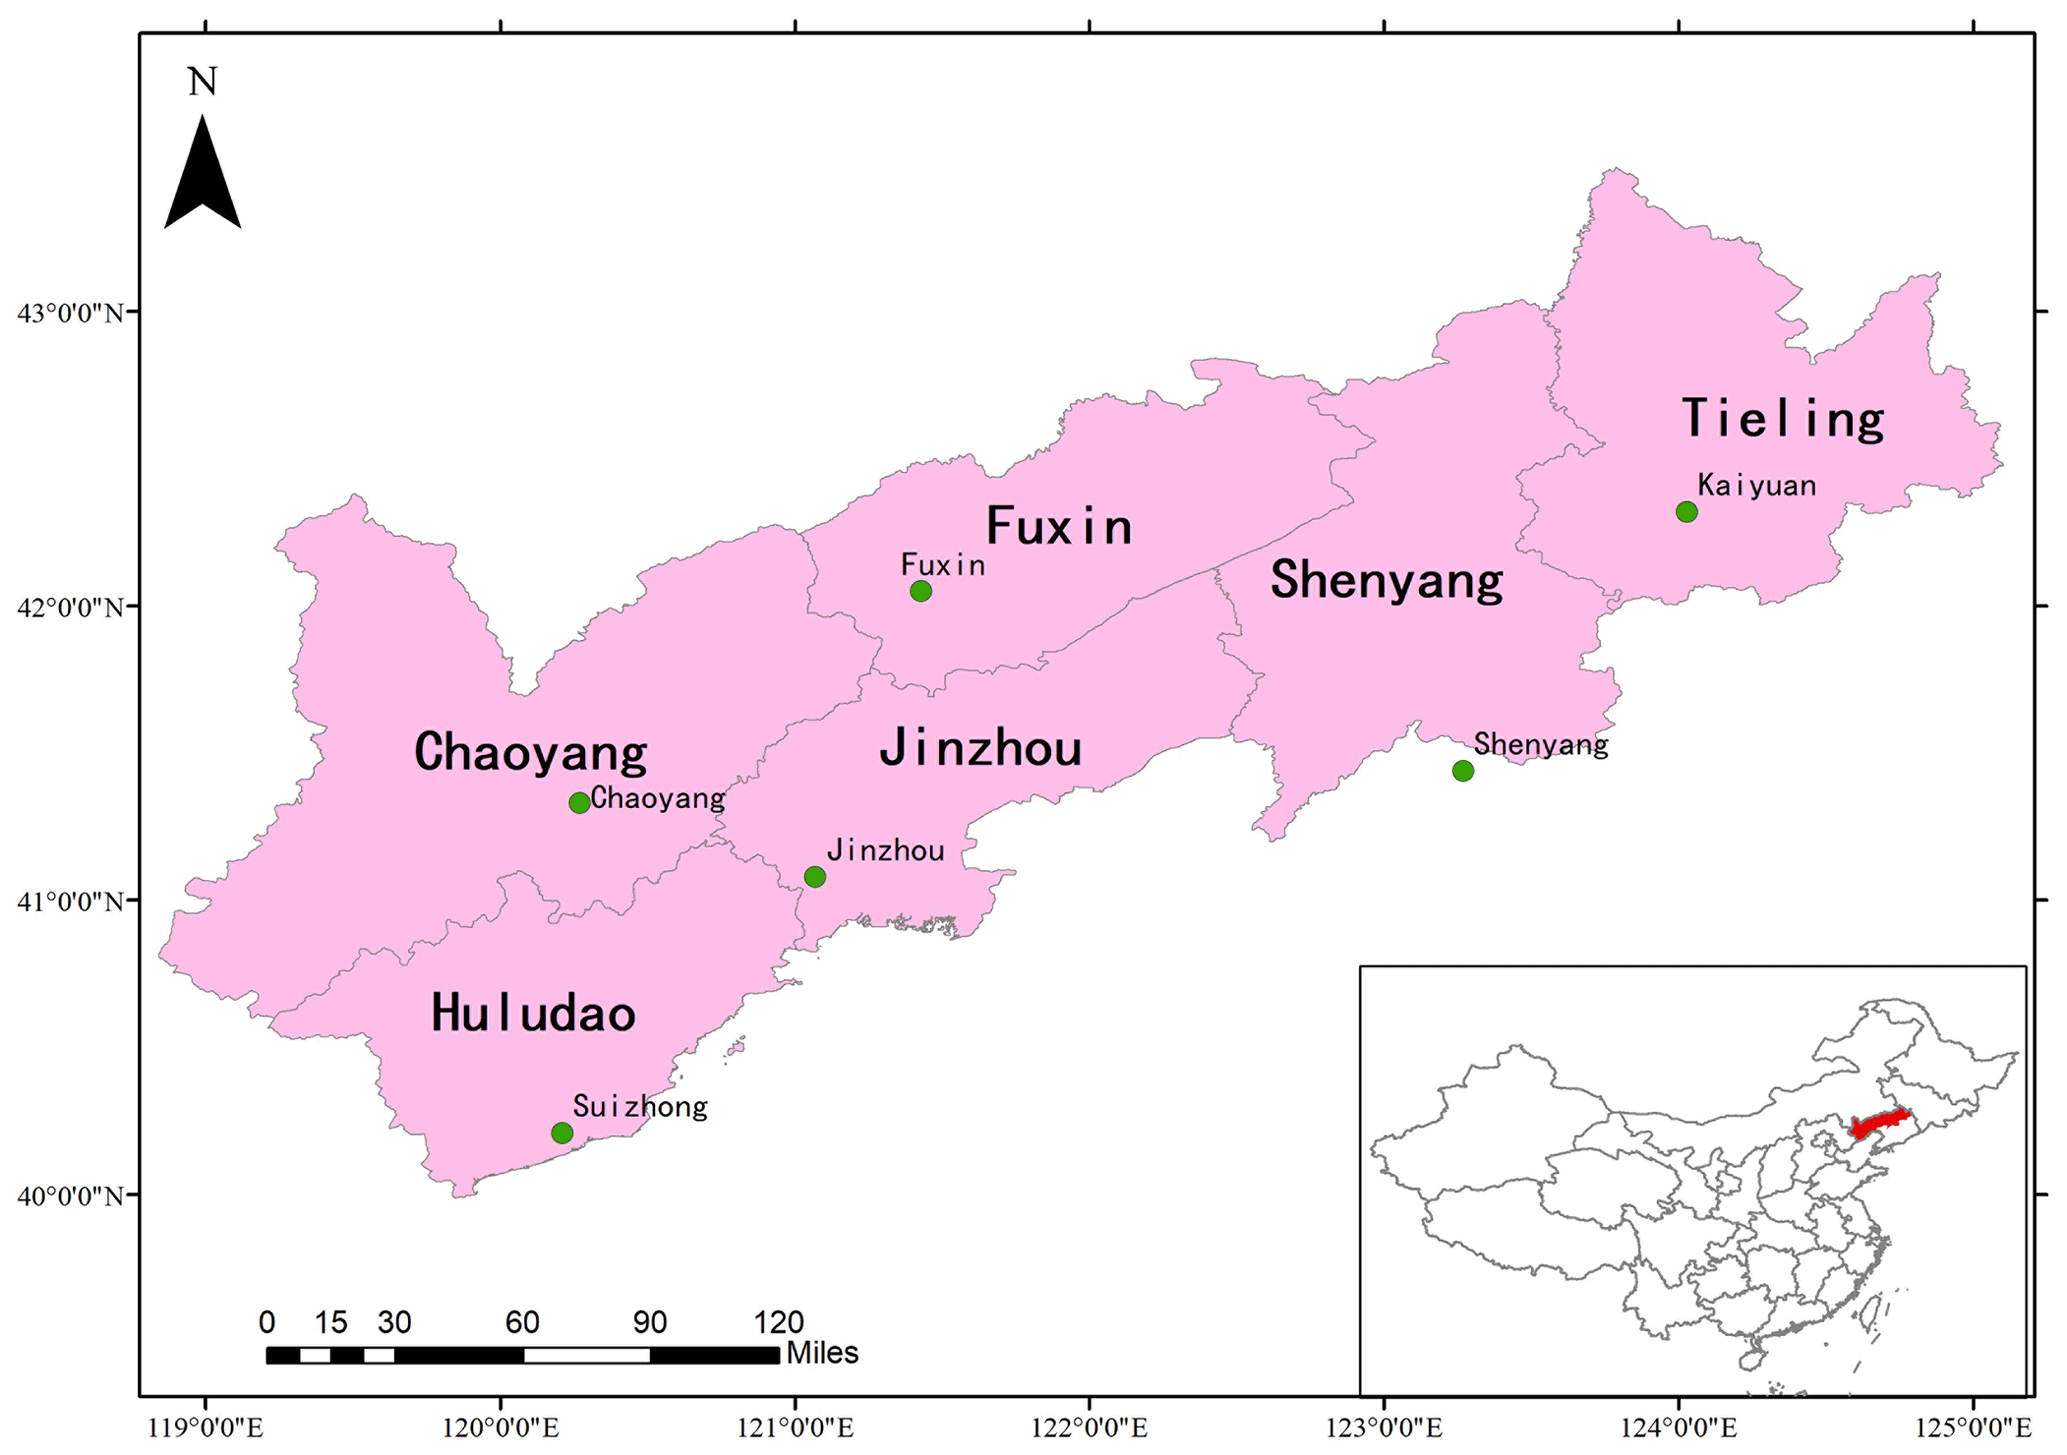
Figure 1Study area and the location of the selected meteorological stations.
2.2 Data
There were two main types of data used in this research: meteorological data and drought impact data. Meteorological data were used to calculate the drought indices SPI and SPEI, while the drought impact data were used to calculate the drought impact indices. Six cities in the Liaoning province were included in this study, and one meteorological station was selected in each city to calculate the SPI and SPEI (shown on Fig. 1). These six stations had more than 60 years observed daily data from 1950 to 2016. We used these daily data to calculate the SPI with accumulation periods of 1–12, 15, 18, 21, 24 and 36 months, and 1–12 and 24 months for SPEI. The SPI and SPEI are valid indices of drought monitoring and have been widely recognized internationally. They are easier to be calculated than Palmer Drought Severity Index as they have few data requirements. In this study, we calculated SPI and SPEI of different accumulation periods. The SPI and SPEI were computed using the standardized Drought Analysis Toolbox Package developed by IWHR Drought Mitigation Research Team.
Drought impact data from 1999 to 2016 were from the Liaoning Province drought statistics reporting system. They were counted every ten days by the county FCDRH, and then reported to higher level FCDRH before being gathered in the State FCDRH. In this study, we employ the arithmetic mean method to transfer them into average monthly data constituent with the time scale of SPI and SPEI. Eleven drought impact indices are chosen and listed at Table 1. SPI and SPEI data from 1999 to 2016 were selected corresponding to the available impact data.
2.3 Correlation Analysis
Spearman correlations were undertaken to explore the relationship between SPI and SPEI of different accumulation periods and the eleven drought impact indices (Table 1). The correlation strength is defined as follows: 0–0.1 (no correlation), 0.1–0.3 (weak), 0.3–0.6 (moderate), 0.6–0.9 (strong) and 0.9–1 (very strong) (Bachmair et al., 2016b).
For the six cities, most accumulations periods of SPI and SPEI showed negative correlations with drought impact indices, and the stronger correlations occurring for longer time scales of SPI and SPEI, such as SPI-21, SPI-24, SPI-36, and SPEI-24 (Figs. 2–3). In contrast, Tieling exhibited more negative correlations around SPEI of 7 or 8 months (Fig. 3).

Figure 2Correlations between SPI/SPEI with different accumulation periods and the 11 drought impact indices in Chaoyang, Fuxin and Huludao.
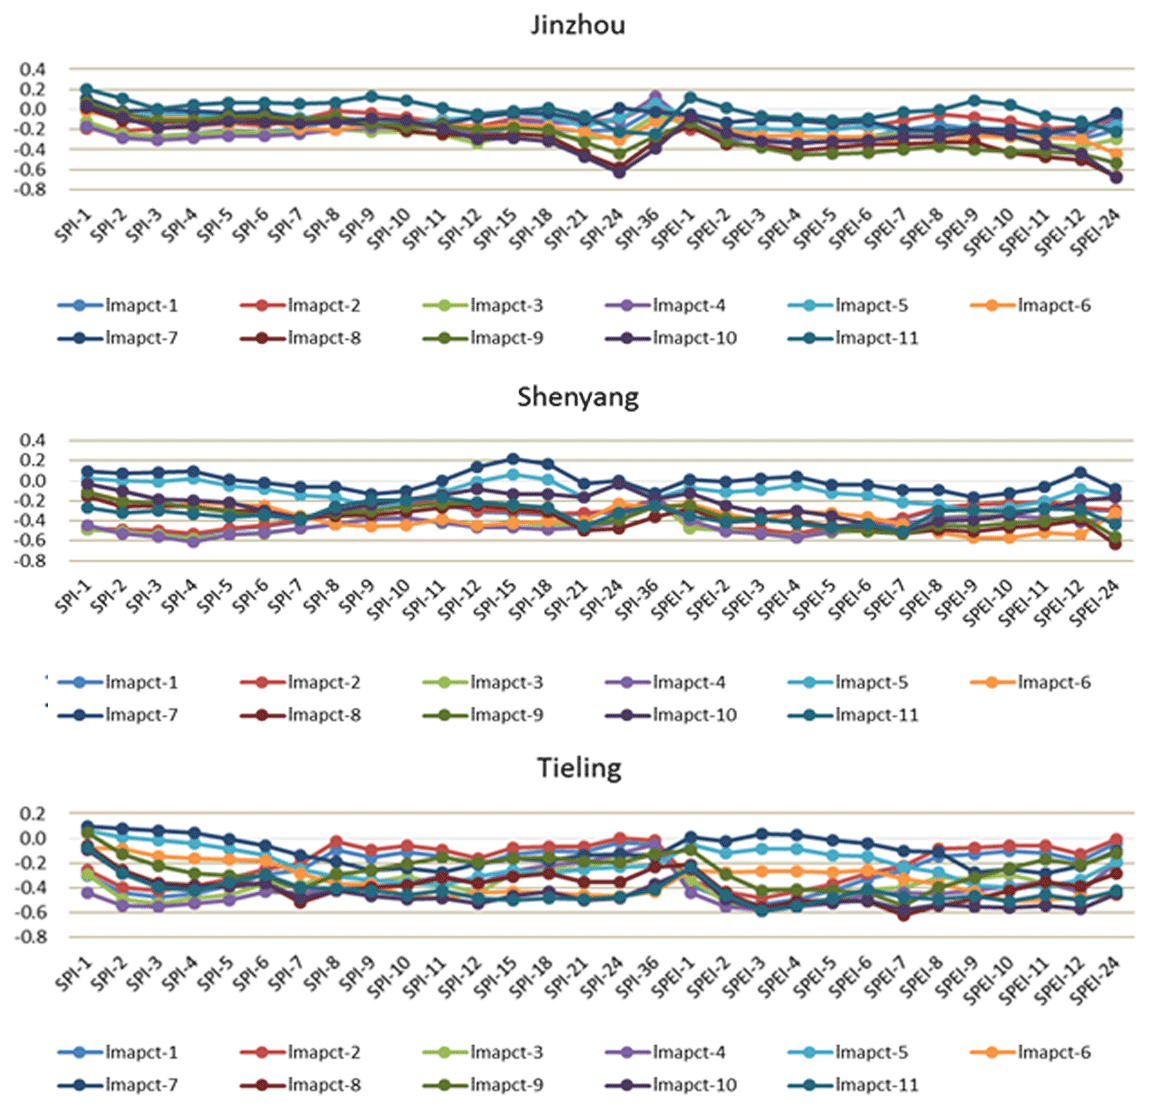
Figure 3Correlations between SPI/SPEI with different accumulation periods and the 11 drought impact indices in Jinzhou, Shenyang and Tieling.
Table 2 showed the Spearman correlation coefficients between drought impact indices to SPI and SPEI of different accumulation periods. Five of the cities studied showed strong negative correlations between impact indices and SPI/SPEI except Chaoyang (Table 2). Four of the six cities indicated that SPI-24 and SPEI-24 were highly correlated to the populations that had difficulties in drinking water (Impact-8). The other two impact indices exhibited strong correlations with SPI and SPEI of different accumulated periods, such as the number of livestock that had difficulties in drinking water (Impact-9) and the number of reservoirs that had dried up (Impact-10). The area of crops that have been affected by extreme drought (Impact-4) had a strong correlation with SPI-4 in Shenyang, while SPEI-8 highly correlated to Impact-8 in Tieling. In Fuxin, SPI-21 exhibited strong correlations with Impact-8 and Impact-9 and their coefficients were −0.623 and −0.667, respectively. The strongest correlation coefficient of all impact indices at accumulation periods of SPI or SPEI was 0.794 in Fuxin between SPI-24 and Impact-9. In summary, the three impact indices related to reservoirs and the availability of drinking water for humans and livestock (i.e. Impact-8, Impact-9 and Impact-10) exhibited strong correlations with SPI and SPEI of different accumulated periods.
Table 2Spearman correlation coefficients between drought impact indices in Table 1 to SPI and SPEI with different accumulation periods.

In this study, the SPI and SPEI calculations were based on the meteorological station monitoring data in six cities. Due to the small number of meteorological stations used here, it was not possible to reflect the average precipitation over the whole region. In China, precipitation is also monitored at hydrological stations, especially for the flood season; If the denser and more comprehensive hydro-meteorological datasets were used, it is likely that stronger relationships between drought indices and impacts would be found.
Similarly, correlations between drought indices and impacts depend on the quality and accuracy of impact data. Therefore, the drought impact data need to be properly verified. Although the impact data was reported by various levels of FCDRHs, and notably are systematic and complete by international standards, there are still always some subjective factors involving in estimating impact statistics. For example, the mild drought is difficult to be identified at the early stages; moderate drought conditions have often already started when people realize the drought is occurring. In such situation, the statistical values may underestimate the actual drought condition.
Results show that SPI-24 and SPEI-24 are highly correlated to the populations that have difficulties in drinking water in four of the six cities studied. This means two years periods of SPI and SPEI better represent these drought impacts in the northwest of the Liaoning province.
This paper uses the statistical drought impact data and meteorological drought indices (i.e. SPI and SPEI) to explore the relationship between drought indices and impacts. The results indicate that SPI and SPEI with accumulation periods of two years best represent the drought impacts in the northwest of the Liaoning province. Meteorological indices used for drought monitoring and early warning in China can be effectively linked to drought impacts. Further work is exploring how this information can be used to optimize drought monitoring and risk assessment in the whole of the Liaoning province and elsewhere in China.
The drought impact data of study area cannot be open according to the data licensing agreement.
MM design the whole research and carried them out. She prepared the manuscript with contributions from all co-authors. JL and ZS contacted with the data agency and collected the drought impact data. JH and LB revised the manuscript and proposed some suggestions. HS and YQ calculated the SPI and SPEI of study area. ZX and YW handled with the data preprocessing.
The authors declare that they have no conflict of interest.
This article is part of the special issue “Hydrological processes and water security in a changing world”. It is a result of the 8th Global FRIEND–Water Conference: Hydrological Processes and Water Security in a Changing World, Beijing, China, 6–9 November 2018.
This research has been supported by the National Natural Science Foundation of China (grant no. 51609257), the IWHR Research & Development Support Program (grant no. JZ0145B582017), NC-ODA Sustainable Use of Natural Resources to Improve Human Health and Support Economic Development (SUNRISE) project NE/R000131/1, and the Hydraulic science and technology in Hunan Province (grant no. [2017]230-36).
Bachmair, S., Kohn, I., and Stahl, K.: Exploring the link between drought indicators and impacts, Nat. Hazards Earth Syst. Sci., 15, 1381–1397, https://doi.org/10.5194/nhess-15-1381-2015, 2015.
Bachmair, S., Stahl, K., Collins, K., Hannaford J., Acreman, M., Svoboda, M., Knutson, C., Simth, K. H., Wall, N., Fuchs, B., Crossman, N. D., and Overton, I. C.: Drought indicators revisited: the need for a wider consideration of environment and society, Wiley Interdisciplin. Rev.: Water, 3, 516–536, https://doi.org/10.1002/wat2.1154, 2016a.
Bachmair, S., Svensson, C., Hannaford, J., Barker, L. J., and Stahl, K.: A quantitative analysis to objectively appraise drought indicators and model drought impacts, Hydrol. Earth Syst. Sci., 20, 2589–2609, https://doi.org/10.5194/hess-20-2589-2016, 2016b.
Huang, X., Li, X., Mu, X., Wang, K., Tian, K., Duan, C., and Yu, F.: The severe drought occurred in south China in 2010: An examination from perspective of ecology, Research of Soil and Water Conservation, 20, 282–292, 2013 (in Chinese with English abstract).
Li, C.: The Effects of Flood Waterlogging and Drought on Environment, Journal of Shanxi Water Power, 11, 57–61, 1995 (in Chinese with English abstract).
Quinn, L., Nieuwaal, M., Howarth, S., Lv, J., Yu, M., Su, Z., Wu, Y., Qu, Y., Wang, Y., and Sun H.: TA8185: Pilot Implementation of the Drought Management Strategy, People's Republic of China: Pilot Implementation of the Drought Management Strategy, Asian Development Bank Technical Assistance Consultant's Final Report, Mott Macdonald, Beijing, China, 2014.
Stahl, K., Kohn, I., Blauhut, V., Urquijo, J., De Stefano, L., Acácio, V., Dias, S., Stagge, J. H., Tallaksen, L. M., Kampragou, E., Van Loon, A. F., Barker, L. J., Melsen, L. A., Bifulco, C., Musolino, D., de Carli, A., Massarutto, A., Assimacopoulos, D., and Van Lanen, H. A. J.: Impacts of European drought events: insights from an international database of text-based reports, Nat. Hazards Earth Syst. Sci., 16, 801–819, https://doi.org/10.5194/nhess-16-801-2016, 2016.
State Flood Control and Drought Relief Headquarters of Ministry of Water Resources, China: The statistics of Flood and drought disaster bulletin in China (2000–2017), China Water & Power Press, available at: http://www.mwr.gov.cn/sj/tjgb/zgshzhgb/201808/t20180806_1044770.html (last access: 6 August 2018), 2017.