the Creative Commons Attribution 4.0 License.
the Creative Commons Attribution 4.0 License.
 | 16 Sep 2020
Improved understanding of the Senegal floodplain socio-hydrosystems with multi-scalar earth observations
Jean-Christophe Poussin
Jean-Claude Bader
Didier Martin
Gora Ndiaye
Djiby Dia
In semi-arid regions, the annual floods of alluvial plains, wetlands and lakes provide essential services to millions of farmers, livestock holders and fishers. The scale, number and dispersion of these water bodies limit however their hydrological understanding, whose complexity is exacerbated by the mutual interactions between water and society. Rising availability of high spatial and temporal resolution remote sensing imagery provide novel opportunities to improve the understanding of the hydrology of multiple water bodies and of their ability to support local livelihoods. Multi-scalar interdisciplinary research combining remote sensing, in situ observations, hydrological modelling and farmer interviews was developed to investigate multiple socio-hydrosystems in the Senegal floodplain. Surface water monitoring with MNDWI on multi-spectral imagery (Landsat 5, 7, 8 and Sentinel-2A) is used to identify intra-annual and inter-annual variations in water availability. Validation against field monitoring (R2=0.88) and photointerpretation of drone imagery highlights the benefits of Sentinel's increased resolution to monitor floods of minor surface area and duration and improve the representation of hysteresis in floodplains. Integrated into forthcoming river basin modelling, these results can help simulate the influence of upstream changes on the hydrology and associated services of these complex socio-hydrosystems and improve watershed management.
- Article
(2857 KB) - Full-text XML
- BibTeX
- EndNote


The annual floods of large rivers in Africa (Nile, Zambezi, Niger, Senegal, Congo) and Asia (Mekong, Ganges, Indus) support numerous ecosystem services along their alluvial floodplains. In Africa, these seasonal resources support the livelihoods of small-scale farmers, fishers and herders over 30 million ha. In semi-arid areas, these systems are subject to strong hydroclimatic variability and vulnerability. In West Africa, the droughts in the 1970–1980s favoured the development of full control irrigation, however millions of smallholder farmers continue to rely on flood recession farming for subsistence. Besides, the construction of dams to support the development of irrigation and hydropower has modified river regimes, reducing the peak floods while allowing potential support during low flows.
The scale, diversity and flat topography of these floodplains generate difficulties and uncertainties in the hydrological monitoring and modelling (Neal et al., 2012). These are exacerbated by the decline in observation networks, and the difficulties to apprehend and represent human influences on water resources (withdrawals, dam management, land use changes) and in turn the relationships between water resources and associated uses and services. These considerations are at the heart of the reflections developed currently in socio-hydrology (Sivapalan et al., 2012) and the 2013–2022 IAHS Panta Rhei decade (Montanari et al., 2013) devoted to increasing the understanding and representation of anthropic modifications to hydrological regimes. In parallel, the opportunities in quantitative hydrology provided by the recent improvements in low cost, high spatial and temporal resolution imagery have increased significantly. New sensors aboard Sentinel-2 satellites notably provide free high resolution (up to 10 m) imagery every 10 d since 2015. Their ability to reproduce hydrological dynamics and extrapolate across multiple sites and larger scales must be explored and validated against extensive ground truth field data. Previous research highlighted the difficulties (resulting from size, flooded vegetation, shallow depths, cloud cover during the flood rise), and the need to assess and reduce remote sensing uncertainties in different hydrological settings (Ogilvie et al., 2018).
This paper presents the first results from research focussing on the alluvial floodplain of the Senegal River where field instrumentation, remote sensing and agronomic surveys are being used to improve the hydrological understanding of the flood and its influence on recession farming. Upscaled and integrated into hydrological modelling, these results will help predict climatic and human influences on flooding patterns and associated services in the Senegal floodplain socio-hydrosystems.
2.1 Floodplains of the Senegal River
The middle valley of the Senegal River is an alluvial floodplain extending over more than 225 000 ha on the border of Senegal and Mauritania. Local rainfall in this Sahelian floodplain remains limited (300 mm on average concentrated in July–September) and the flood is produced by heavy rainfall of the West African monsoon on the Guinean headwaters. The flood peaks occur between mid-September and mid-October depending on the location along the Senegal River. The annual floods are a vital resource for local fishers, herders and farmers, who grow floating rice and traditional crops (sorghum, corn, cowpea) as the flood recedes.
River flows in the Senegal River were modified by the commissioning in 1988 of the Manantali dam in Mali on the Bafing river, built to generate hydroelectricity, improve downstream irrigation and navigation during low flows and support limited flood-recession farming. The Diama dam built in the lower part of the river in 1986 aims to prevent saltwater intrusion (flowing back upstream as far as Richard Toll) and to improve the potential for irrigation and drinking water supply. Annual runoff of the Senegal River also noticeably declined during the 1968–1993 West African drought (over 40 % decline compared to 1950–1968), and has only partly recovered despite the return of high rainfall years (Descroix et al., 2018).
2.2 Satellite optical imagery
443 images over 1984–2017 from sensors aboard Landsat 5 to Landsat 8 satellites were used in this study. Images have a 30 m spatial resolution and a 16 d frequency though the combination of two satellites can reduce observations to every 8 d at certain periods. Images obtained through the U.S. Geological Survey (USGS) ESPA are processed to surface reflectance (Level 2A) using the Landsat Ecosystem Disturbance Adaptive Processing System (LEDAPS) for sensors TM and ETM+ and the Landsat Surface Reflectance Code (LaSRC) for the OLI sensor. A cloud & shadow mask is provided, generated by Cmask, a C version of the Fmask algorithm (Zhu and Woodcock, 2015). 48 Level 2A Sentinel-2 images over 2015–2017 were downloaded from the French Space Agency CNES THEAI data centre. These products include atmospheric corrections based on the MAJA (MACSS-ATCOR Joint Algorithm) treatment chain developed by CNES-CESBIO (Hagolle et al., 2015) and German Aerospace Centre DLR, as well as a cloud and shadow mask. The percentage of clouds, shadows and lost pixels resulting from scan line corrector (SLC) failure after 2003 on ETM+ sensor aboard Landsat 7 were calculated for each image over the region of interest.
Flooded areas over the Podor floodplain (Fig. 1) were determined using the Modified Normalised Difference Water Index (MNDWI) (Xu, 2006) based on the Green and Shortwave Infrared bands, previously used across similar wetlands and shown to provide the greatest accuracy in detecting water in mixed environments (water, flooded vegetation, shallow waters) (Ogilvie et al., 2015, 2018). Calibration of the MNDWI threshold was performed using very high resolution (20 cm) imagery of the 2017 flood acquired with a DJI Phantom 4 UAV (unmanned aerial vehicle). UAV RGB images were mosaicked, orthorectified, resampled to 1 m (to reduce calculation times) and flooded areas were delineated using Maximum likelihood classification and GPS locations of flooded areas.
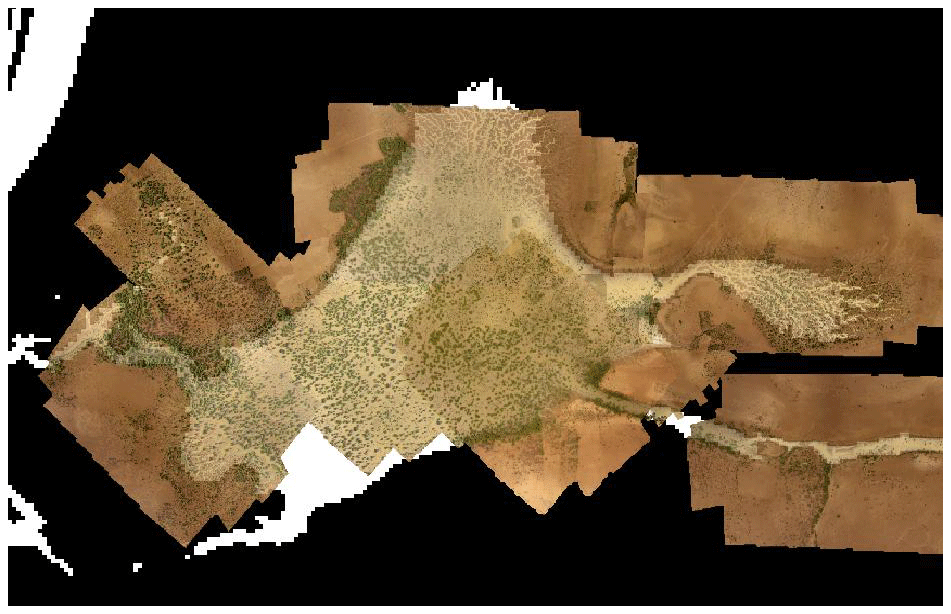
Figure 1UAV imagery of the flooded areas superposed to the classified Sentinel-2 image showing flooded area in white (5 October 2017).
2.3 Hydrological monitoring at Podor
Monitoring of stage levels (m. NG) of the Senegal River at Podor has been carried out since 1903 and is currently managed by the OMVS (Organisation pour la Mise en Valeur du Fleuve Sénégal). Daily ladder readings over 1999–2017 were used here and compared with the flood amplitude and variations obtained by remote sensing of surface waters in the Podor floodplain. Previous research in the Podor floodplain in 1999 established a correlation between the stage values in the river at Podor (Zpeak) and the maximum flooded surface area (Smax) based on 8 classified SPOT images of the flood peak between 1987 and 1999. The 18-year period of field and remote sensing data are notably used here to assess the ability and accuracy of remotely sensed flooded areas to refine the relationship.
3.1 Monitoring surface water variations
Figure 1 illustrates the remarkable resolution in imagery of the flooded area obtained from a series of high altitude flights (300 m) with an UAV. Here, these enable the calibration of the MNDWI to classify water pixels on Sentinel-2 20 m imagery and provide a much greater sample size compared to traditional GPS-based ground truthing. MNDWI allows accurate detection of the open water but also the narrow channels in the presence of significant flooded vegetation and turbidity.
The full series of 443 Landsat images processed provide initial insights into the flood variations over 1984–2017. The peak flooded area reached 1900 ha during high flood years (1999) and only 500 ha during low flood years (2006). Image availability prior to 1999 remains scarce (on average 4 images per year over 1984–1998 compared to 20 images per year over 1999–2015) and insufficient to provide information on flood dynamics. Nevertheless, single images as in October 1988 occasionally provide valuable information on the flood peak.
Comparisons with daily stage data from the nearby river gauge at Podor confirm the aptitude of Landsat long term series to reproduce the annual flood dynamic as well as the interannual variability in the flood amplitudes (Figs. 2 and 3). Over the full period, interannual variations of the peak flooded area are well correlated (R2=0.88) with the variations of river levels at the Podor gauging station (compared to R2=0.81 with previous SPOT imagery). The variations in amplitude are well reproduced most years, except in 2000 and 2003 where cloud cover prevented detection of the flood peak. After 2015, the combination of Sentinel-2 imagery with Landsat 8 increases the resolution of the flood dynamics reproduced (Fig. 3). Over a single flood, R2 increases from 0.92 when using Landsat, to 0.98 with Sentinel-2A (and to 0.94 when combining both satellites due to the residual errors from Landsat 7 SLC failure).
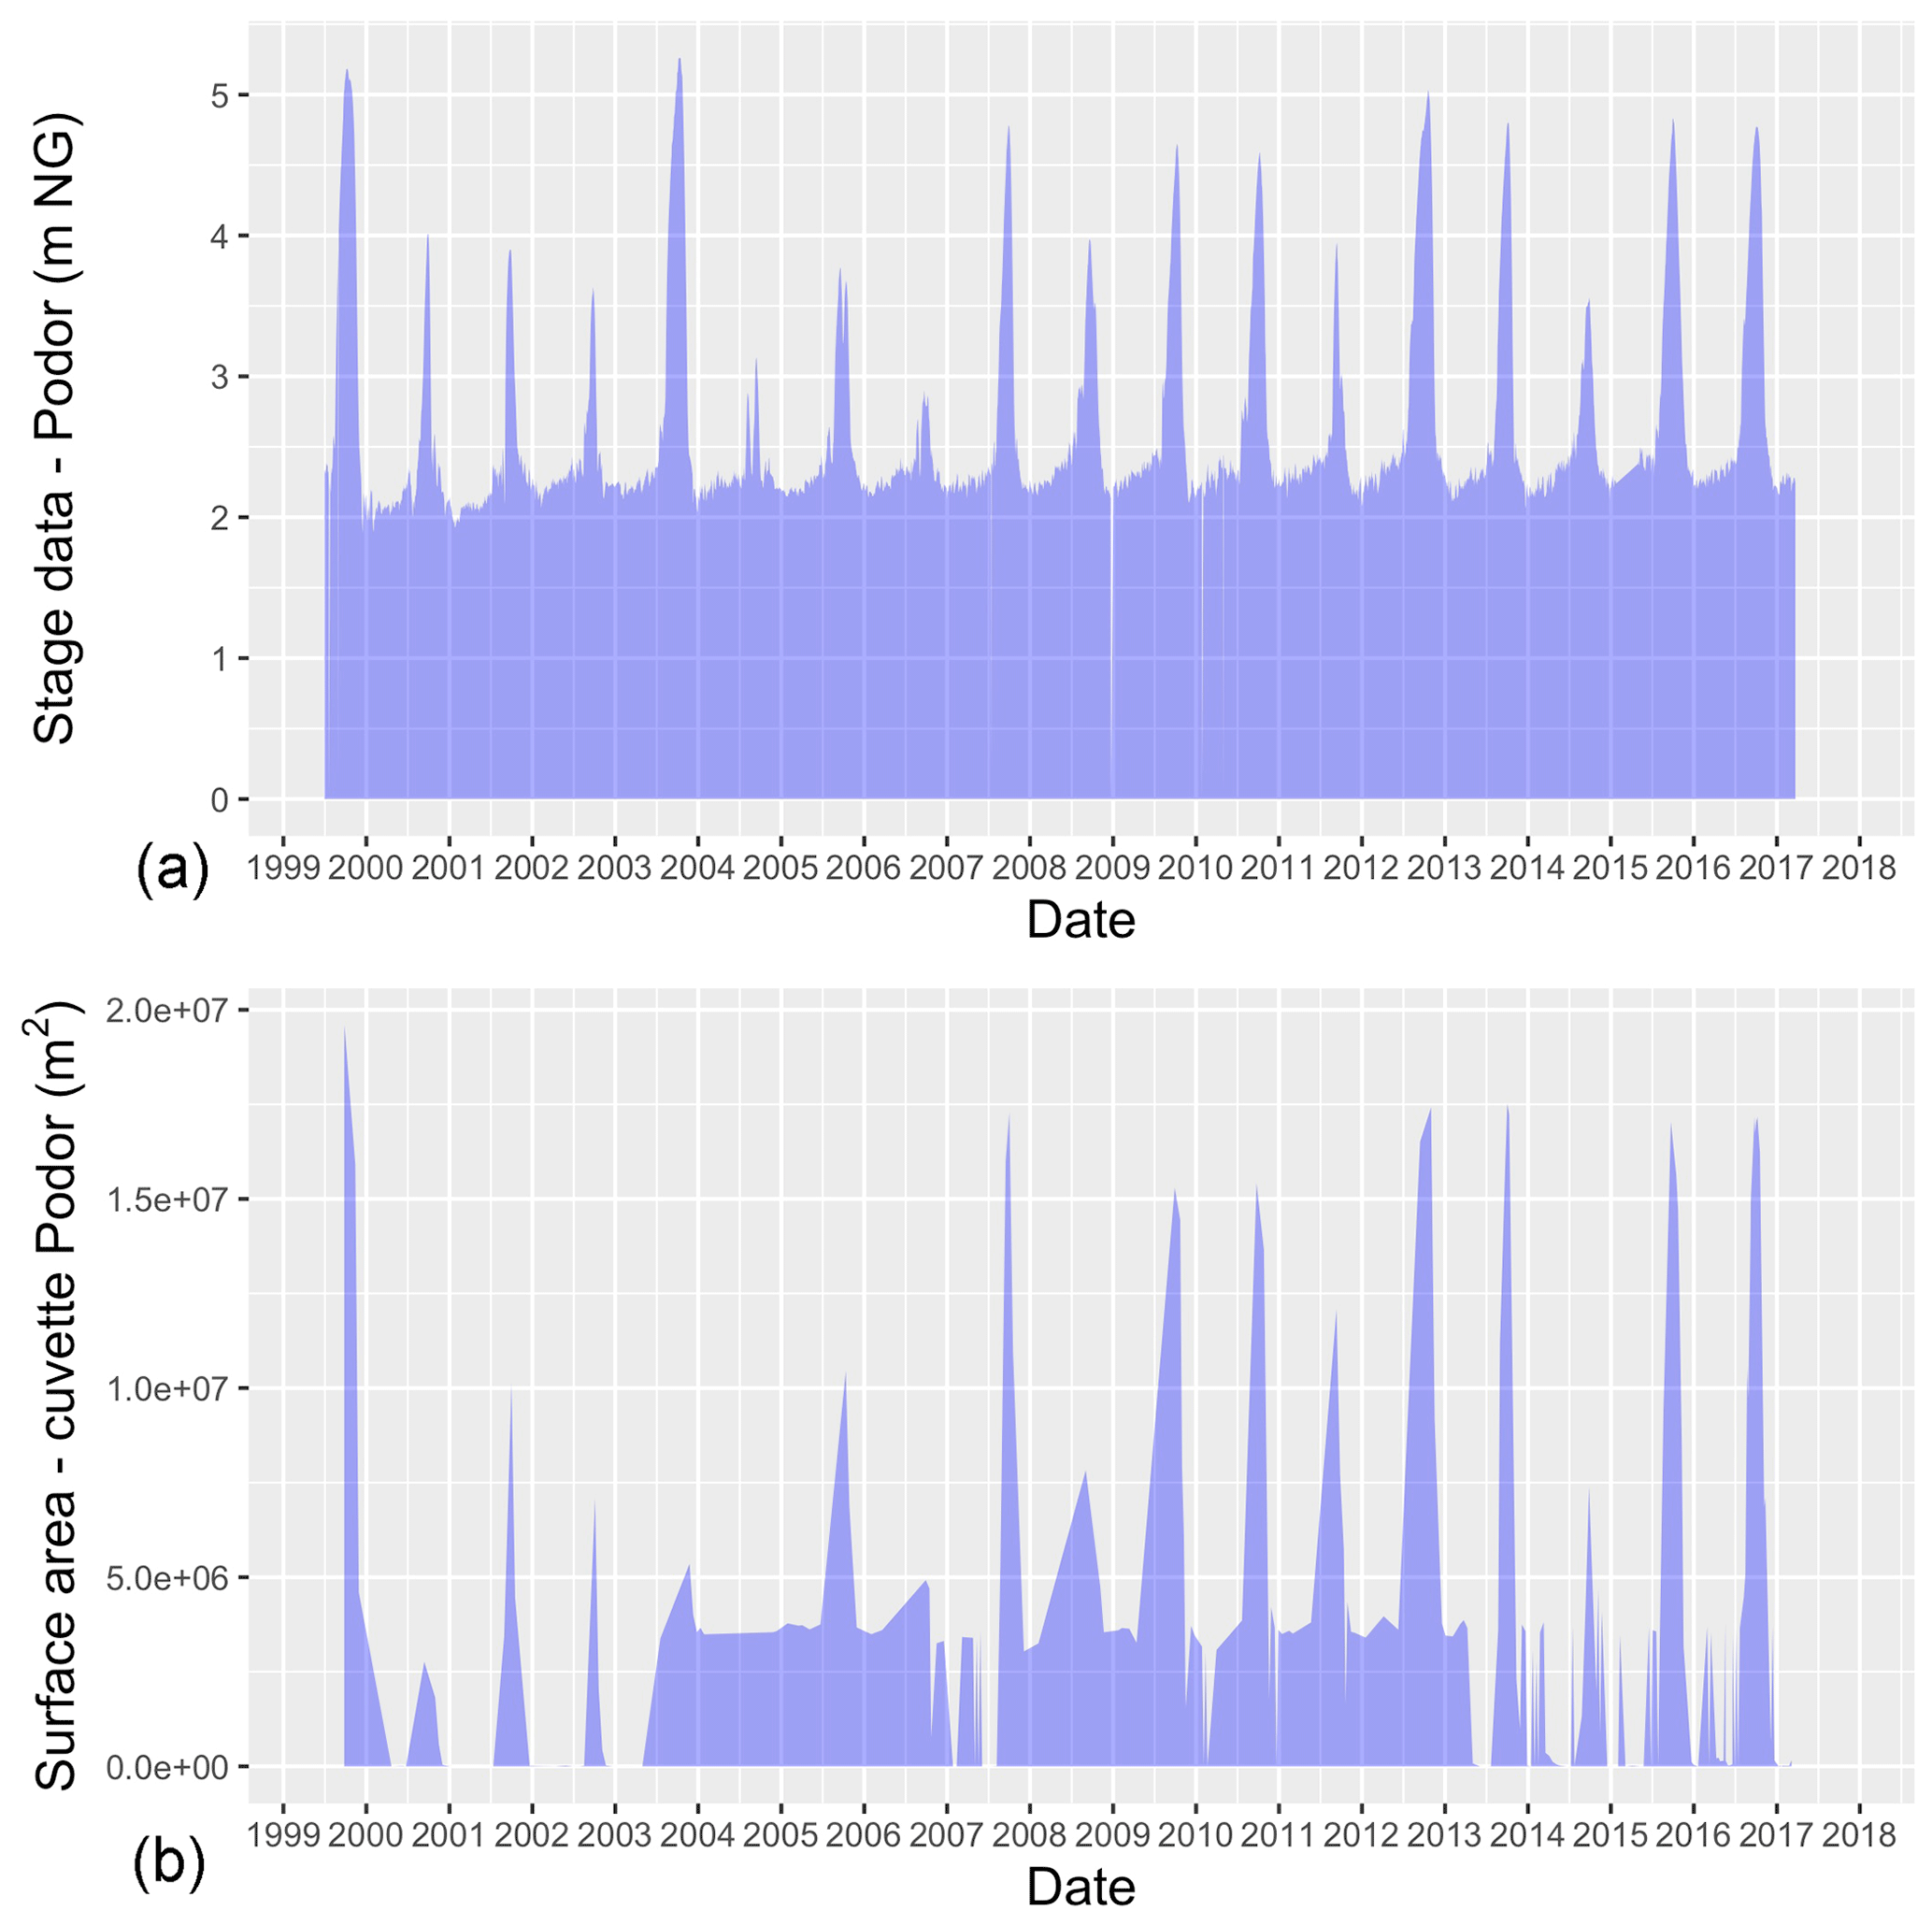
Figure 2Monitoring surface water variations in the Podor floodplain using Landsat 5, Landsat 7, Landsat 8 and Sentinel-2A satellites (a) compared to daily stage data at Podor (b).
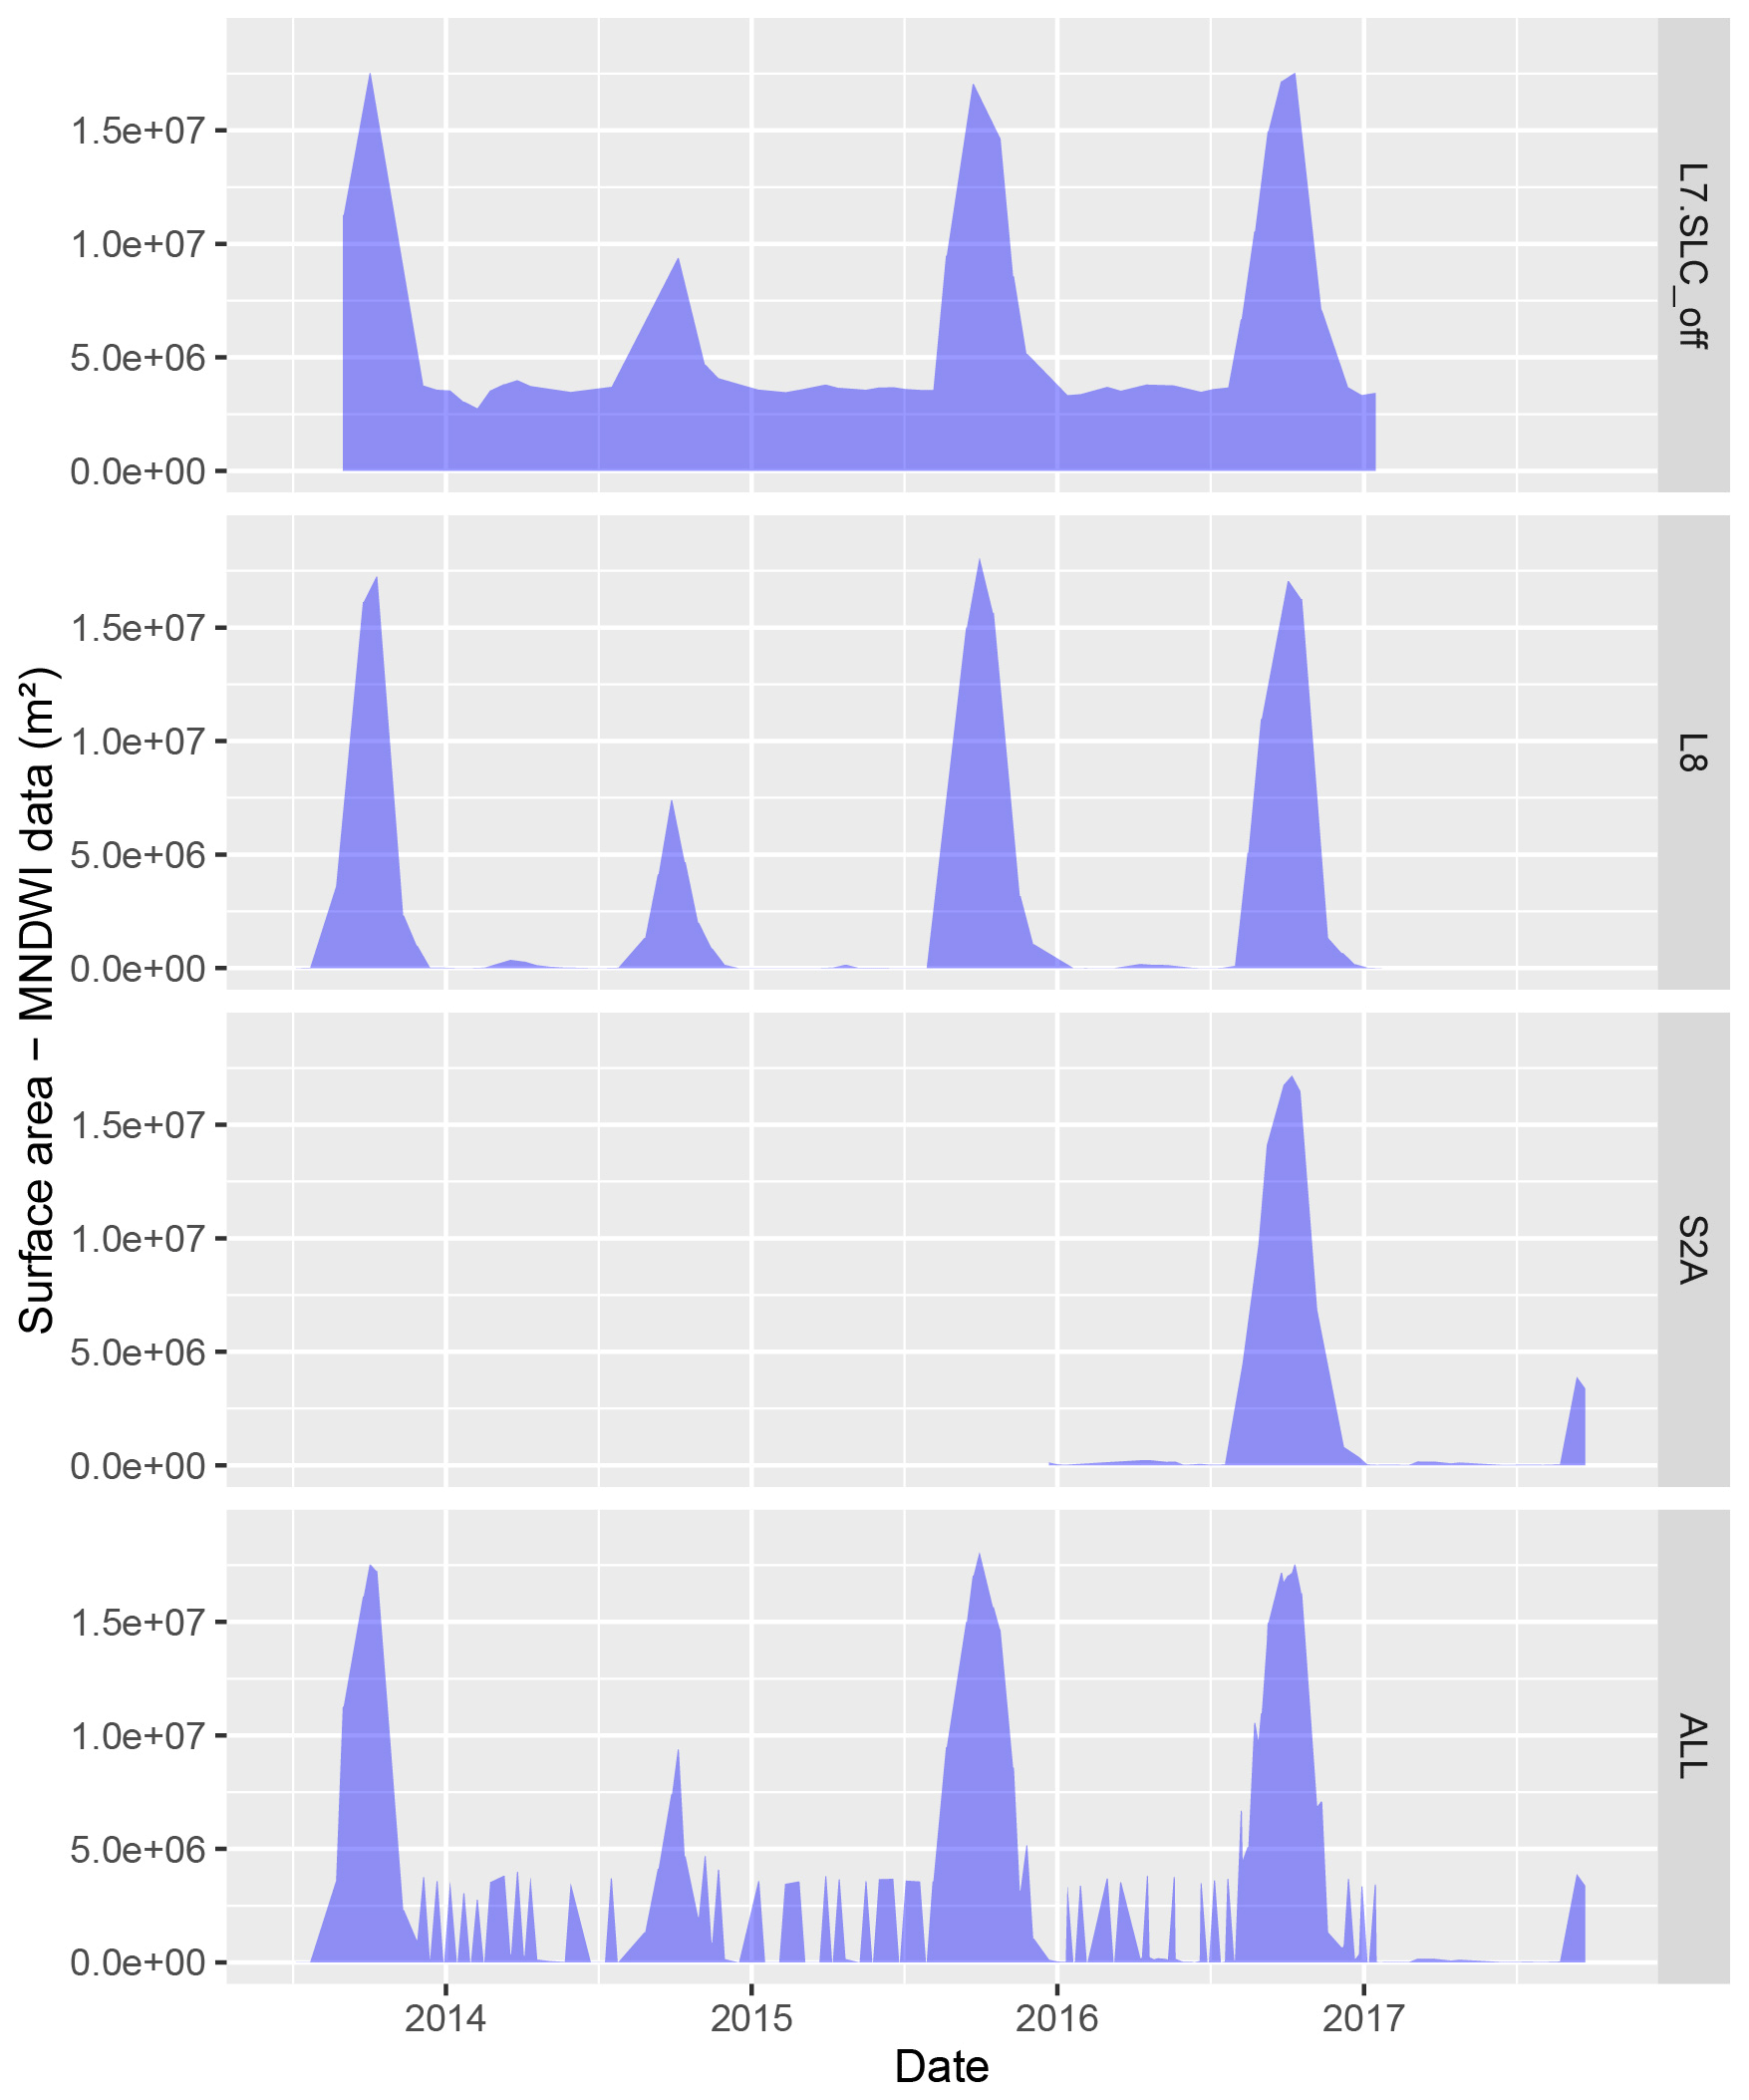
Figure 3Monitoring of the flood dynamic in the Podor floodplain over 2013–2016 with multispectral imagery from Landsat 7, Landsat 8, Sentinel 2A satellites and their combination.
The analysis of the percentage of pixel loss from clouds, shadows and SLC failure after 2003 over the study area showed a low sensitivity to clouds and shadows, possibly due to many thin, cirrus clouds, which allowed setting a high threshold (40 %) to exclude cloud and shadow interferences. The repetitivity of images from multiple sources and the gradual flood rise also lead to the flood rise being relatively well represented (Fig. 3), unlike in other areas (Ogilvie et al., 2015).
The benefit of combining radar (e.g. Sentinel-1) and optical imagery during the rainy season to overcome dense cloud cover may then be lower in this setting. Interference from SLC failure (bands with no data between 60 to 420 m wide and reducing at the centre of the image) are however important here, considering the location of Podor on the edge of the Landsat tiles. These affect on average 18 % of the Podor floodplain and are visible in the noise (systematic overestimation) during dry seasons between 2003 and 2013 notably (Fig. 2). Temporal and spatial interpolations approaches must therefore be used (Zeng et al., 2013) to reduce uncertainties from SLC pixel loss. Benefits of pan-sharpening 20 m Sentinel-2 bands to 10 m to detect the numerous narrow inlets and increase accuracy of water bodies of this size may also be investigated.
3.2 Relationship between flooded areas and stage data
Figure 4 illustrates the good correlation between stage levels at Podor gauging station in the Senegal River and the peak flooded area in the Podor floodplain. Values obtained with Landsat and Sentinel-2 are coherent with results from previous research which used 8 SPOT 2 and 4 20 m resolution images of the flood peak during the 1990s. Surface area for the 1999 maximum flooded area are notably close, 2.9 % lower with SPOT than Landsat 7. The additional data allows the relationship to be extended and refined notably for lower floods. Similar relations using discharge rather than stage levels can also be developed.

Figure 4Relationship between stage data at Podor and remotely sensed flooded areas in the Podor floodplain during flood peak, (i) with 8 SPOT images (black line), (ii) with Landsat and Sentinel-2A imagery (blue line).
Importantly, Fig. 5 highlights the opportunity to refine this relationship and distinguish between the relationship during the flood rise and during the flood decline. The high temporal resolution allows us to discern the importance of the hysteresis process, resulting in a slower decline of flooded areas as water remains captive by naturals weirs in the floodplain (cf. Fig. 5), which must be accounted for in hydrological modelling. Additional field data over years of low (2017) and high floods (2018) will help further refine these relationships.
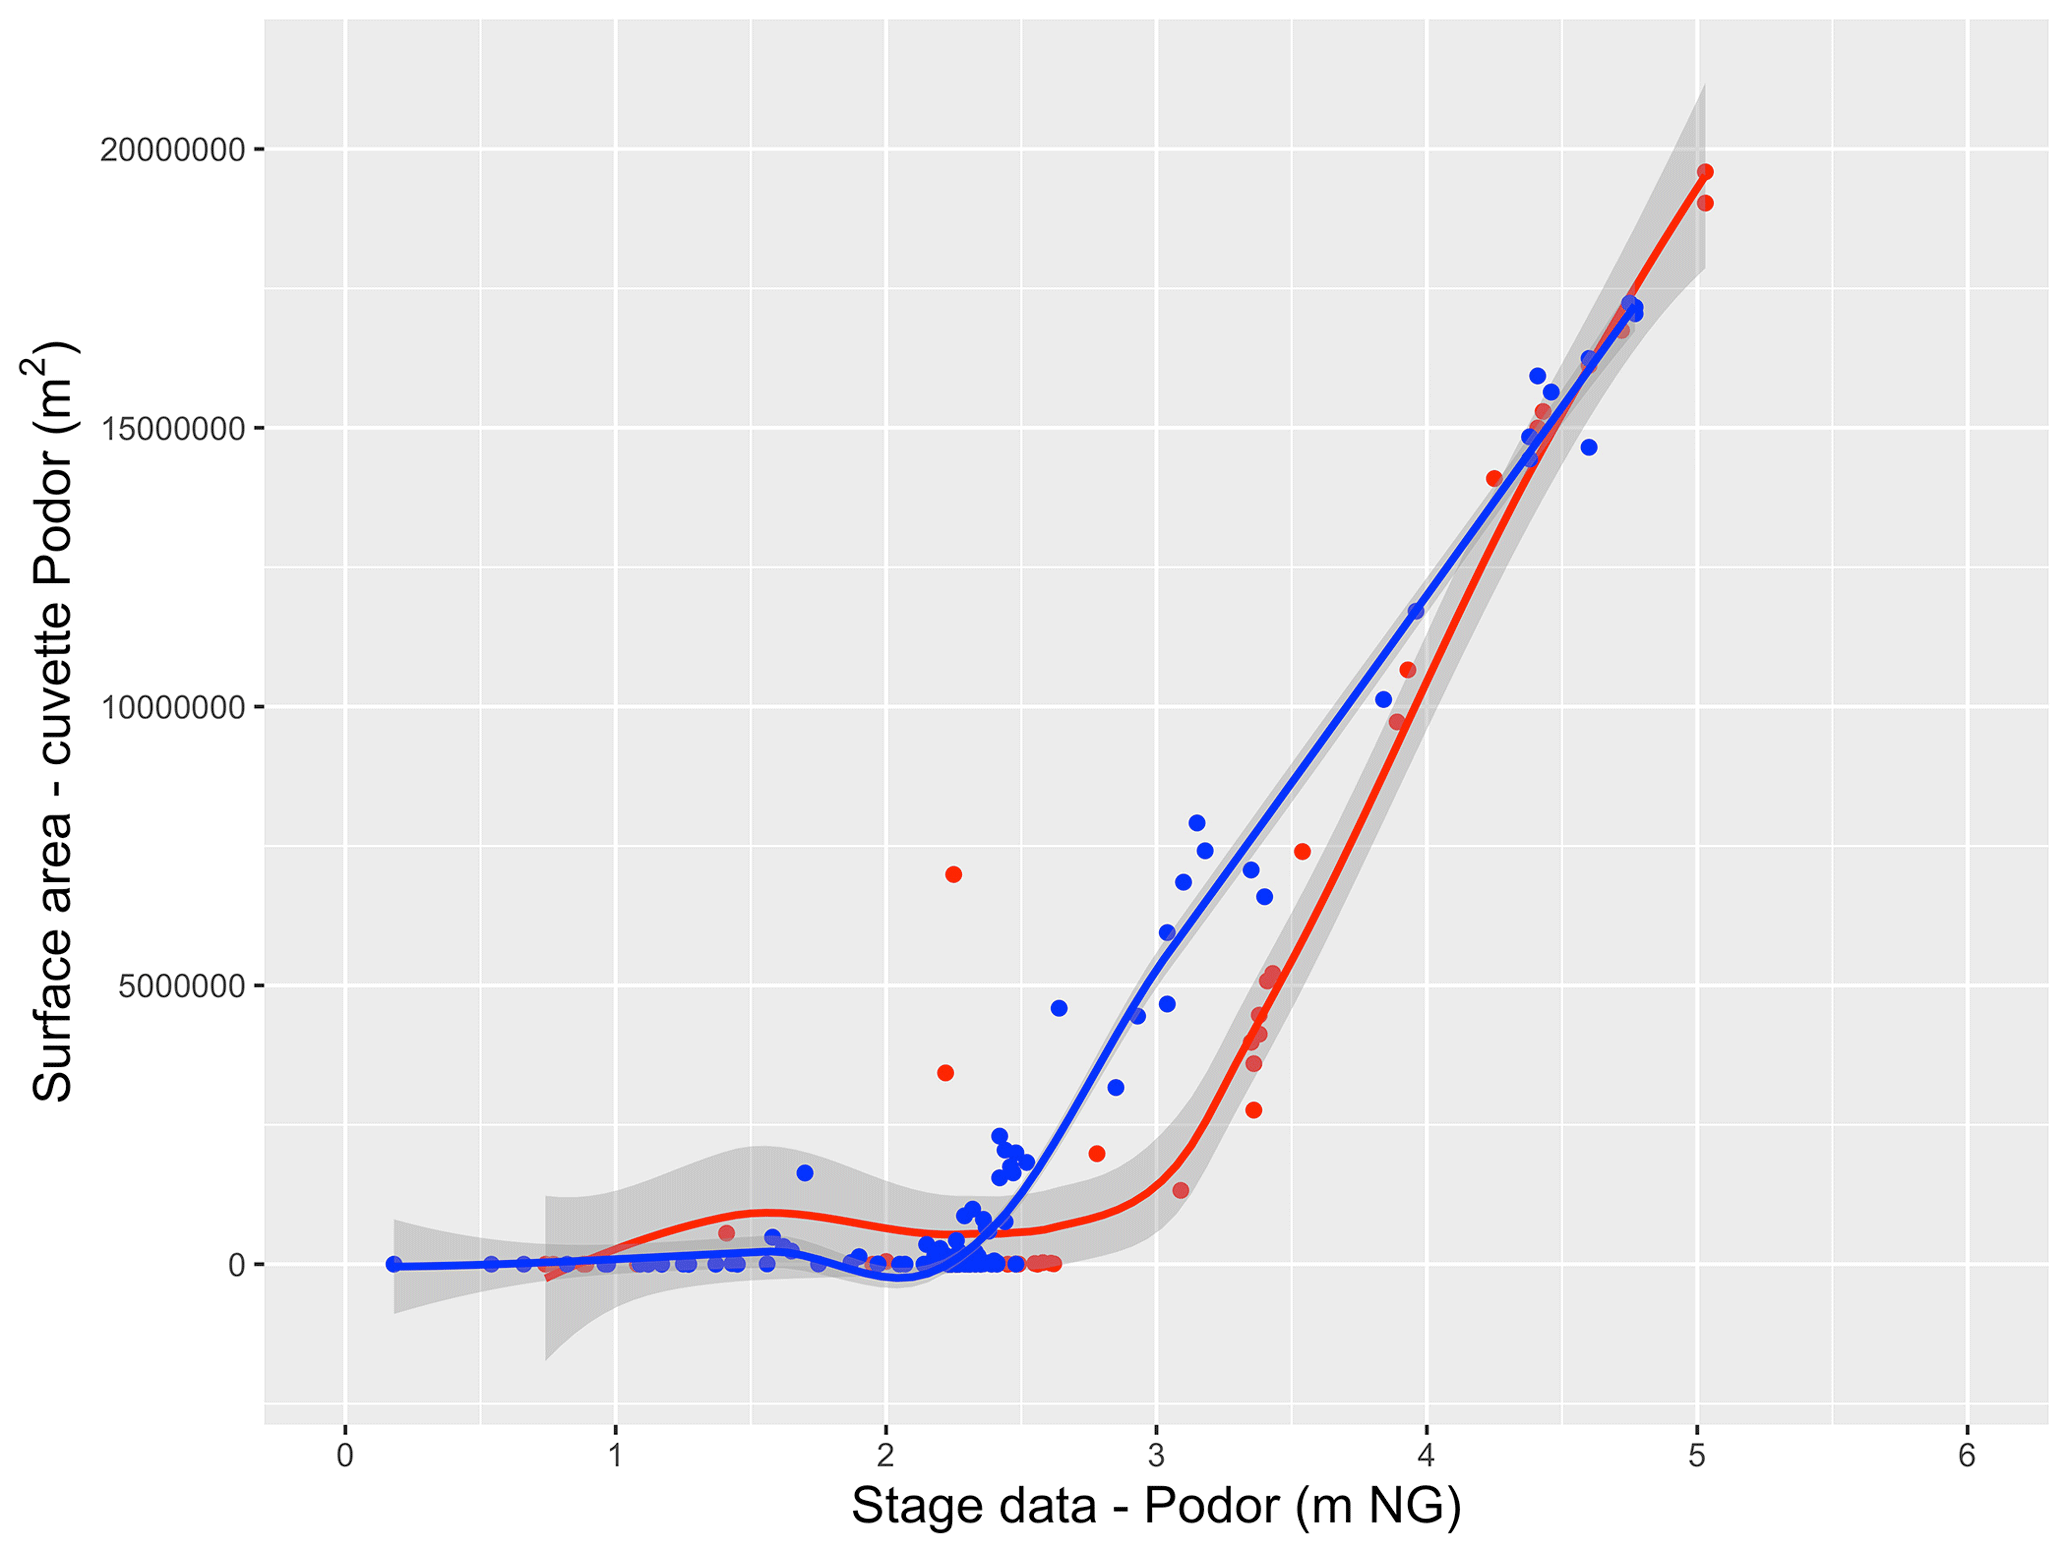
Figure 5Relationship between stage data at Podor and remotely sensed flooded areas in the Podor floodplain as the flood rises (red line) and recedes (blue line), revealing the strong hysteresis.
The analysis of 443 Landsat 5–8 images between 1999–2017 and 48 Sentinel-2A images between 2015–2017 confirms the possibility of monitoring interannual and intra-annual floods within the depressions of the Senegal River floodplain over 1999–2017. The MNDWI threshold was successfully calibrated against photointerpretation of very high-resolution UAV imagery (20 cm, 600 ha) of surface water. Further research to assess the accuracy and efficiency of automatic photointerpretation attempts are required, as well as to investigate the benefits in terms of accuracy and treatment time (automation) of multispectral UAV imagery (e.g. Sequoia sensors). Remote sensing analysis reproduces the amplitude and dynamic of surface water variations in the floodplain and values are coherent with hydrological data acquired on site. The availability of a higher number of remote sensing observations. It also identifies the hysteresis phenomena and accordingly distinguishes a different S=f(Z) relationship during the rise and decline phase of the flood (Fig. 5).
Ongoing observations will provide additional field data to refine this research and quantify the benefits of pan-sharpening 20 m bands to 10 m, and from raised image availability (every 5 d with the S2A and S2B constellation of satellites). The benefits of Radar imagery to increase image availability when cloud cover is dense will also be explored. Long term series will then be used to provide spatialised information of the timing and duration of the flood across the floodplain. Combined with observations of soil humidity and agricultural practices in situ and by remote sensing, this work will seek to establish relationships between the flooded areas and the agricultural benefits as well as identify strategies to support farmers (sowing dates, suitable crops, water management ...). High-resolution topography of the floodplain will also allow water depths to be estimated from remotely sensed surface areas, providing valuable information to stakeholders to understand how water management in these heavily cultivated areas may be optimised based on weirs and sluice gates to reduce water intake or increase its retention.
Replicated to multiple lakes in the 250 000 ha Senegal River floodplains, this approach can then provide essential insights into the agricultural benefits provided by the annual flood in these depressions. Ultimately, these findings will be integrated into a hydrological model of the Senegal River to understand how upstream changes in land use, water management (dams, releases) and climate are modifying the flood regime and the services provided by these socio-hydrosystems.
Landsat surface reflectance imagery is available from USGS EarthExplorer. Level 2A Sentinel-2 imagery can be accessed via CNES THEIA (http://theia.cnes.fr, last access: 24 July 2020).
AO performed the analyses and interpretation and wrote the manuscript. DD, DM, GN, JCB, JCP, contributed to data acquisition, project management and improving the manuscript.
The authors declare that they have no conflict of interest.
This article is part of the special issue “Hydrological processes and water security in a changing world”. It is a result of the 8th Global FRIEND–Water Conference: Hydrological Processes and Water Security in a Changing World, Beijing, China, 6–9 November 2018.
The authors are grateful for the hydrological data supplied by the OMVS.
This research has been supported by the ANR LEAP-AGRI (grant no. ANR-18-LEAP-0002) and the FSP Agricora Generia project.
Descroix, L., Guichard, F., Grippa, M., Lambert, L. A., Panthou, G., Mahé, G., Gal, L., Dardel, C., Quantin, G., Kergoat, L., Bouaïta, Y., Hiernaux, P., Vischel, T., Pellarin, T., Faty, B., Wilcox, C., Malam Abdou, M., Mamadou, I., Vandervaere, J.-P., Diongue-Niang, A., Ndiaye, O., Sané, Y., Dacosta, H., Gosset, M., Cassé, C., Sultan, B., Barry, A., Amogu, O., Nka Nnomo, B., Barry, A., and Paturel, J.-E. : Evolution of surface hydrology in the Sahelo-sudanian strip: An updated review, Water, 10, 748, https://doi.org/10.3390/w10060748, 2018.
Hagolle, O., Huc, M., Pascual, D., and Dedieu, G.: A Multi-Temporal and Multi-Spectral Method to Estimate Aerosol Optical Thickness over Land, for the Atmospheric Correction of FormoSat-2, LandSat, VENUS and Sentinel-2 Images, Remote Sens., 7, 2668–2691, https://doi.org/10.3390/rs70302668, 2015.
Montanari, A., Young, G., Savenije, H. H. G., Hughes, D., Wagener, T., Ren, L. L., Koutsoyiannis, D., Cudennec, C., Toth, E., Grimaldi, S., Blöschl, G., Sivapalan, M., Beven, K., Gupta, H., Hipsey, M., Schaefli, B., Arheimer, B., Boegh, E., Schymanski, S. J., Di Baldassarre, G., Yu, B., Hubert, P., Huang, Y., Schumann, A., Post, D., Srinivasan, V., Harman, C., Thompson, S., Rogger, M., Viglione, A., McMillan, H., Characklis, G., Pang, Z., and Belyaev, V.: Panta Rhei-Everything Flows: Change in hydrology and society-The IAHS Scientific Decade 2013–2022, Hydrolog. Sci. J., 58, 1256–1275, https://doi.org/10.1080/02626667.2013.809088, 2013.
Neal, J., Schumann, G., and Bates, P.: A subgrid channel model for simulating river hydraulics and floodplain inundation over large and data sparse areas, Water Resour. Res., 48, W11506, https://doi.org/10.1029/2012WR012514, 2012.
Ogilvie, A., Belaud, G., Delenne, C., Bailly, J. S., Bader, J.-C., Oleksiak, A., Ferry, L., and Martin, D.: Decadal monitoring of the Niger Inner Delta flood dynamics using MODIS optical data, J. Hydrol., 523, 368–383, https://doi.org/10.1016/j.jhydrol.2015.01.036, 2015.
Ogilvie, A., Belaud, G., Massuel, S., Mulligan, M., Le Goulven, P., and Calvez, R.: Surface water monitoring in small water bodies: potential and limits of multi-sensor Landsat time series, Hydrol. Earth Syst. Sci., 22, 4349–4380, https://doi.org/10.5194/hess-22-4349-2018, 2018.
Sivapalan, M., Savenije, H., and Bloschl, G.: Socio-hydrology: A new science of people and water, Hydrol. Process., 26, 12700–1276, https://doi.org/10.1002/hyp.8426, 2012.
Xu, H.: Modification of normalised difference water index (NDWI) to enhance open water features in remotely sensed imagery, Int. J. Remote Sens., 27, 3025–3033, https://doi.org/10.1080/01431160600589179, 2006.
Zeng, C., Shen, H., and Zhang, L.: Recovering missing pixels for Landsat ETMC SLC-off imagery using multi-temporal regression analysis and a regularization method, Remote Sens. Environ., 131, 182–194, https://doi.org/10.1016/j.rse.2012.12.012, 2013.
Zhu, Z. and Woodcock, C. E.: Automated cloud, cloud shadow, and snow detection in multitemporal Landsat data: An algorithm designed specifically for monitoring land cover change, Remote Sens. Environ., 152, 217–234, https://doi.org/10.1016/j.rse.2014.06.012, 2015.