the Creative Commons Attribution 4.0 License.
the Creative Commons Attribution 4.0 License.
 | 16 Sep 2020
Extreme hydrological phenomena in the forest steppe and steppe zones of Ukraine under the climate change
Valeriya Ovcharuk
Eugene Gopchenko
Nataliya Kichuk
Zhannetta Shakirzanova
Liliia Kushchenko
Mariia Myroschnichenko
Nowadays, during the period of the global climate change, scientists around the world have noticed an increased incidence of extreme natural disasters. The authors of the study suggested methods of using climate change as a part of a genetic model of maximal floods runoff. This model makes possible the introducing of “climate changes” directly through the maximal stocks of snow and precipitation during the spring flood and runoff coefficients. The object of study is the basin of the Southern Bug – one of the largest rivers in Ukraine, which flows within two geographical zones – forest-steppe and steppe. Overall results using scenario RCP 4.5 showed a decrease of runoff by the end of 2050 from 20 % in the north part of the basin (the forest-steppe zone) to 50 % – in the south (the steppe part of basin). On the other hand, the characteristics of minimal river flow in the Southern Bug basin – winter and summer low waters had been analyzed. One option for low water flow simulation is to study the connection between the drought index (e.g. SPEI) and the minimal water. Studies show that such correlation exists, so knowing the forecast of drought index it is possible to project the value of minimal water discharge, which is the object of the research.
- Article
(2300 KB) - Full-text XML
- BibTeX
- EndNote


Global climate change has been studied in recent decades, practically all over the world. Thus, according to the leading experts (CRED, 2019), natural disasters causing the negative impact on the development of the world economy, have recently become more common on our planet. For the period from 2007 to 2016 the number of natural disasters has been only 354, whereas in 2017 it rose to 335! In particular, in Europe, according to the European Environment Agency (EEA, 2019), in the EEA member states, the total economic losses from climate-related extremes over the period 1980–2017 reached approximately EUR 453 billion. The average annual economic losses in the EEA member states varied from EUR 7.4 billion in 1980–1989 to EUR 13.0 billion in 2010–2017. The most expensive climate-related extremes in the EU member states included floods in Central Europe in 2002 (over EUR 21 billion), drought and heat waves in 2003 (almost EUR 15 billion), the 1999 Lothar winter storm and floods in Italy and France in October 2000 (both were about EUR 13 billion). Thus, the considerable economic losses and potential danger from climate-related extremes are of great interest to scientists all over the world and they need to be studied, systematized and modeled for probabilistic and operational forecasting. Among the results of the last 5 years the Chinese scientists research on the effects of solar activity on floods and droughts (Li et al., 2015), an assessment of the effects of climate change on hydrological extremes – floods and droughts within the territory of Poland (Romanowicz, 2017); a thorough corporate study by European scientists on the effects of climate change on the water resources of Europe's largest water artery – the Danube Basin (Bisselink et al., 2018) should be noted. Similar researches are done about the rivers of Algeria (Kouidri et al., 2019) and the Canadian Prairies (Akhter and Azam, 2019). In Ukraine, the research of the water regime of rivers and its changes nowadays is actively done by the scientists of Taras Shevchenko National University and their colleagues from the Potsdam Institute for Climate Impact Study (Lobanova et al., 2018), representatives of the Ukrainian Hydrometeorological Institute (Zabolotnia et al., 2019) and Odessa State Environmental University (Loboda et al., 2019).
Mathematical models are very important in planning water resources management and, consequently, different types of models with varying degrees of complexity have since been developed and still improved by scientists from different countries (Zhao et al., 1980; Singh, 1988; Bergstorm, 1992; Kan et al., 2017). Nowadays, scientific literature presents more advanced conceptual models with distributed parameters and even models using artificial neuronal networks (Sajikumar and Thandaveswara, 1999; Tokar and Markus, 2000), which makes it possible to determine the rivers runoff at separate catchment's areas with sufficient accuracy, using a large amount of source information, but for ungauged catchments, such models are not applicable. The basis of the calculation of the maximal flow of floods in the considering territory is the theory of channel isochrones, implemented in the form of a two-operator model of a river runoff formation, developed at the Odessa State Environmental University. Its advantage is that it is universal both in terms of the genetic type of floods, and the size of catchment's areas.
The operator model (of Gopchenko and Ovcharuk, 2006) makes it possible to determine separately the characteristics of the slope inflow (the depth of flood runoff, the duration of the slope inflow and the temporal non uniformity of slope inflow to the channel network) and to take into account the natural process of precipitation transformation into the river bed in the structure of “slope inflow – channel runoff”.
Ovcharuk and Gopchenko (2015), modified that operator model next which allowed to take into account “climatic correlations” directly at maximal snowfalls, precipitation and runoff coefficients during the period of floods. The block diagram of this model is presented in Fig. 1.
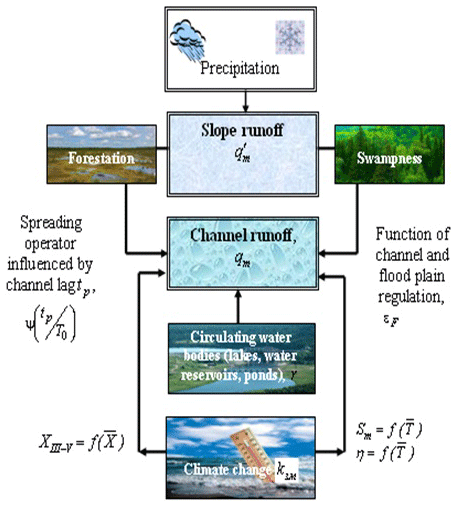
The modified version of the operator model is proposed as a calculation method determining the maximal runoff of ungauged rivers during the spring floods period, and the calculated equation is:
Where r – is the coefficient which takes into account the influence on qm circulating water bodies (lakes, water reservoirs, ponds); εA – is the coefficient of channel and flood plain regulation that depends on catchments' size; ψ(tp∕T0) – is the transformation function influenced by channel lag; λp – is the transition coefficient from the 1 % probability of excess to any other; – is the maximal slope modulus that is equal to
where – is the coefficient of time nonuniformity of slope inflow; T0 – is the duration of slope influx, hours; η – is the runoff coefficient; Sm – is the maximal stock of snow, mm; ΣP – is the precipitation during the spring flood, mm; kch – is the coefficient of climate change that is equal to
In Eq. (3) the average forecast values of the average maximal stocks of snow, precipitations and spring floods coefficient over a longtime period, are determined using their dependencies, from the forecasted temperature and precipitation with using any scenario and model for the selected calculating period. The same actual values are obtained from the results of calculations for available time series of meteorological observations.
Standard methods of statistical processing and their generalization in space in the form of isoline maps have been used to determine the calculating characteristics of the dry weather flow. In order to study the relation between the minimum river runoff and hydrological droughts, the standardized precipitation-evapotranspiration index (SPEI), proposed in the works of Vicente-Serrano has been used (Vicente-Serrano et al., 2010). The winter and summer–autumn dry weather flow has been considered, and the statistical relation between the SPEI index and the runoff parameters has been estimated using the linear Pearson correlation coefficient (Semenova et al., 2014).
The object of the study is the territory of the Southern Bug river basin, which lies within two natural zones (the upper part of the basin is the forest-steppe zone, and the lower part is the steppe) and includes the main watercourse – the Southern Bug river, its main tributaries – the rivers Riv, Sob, Savranka, Kodima, Sinukha, Ingul, and others (Fig. 2).
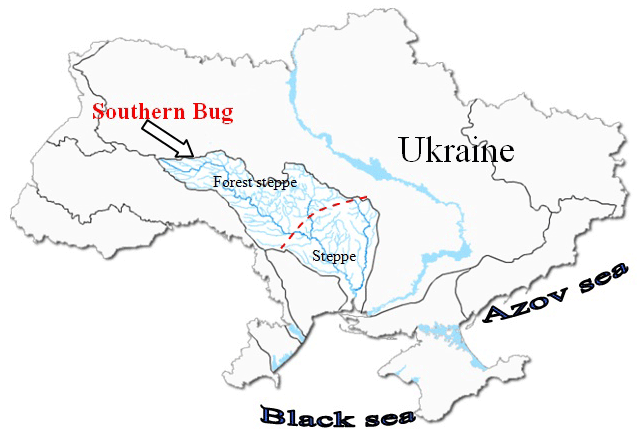
Figure 2Location of the Southern Bug basin.
Output data on the characteristics of maximal runoff have been used as long-term data series for 39 water gauging station (WGS), and for the minimal runoff characteristics the data of 35 WGS have been used, which have long time series of runoff observations from their beginning to 2010. The range of catchment's areas covers basins in the size from 36.5 km2 (river Southern Bug – Chorniava village) to 46 200 km2 (river Southern Bug – Oleksandrivka village).
3.1 The maximal runoff
During the spatial-temporal generalizations of the maximal runoff characteristics, the cycle of the fluctuations of the maximal runoff of spring flood has been analyzed and homogeneity of the initial information has been estimated. Statistical processing of the initial time-series of maximal snow supplies, maximal discharges and runoff depths has been carried out. For the determination of precipitation in the spring period, the regional calculation formula is proposed, and the maximal stocks of snow (Fig. 3) and the coefficients of their variation are generalized in a form of the map.
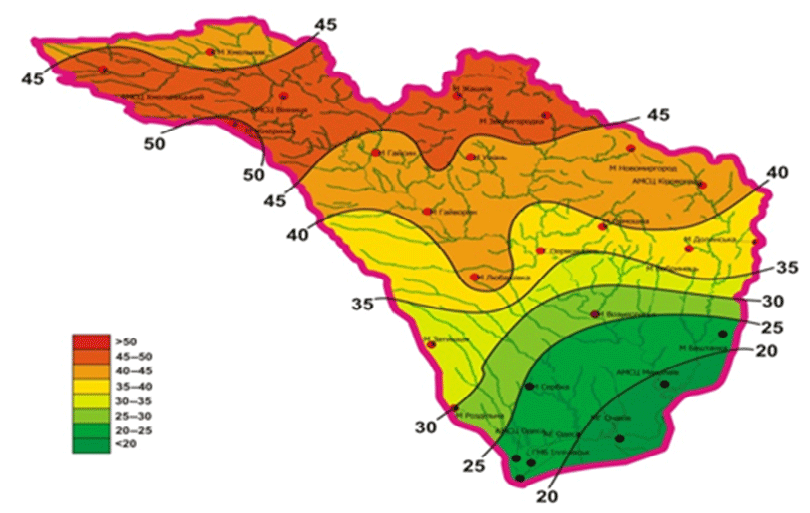
Figure 3Distribution of average long-term maximal stocks of snow in the basin of the Southern Bug River, mm.
The runoff coefficients are determined through the coefficients of runoff formation, which are generalized in a form of the map and taking into account the coefficients of the influence of the size of the catchments on the losses of the runoff in the spring flood period. The characteristics of the slope influx, which are an important component of the calculation scheme, are represented by the maximal slope modulus, which in turn is determined by the coefficient of unevenness of the sloping influx, the duration of the flow into the channel network and the total water supplies to the catchments. All listed parameters are valid for the studied territory, in particular, the duration of the sloping influx represented on Fig. 4.
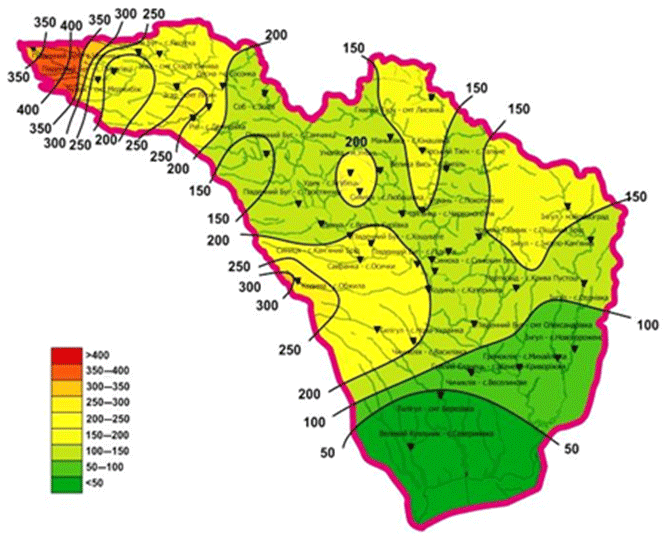
Figure 4Distribution of the duration of sloping influx during the spring flood in the basin of the Southern Bug, hours.
The transformation of the maximal slope modulus is represented by functions that take into account the channel time, flood-plain regulation and the impact of lakes and reservoirs. For the determination of the transformation function and the coefficients of flood-plain regulation, the equations of exponential form are derived, with separate parameters in natural zone Eqs. (4)–(5)
where γ – is the exponent, the value of which for the forest-steppe zone is 0.43, and for the steppe is 0.48.
where A – the catchments areas, km2.
The calculation of the climate change coefficients for the rivers of the Southern Bug basin by the model RACMO2, RCP 4.5 and RCP 8.5 scenarios is presented in the form of diagrams (Figs. 5 and 6).
Consequently, analyzing the obtained results, we can conclude that in the basin of the river Southern Bug the value of runoff during spring floods can significantly change in the future. The analysis of the results obtained in the scenario RCP 4.5 shows that there is a certain cycle in the climate change dynamics. The kch=0.93 indicates a spring runoff decrease for the period 2011–2016 in the upper part of the basin (the Southern Bug river – Pirogovtsy village), and kch=0.58 in the lower part of the basin (the river Gromokliya – Mikhailivka village), that means that spring runoff is expected to decrease almost twice.

Figure 5Expected average annual values kch for taking into account the influence of climate change on the maximal runoff of spring flood of the rivers of the Southern Bug basin using the model RACMO2, scenario RCP4.5
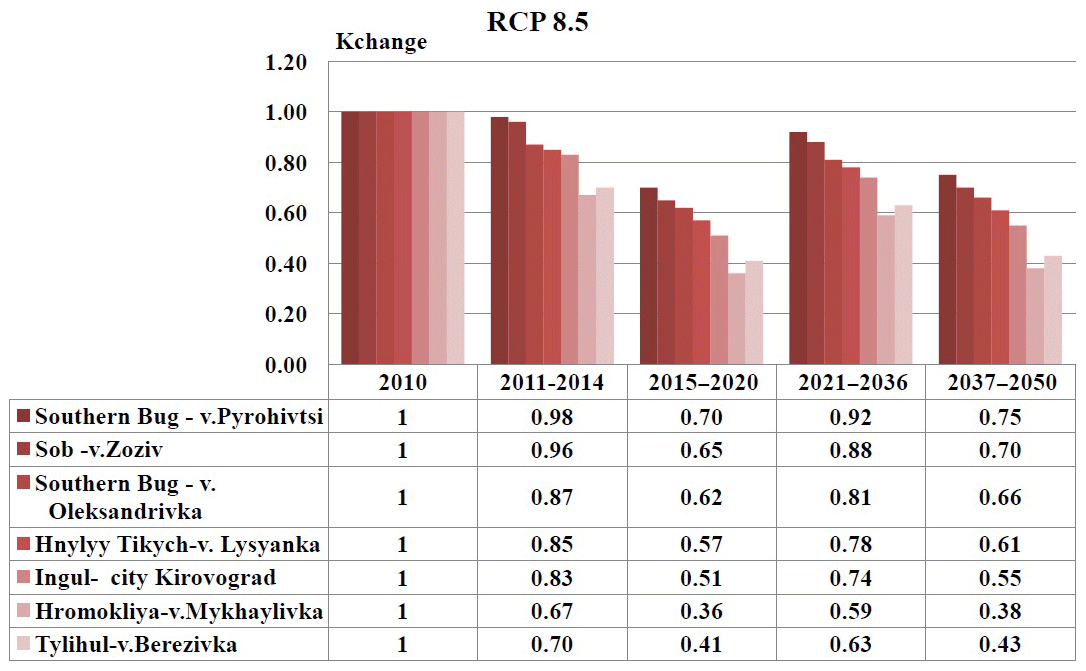
Figure 6Expected average annual values kch for taking into account the influence of climate change on the maximal runoff of spring flood of the rivers of the Southern Bug basin using the model RACMO2, scenario RCP8.5
For the period (2017–2020), the runoff decrease is forecasted, compared with the previous period, so kch=1.14 and kch=0.79, respectively. For the period 2021–2035 the climate change coefficients equal kch=0.75 (river Southern Bug – village Pirogovtsy) and kch=0.38 (river Hromokliya – Mikhailivka village), which suggests a spring runoff decrease. For the period 2036–2039 kch is 1.09 and 0.70, respectively, that indicates a runoff increase compared to the previous period. For the period 2040–2050 the climate change coefficients are kch=0.85 (the river Southern Bug – Pirogovtsy village) and kch=0.46 (the river Hromokliya – Mikhailivka village). In general, according the scenario RCP 4.5, there is a runoff decrease by the end of 2050 from 20 % in the north and up to 50 % in the south of the studied area. Similar results are obtained using calculations of climate change in the scenario RCP 8.5 (Fig. 6): the climate change coefficients indicate a runoff decrease for the periods 2011–2014 and 2015–2020, with average kch=0.84 in the basin, i.e. the 16 % spring runoff decrease is forecasted.
For the next period (2021–2036), the climate change coefficients indicate the runoff increase compared to the previous periods. It equals kch=0.92 in the upper part of the basin (the river Southern Bug – Pirogovtsy village) and kch=0.59 in the lower part of the basin (the river Hromokliya – Mikhailivka village).
For the period 2037–2050 the coefficients of climate change equal kch=0.75 (the river Southern Bug – Pirogovtsy village) and kch=0.38 (the river Hromokliya – Mikhailivka village), that suggests a runoff decrease. In general, there is a spring runoff decrease of 60 % in the scenario RCP 8.5.
For the purpose of preliminary estimation of the performed forecasts, the time series of the maximal spring flood discharges for the station with the longest number of observations of the river Southern Bug – village Oleksandrivka (Fig. 7) have been investigated.
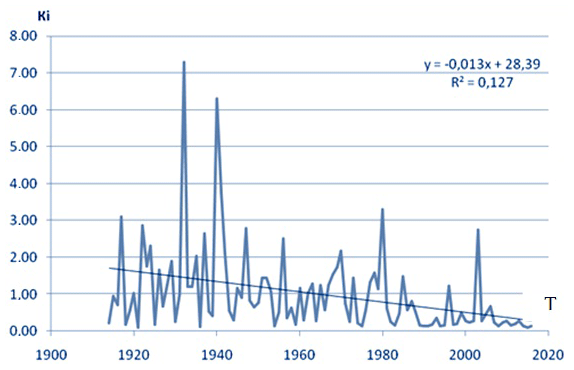
Figure 7The time series of maximal water discharges of spring floods on the river Southern Bug – village Oleksandrivka, A = 46 200 km2.
The chronological diagram of the maximal water discharges (in modulus coefficients) according to the long-term observations (until 2016), indicating the continuation of the trend towards a runoff decrease shows the likeliness of tendency so the forecast about decrease, approximately 20 %, of the maximal water discharges during the period of spring floods for the period 2011–2016, in both scenarios is confirmed.
These results are also in good agreement with recent studies of European scientists. In the last decades of the retrospective period, a gradual warming of climate has been in progress as a main factor in changes in water resources in European river basins (Best, 2019; Stagl and Hattermann, 2015; Bisselink et al., 2018). Those changes include an increase in the frequency of occurrence of extreme rainfalls (in short periods of time), the formation of catastrophic floods from them, and a decrease in the water resources of large territories with an increasing evaporation (Best, 2019; Loboda et al., 2019).
As the average annual air temperature rises, especially in the winter months, there is a decrease in the amount of snow in the annual rainfall. It leads to general trends in river runoff in the spring (from snowmelting) and its increase in autumn and winter (from rainfalls) (Bormann, 2010; Blöschl et al., 2017, 2019).
However, as it was noted by the authors (Bolbot and Grebin, 2019), in the present period of the water regime (after 2008), the characteristics of the minimal runoff (both summer and winter) also tend to decrease and continuation of monitoring is needed.
3.2 The minimal runoff
The analysis of minimal runoff long-term fluctuations and the most dry water periods, which are characterized by the lowest water losses per year, has been performed according to the average monthly summer and winter minimal water discharges data, as the most stable characteristics, as well as the minimal daily water discharges data during these water periods. In general, the lowest dry weather flow is typical for the summer–autumn period in the basin of the Southern Bug, when there is a depletion of groundwater forming the runoff. Sometimes the summer low flow is broken with sudden water level rise caused by rainfalls and the formation of floods on the rivers. The winter low flow is higher, as a result of the underground water flow increase, the reserves of which are formed from the autumn period, as well as due to the supply of groundwater with melt water and rainwater during the winter thaw.
In general, as it is known, the minimal river runoff is caused by the geographical zonality, but the fact that the hydrogeological conditions of the catchment can have a significant impact on its values must be considered. The influence of karst can be manifested by the values of the small rivers runoff (on the areas less than 1000 km2). For such water catchments, the dry weather runoff can be different from the average one, typical for that climate zone, as a result of mismatches between surface and underground catchments areas.
As it was illustrated in the Fig. 8, during the winter low water period, the 30 d minimal modulus of 80 % probability (in conditions of a stable freezing) reduces in the direction from the northwest (from 0.5–1.0 L (s km2)−1) to almost zero values – in the south-east.
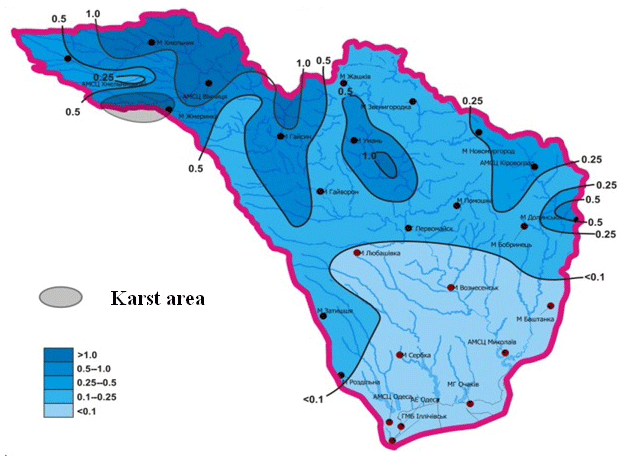
Figure 8Distribution of 30 d minimal runoff modulus with 80 % probability during the winter period with stable freezing in the basins of the Southern Bug River L (s km2)−1.
The increased values (up to 1.71 L (s km2)−1 belong to the basin of the river Riv – Demidovka village, with karst rock formation. For this area, we propose the adjustment coefficient (kkars). The adjustment coefficient for the rivers of the studied territory is 3.5. The spatial distribution of (q30)80 % for the period of the open channel (in the presence of stable freezing on the rivers) is characterized by the same regularity, but the modules decreases in the direction from the northwest to the northeast and the south – from 0.8 L (s km2)−1 to almost zero values (Fig. 9).
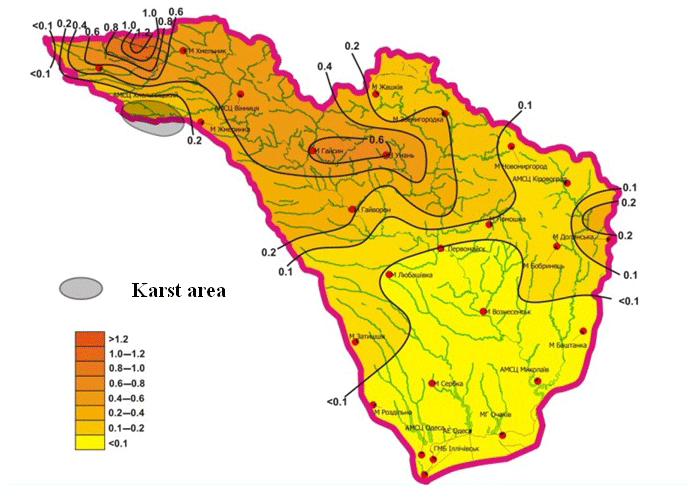
Figure 9Distribution of 30 d minimal runoff modules of 80 % supply for the period of open channel with stable freezing in the basin of the Southern Bug, L (s km2)−1.
As it has been mentioned before, the largest modulus (q30)80 % are observed in the basin of the river Riv – Demidivka village, but the adjustment coefficient kkarst reaches 5.85, which is almost 2 times higher than the same coefficient for the winter low water.
As it was noted above, one of the objectives of this study was to find the relation between runoff characteristics during the mean water period and the SPEI drought index. Figure 10 shows the correlation dependencies between the SPEI index, for different time scales and the value of the minimal runoff using the example of the river Southern Bug – village Oleksandrivka (catchment's area A = 46 200 km2). Analyzing the results of the minimal runoff (Fig. 10a, b), you can note that for the summer–autumn low water runoff for SPEI on the scale of 1–2 months, the values of the correlation coefficient are in most cases insignificant, but from 3 and up to 48 months R is significant and changes slightly in the range from 0.55 to 0.65.
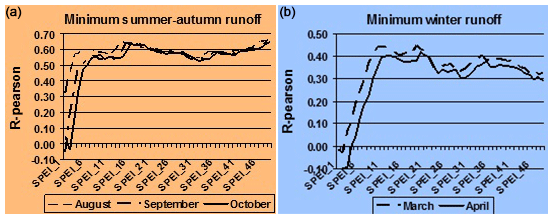
Figure 10Correlation between the minimal river runoff and SPEI on scales of 1–48 months for the river Southern Bug – village Oleksandrivka.
These relations are evidently explained by the fact that the summer–autumn mean water runoff is mainly determined by the water content of the year, but it can be broken by separate summer rain floods, therefore SPEI_3 for August characterizes the minimal runoff during 3 summer months and has R=0.57. The index values for September and October become significant on scales beginning from 4–5 months and characterize the whole autumn-summer period.
Concerning the winter low water runoff, the distribution is characterized with a shift towards an increase in the scale at which the interrelation becomes significant up to 9–12 months. It is worth noting that during the winter mean water period, the runoff regime is determined mainly by seasonal underground supply, the reserves of which have been formed since autumn, but during the warm years which have been prevalent over the few last decades, the melt and rain waters of winter thaws also became a part of it. Apparently, this combination of factors leads to lower interrelation coefficients (Rmax = 0.44–0.45); they are significant for scales from 9 to 46 months.
The review of the normative framework in the field of calculations of maximal runoff showed that despite the vast experience gained by scientists in this issue, the problem is still far from its solution due to the multifactority of the investigated phenomenon and regional features of the forming of maximal runoff on the rivers.
The authors have proposed a new modified version of the operator model for determining the maximal runoff of spring flood, which allows taking into consideration the possible impact of climate change on the estimated values of the maximal modules 1 % probability of exceeding.
Climate change is taken into account by introducing a separate coefficient, based on a comparison of the main parameters of the method obtained on the basis of current data (maximal snow supply at the beginning of the spring flood, precipitation during the spring flood and runoff coefficients), and similar values obtained from climatic modeling data.
For the territory of forest-steppe and steppe zone of Ukraine on the example of the Southern Bug basin the author's modified version of the calculating method for determining the characteristics of spring flood in climate change conditions has implement. The implementation of the proposed calculation option using different models and scenarios has shown that the results differ significantly, but in practically all cases up to 2050 a significant decrease in the runoff of spring flood (from 10 %–20 % in the forest-steppe and 40 %–50 % in the steppe zone) is forecasted.
The estimation of the statistical connection between SPEI in different time scales and minimal river runoff of the Southern Bug River during the period 1950–2010 showed that the obtained dependencies are significant, that gives an opportunity to use the drought index in the hydrological processes modeling in the forest-steppe and steppe zones of Ukraine.
Data are available upon request to the contact author.
EG and VO developed mathematical model, NK, ZS and LK performed the simulations, VO analyzed the data and prepared the manuscript with contributions from all co-authors, MM is responsible for translation and redaction of manuscript.
The authors declare that they have no conflict of interest.
This article is part of the special issue “Hydrological processes and water security in a changing world”. It is a result of the 8th Global FRIEND–Water Conference: Hydrological Processes and Water Security in a Changing World, Beijing, China, 6–9 November 2018.
Akhter, A. and Azam, S.: Flood-Drought Hazard Assessment for a Flat Clayey Deposit in the Canadian Prairies, Journal of Environmental Informatics Letters, 1, 8–19, 2019.
Bergstorm, S.: The HBV model – its structure and applications, SMHI Reports RH, 4, Norrkping, Sweden, 35 pp., 1992.
Best, J.: Anthropogenic stresses on the world's big rivers, Nat. Geosci., 12, 7–21, 2019.
Bisselink, B., Bernhard, J., Gelati, E., Adamovic, M., Jacobs, C., Mentaschi, L., Lavalle, C., and De Roo A.: Impact of a changing climate, land use, and water usage on water resources in the Danube river basin, JRC Technical Reports, European Commission, 70 pp., https://doi.org/10.2760/89828, 2018.
Blöschl, G., Hall, J., Parajka, J., Perdigao, R. A. P., Merz, B., Arheimer, B., Aronica, G.-T., Bilibashi, A., Bonacci, O., Borga, M., Čanjevac, I., Castellarin, A., Chirico, G.-B., Claps P., Fiala K., Frolova, N., Gorbachova, L., Gül, A., Hannaford, J., Harrigan, S., Kireeva, M., Kiss, A., Kjeldsen, T., Kohnová, S., Koskela, J.-J., Ledvinka, O., Macdonald, N., Mavrova-Guirguinova, M., Mediero, L., Merz, R., Molnar, P., Montanari, A., Murphy, C., Osuch, M., Ovcharuk, V., Radevski, I., Rogger, M., Salinas, J.-L., Sauquet, E., Šraj, M., Szolgay, J., Viglione, A., Volpi, E., Wilson, D., Zaimi, K., and Živković, N.: Changing climate shifs timing of European foods, Science, 357, 588–590, https://doi.org/10.1126/science.aan2506, 2017
Blöschl, G., Hall, J., Viglione, A., Perdigão, R.-A.-P., Parajka, P., Merz, B., Lun, D., Arheimer, B., Aronica, G.-T., Bilibashi, A., Boháč, M., Bonacci, O., Borga, M., Čanjevac, I., Castellarin, A., Chirico, G.-B., Claps, P., Frolova, N., Gorbachova, L., Gül, A., Hannaford, J., Harrigan, S., Kireeva, M., Kiss, A., Kjeldsen, T., Kohnová, S., Koskela, J.-J., Ledvinka, O., Macdonald, N., Mavrova-Guirguinova, M., Mediero, L., Merz, R., Molnar, P., Montanari, A., Murphy, C., Osuch, M., Ovcharuk, V., Radevski, I., Rogger, M., Salinas, J.-L., Sauquet, E., Šraj, M., Szolgay, J., Volpi, E., Wilson, D., Zaimi, K., and Živković, N.: Changing climate both increases and decreases European river floods, Nature, 573, 108–111, https://doi.org/10.1038/s41586-019-1495-6, 2019.
Bormann, H.: Runoff regime changes in German rivers due to climate change, Erdkunde, 64–63, 257–279, 2010.
Bolbot, H. and Grebin, V.: Long-term dynamics and current trends in fluctuations of the flow characteristics of the Siverskyi Donets river basin, in: Proceeding of Conference “Monitoring of Geological Processes and Ecological Condition of the Environment”, 12–15 November 2019, Kyiv, Ukraine, 5–6, 2019.
CRED (Centre for Research on the Epidemiology of Disasters): Natural Disasters 2018, available at: https://www.emdat.be/publications (last access: 25 April 2020), 2019.
EEA: Economic losses from climate-related extremes in Europe, available at: https://www.eea.europa.eu/downloads/efb8ac2f19e7464db01757ef0627e6a2/1554216645/assessment-2.pdf (last access: 25 April 2020), 2019.
Gopchenko, E. D. and Ovcharuk, V. A.: Theoretical ground of normative base for calculation of the characteristics of the maximal runoff and its practical realization. Transboundary Floods: Reducing Risks through Flood Management, NATO Science Series, IV Earth and Environmental Sciences, Vol. 72, Lightning Source UK Ltd., United Kingdom, 91–99, 2006.
Kan, G., He, X., Ding, L., Li, J., Liang, K., and Hong, Y. Study on Applicability of Conceptual Hydrological Models for Flood Forecasting in Humid, Semi-Humid Semi-Arid and Arid Basins in China, Water, 9, 719, https://doi.org/10.3390/w9100719, 2017.
Kouidri, S., Megnounif, A., and Ghenim, A. N.: Long-term seasonal characterization and evolution of extreme drought and flooding variability in northwest Algeria, Meteorology, Hydrology and Water Management, 7-2, 63–71, 2019.
Li, H.-J., Xue, L.-J., and Wang, X.-J.: Relationship between solar activity and flood/drought disasters of the Second Songhua river basin, J. Water Clim. Change, 6, 578, https://doi.org/10.2166/wcc.2014.053, 2015
Lobanova, A., Liersch S., Nunes, J. P., Didovets, I., Stagl, J., Huang, S., Koch, H., Rivas López, M. del R., Maule, C. F., Hattermann, F., and Krysanova, V.: Hydrological impacts of moderate and high-end climate change across European river basins, Journal of Hydrology: Regional Studies, 18, 15–30, https://doi.org/10.1016/j.ejrh.2018.05.003, 2018.
Loboda, N. S., Kuza, A. M., and Kozlov, O. M.: Assessment of possible changes of water resources of the rivers belonging to the Kuyalnytskyi Liman catchment at the beginning of the 21st century (2021–2050) according to the models of the climatic scenario RCP4.5, Ukrainian Hydrometeorological Journal, 23, 42–53, https://doi.org/10.31481/uhmj.23.2019.05, 2019.
Ovcharuk, V. and Gopchenko, E.: Method of determining characteristics maximal spring flood runoff in Ukraine in view of global and regional climate change, in: Proceedings of 26th IUGG General Assembly, Prague, 22 June–2 July 2015, 38 pp., 2015.
Romanowicz, R.: The Influence Of Climate Change On Hydrological Extremes: Floods & Droughts, Science Trends, https://doi.org/10.31988/SciTrends.3899, 2017.
Sajikumar, N. and Thandaveswara, B.: A nonlinear rainfall runoff model using an artificial neural network, J. Hydrol., 216, 32–35, 1999.
Semenova, I., Ovcharuk, V., and Shakhirzanova, J.: On use of drought indexes in modeling hydrological processes, in: Conference Proceedings SGEM 2014. Geoconference on Water Resources: Hydrology and Water Resources, 17–26 June 2014, Albena, 1, 503–510, https://doi.org/10.5593/SGEM2014/B31/S12.065, 2014.
Singh, V. P.: Hydrologic Systems. Rainfall-Runoff Modeling, Vol. I, Englewood Cliffs, Prentice Hall, 480 pp., 1988.
Stagl, J. C. and Hattermann, F. F.: Impacts of climate change on the hydrological regime of the Danube River and its tributaries using an ensemble of climate scenarios, Water, 7, 6139–6172, 2015.
Tokar, A. S. and Markus, M.: Precipitation runoff modelling using artificial neural networks and conceptual models, J. Hydrol. Eng., ASCE, 5, 156–161, 2000.
Vicente-Serrano, S. M., Beguería, S., and López-Moreno, J. I.: A multiscalar drought index sensitive to global warming: the standardized precipitation evapotranspiration index, J. Climate, 23, 1696–1718, 2010.
Zabolotnia, T., Gorbachova, L., and Khrystiuk, B.: Estimation of the long-term cyclical fluctuations of snow-rain floods in the Danube basin within Ukraine, Meteorology Hydrology and Water Management, 7, 1–12, 2019.
Zhao, R., Yilin, Z., and Lerun, F.: The Xinanjiang model, J. Proc. Oxf. Symp. Hydrol. Forecast, IAHS Publ., 135, 371–381, 1980.
climate changesdirectly through the maximal stocks of snow and precipitation during the spring flood and runoff coefficients.