the Creative Commons Attribution 4.0 License.
the Creative Commons Attribution 4.0 License.
 | 22 Apr 2020
Wavelet analysis of land subsidence time-series: Madrid Tertiary aquifer case study
José Luis Pastor
Marta Béjar-Pizarro
Roberta Bonì
Pablo Ezquerro
José Antonio Fernández-Merodo
Carolina Guardiola-Albert
Gerardo Herrera
Claudia Meisina
Pietro Teatini
Francesco Zucca
Claudia Zoccarato
Andrea Franceschini
Interpretation of land subsidence time-series to understand the evolution of the phenomenon and the existing relationships between triggers and measured displacements is a great challenge. Continuous wavelet transform (CWT) is a powerful signal processing method mainly suitable for the analysis of individual nonstationary time-series. CWT expands time-series into the time-frequency space allowing identification of localized nonstationary periodicities. Complementarily, Cross Wavelet Transform (XWT) and Wavelet Coherence (WTC) methods allow the comparison of two time-series that may be expected to be related in order to identify regions in the time-frequency domain that exhibit large common cross-power and wavelet coherence, respectively, and therefore are evocative of causality. In this work we use CWT, XWT and WTC to analyze piezometric and InSAR (interferometric synthetic aperture radar) time-series from the Tertiary aquifer of Madrid (Spain) to illustrate their capabilities for interpreting land subsidence and piezometric time-series information.
- Article
(9105 KB) - Full-text XML
- BibTeX
- EndNote


The study of the existing relationships between ground displacements associated with land subsidence caused by aquifer-system compaction and the principal driving factor, groundwater levels, is a key aspect to understand the mechanisms driving this type of land subsidence. These relationships are usually studied using the analysis of time series of displacements and water levels.
These time series typically present marked periodicities related to seasonal and interannual variations in groundwater extraction that can be characterized qualitatively or quantitatively by evaluating direct correlations between groundwater levels and ground displacements. Quantitative analysis typically entails evaluating correlations in the frequency domain, assuming that the underlying processes are stationary, i.e. the mean, variance and autocorrelation structure do not change over time (Grinsted et al., 2004). In these cases, the analysis of the Fourier-transformed time series allows the identification of the dominant frequencies for a specified frequency bandwidth, which tends to ignore localized temporal information. Fourier analysis does not identify when the frequencies develop or whether they are constant in time. Continuous Wavelet Transform (CWT) is an alternative method that enables the analysis of time series in the time-frequency domain allowing the identification of intermittent periodicities (Grinsted et al., 2004). Furthermore, when two time series are analysed (e.g. ground displacements and groundwater levels) the Cross Wavelet Transform (XWT) and Wavelet Transform Coherence (WTC) techniques permit the identification of the common cross-wavelet power and wavelet coherence, respectively, and the relative phase or phase shift in the time-frequency domain, respectively, as well as the evaluation of the significant coherence between both signals and the red-noise based confidence levels (Torrence and Compo, 1998). Therefore, these methods are of great importance to explore periodicities in land subsidence and to identify their time delays in relation to variations in groundwater level.
In this work, wavelet methods are briefly introduced and some synthetic cases and an actual case focusing on paired time series of ground displacements and water levels for two wells in the Tertiary aquifer of Madrid (Spain) are presented to illustrate their usefulness to land subsidence studies.
CWT is of great interest for the analysis of individual time series. This analytic method is an alternative to the classical Fourier analysis, presenting some notable benefits. The CWT method expands a time series into an image of spectral power in the time-frequency domain where the wavelet power is a function time (or date), and the period (or frequency) of the time series. Therefore, the wavelet power computed from the CWT can be used to identify dates and corresponding periodicities exhibiting high wavelet power that indicate the presence of significant periodicities, enabling their identification in a highly intuitive way. It should be noted that in this work the Morlet wavelet has been used since it is a good choice for feature extraction purposes (Grinsted et al., 2004).
The relationship between two different time series can be analysed using the XWT and WTC methods. The XWT is calculated by multiplying the CWT of a time series by the complex conjugate of the CWT of the second time series. The XWT computed from two CWTs exposes regions with high common cross-wavelet power (Grinsted et al., 2004). Additionally, the phase of XWT (representing the phase shift between the two time series and corresponding to the angle Δφ in radians) indicates the temporal delay or time shift (Δt) between both time series that can be calculated as:
where T is the periodicity or wave period of interest.
WTC is defined as the coherence (dimensionless) between two CWTs measured in the time-frequency (or time-period) domain. It is calculated using the normalized cross correlation. The WTC wavelet coherence values will be high (close to 1) in those regions of the time-frequency domain with similar wavelet coherence in both CWTs.
In this work, the described wavelet methods are applied to six synthetic cases as well as to paired ground-displacement and water-level time series recorded from 19 wells in the Tertiary detritic aquifer of Madrid (TDAM) to illustrate the capabilities of the proposed approach to investigate seasonal land subsidence and piezometric time-series information.

Figure 1Synthetic time series of groundwater level and their respective CWT power spectra: (a) one-year (T0) period sine function; (b) half-year (T1) period sine function; (c) function resulting from the sum of functions (a) and b); (d) damped T0 period sine function; (e) variable (T0, T1 and T2) period sine function; (f) linearly variable period (from T0 to T2) sine function (linear chirp function). The colour bar represents the wavelet power of time series that ranges from blue (low) to red (high). The 5 % significance level against red noise is shown by the black contour.
3.1 Synthetic cases
Figure 1 shows the CWT power spectra of six different synthetic seasonal patterns. The first and the second time series (Fig. 1a and b) correspond to sine functions with different frequencies. The CWT power spectrum shows strong wavelet powers for the whole analyzed time period for the periods T0 (1 year) and T1 (about one-half a year). The time series shown in Fig. 1c corresponds to the sum of the previous functions. The CWT power spectrum of the time series allows the identification of both time periods (T0 and T1). Figure 1d shows a time series of a damped sine function with a period T0, whose amplitude approaches zero as time increases. The CWT power spectrum analysis shows the highest wavelet powers for specific dates corresponding to the period of the time series (T0). Figure 1e shows a time series with a T0 period during the first one year and a half, a T1 period during the next year and T2 (about 90 d) period during the last year. The wavelet powers computed from the CWT of this time series enables the identification of the three different periods as well as their time spans. The last analyzed synthetic time series is a sine function with a linearly variable period from T0 to T2 (Fig. 1f). The wavelet powers computed from the CWT clearly show the linear variability of the period with time.
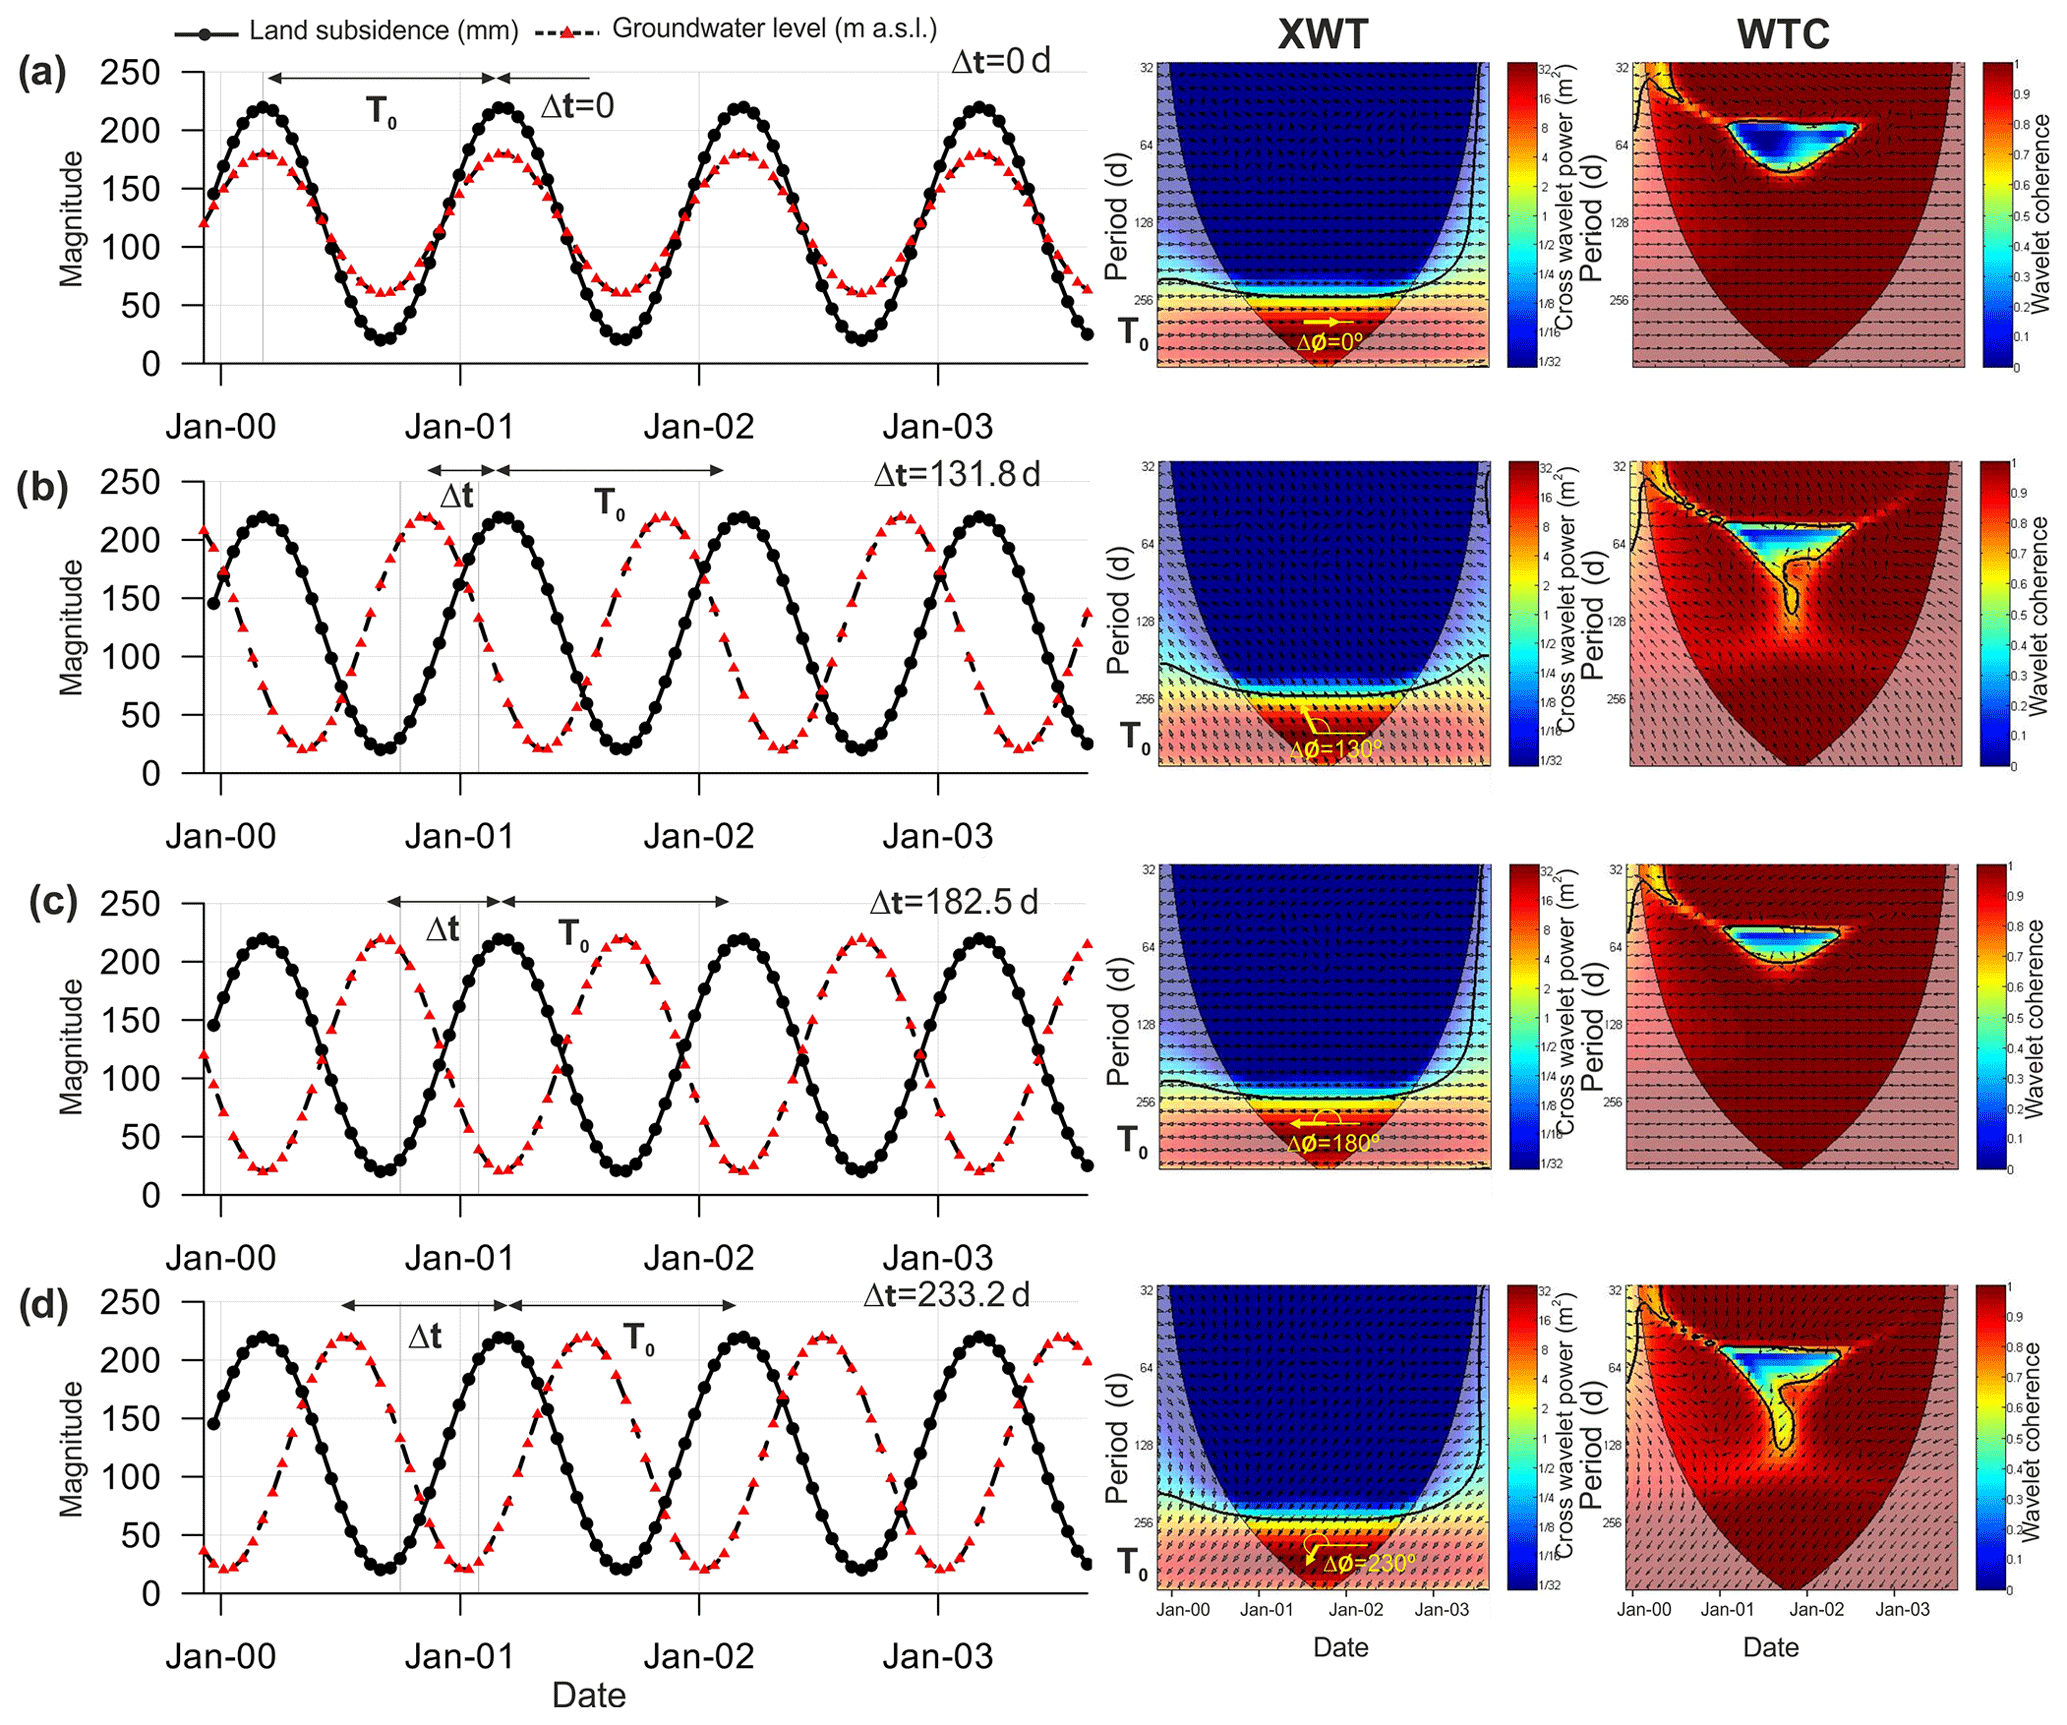
Figure 2XWT cross-wavelet power spectra and WTC coherence of two synthetic groundwater level and land subsidence time series computed using one-year (T0) period sine functions with different phases: (a) in phase (); (b) phase shift and corresponding time lag Δt=131.8 d; (c) antiphase () and corresponding time lag Δt=182.5 d; and (d) phase shift and corresponding time lag Δt=233.2 d. The colour bar of XWT represents the common cross-wavelet power of both time series that ranges from blue (low) to red (high). Coherency ranges from blue (low) to red (high). The 5 % significance level against red noise is shown by the black contour.
Figure 2 shows the results of the XWT power spectra and WTC coherence of different synthetic groundwater level stationary sine time series. The first couple of time series (Fig. 2a) have the same period (T0) but different amplitudes. The XWT power spectrum and WTC coherence show a high common cross-wavelet power (red area) and wavelet coherence for the T0=1 year period. Additionally, the arrows show a 0∘ phase (i.e. the arrows point towards the right, ΔØ=0 rad), which according to Eq. (1) means that both time series are in phase (i.e. Δt=0 d). Figures 2b and d show two 1 year period sine time series shifted by 130∘. The respective XWT power spectra and WTC show a high wavelet coherence for the T0=1 year period and phase angles of 130∘ (ΔØ=2.27 rad) and 230∘ (ΔØ=4.01 rad) that corresponds to delays (Δt) between both time series of 131.8 and 233.2 d, respectively. Finally, the Fig. 2c shows time series for two sine functions with the same amplitude and 1 year period but with opposite phase. The XWT cross-power spectrum and WTC coherence enable the identification of strong common cross-wavelet power and wavelet coherence for T0=1 year period for the entire time span of the time series. For this period, the measured phase is 180∘ (i.e. the arrows are antiphase, ΔØ=π rad) and thus the time delay between the time series is 182.5 d (half a year).

Figure 3CWT power spectra of InSAR displacements and piezometric data shown with water-level time series for two wells (a) FC-2 and (b) CA-5 in the TDAM. Colour scale is described in Fig. 1 (caption).
3.2 Real case study
The TDAM is a heterogeneous and anisotropic aquifer system with accumulated sediment thickness of more than 3000 m and a multilayer structure formed by a series of sand lenses on the order of a few meters thick, embedded in a low-permeability clay matrix (Hernández-García and Custodio, 2004; Yélamos and Villarroya, 2007). The wavelet analyses have been carried out using ground-displacement time series derived from interferometric synthetic aperture radar (InSAR) and piezometric time series of 19 wells from the Manzanares-Jarama wellfield covering the time span 2003-2010. The methodology proposed by Tomás et al. (2016) for using wavelet methods to analyse seasonal variations from InSAR time-series data is used. This area was affected by a seasonal land subsidence previously studied by Ezquerro et al. (2014) and Béjar-Pizarro et al. (2017). The wavelet analyses for two representative wells, FC-2 and CA-5, over the time interval spanned by the imaging radar coverage of the ENVISAT satellite from which the synthetic aperture radar (SAR) data were acquired, are depicted in Figs. 3 and 4. Thirty-one ENVISAT ascending satellite SLC SAR images acquired between August 2003 and September 2010 were processed with the PSP-IFSAR technique (Costantini et al., 2008) to calculate the radar line-of-sight (LOS) displacement time series of each persistent scatterer (PS). The CWT power spectra (Fig. 3) of the InSAR-derived ground displacement (land subsidence) and piezometric-level time series, show two regions of relatively higher wavelet power, one at a period of 1 year, corresponding to the time interval 2004–2007, and another at a period of 2 years, corresponding to the time interval 2004–2008. These regions of high wavelet power correspond to the more than 100 m decline in water level that occurred in both wells during the period 2005–2007. Similar regions of higher wavelet power at periods of 1 and 2 years are recognized for the other 17 paired time series related to the other wells analysed.
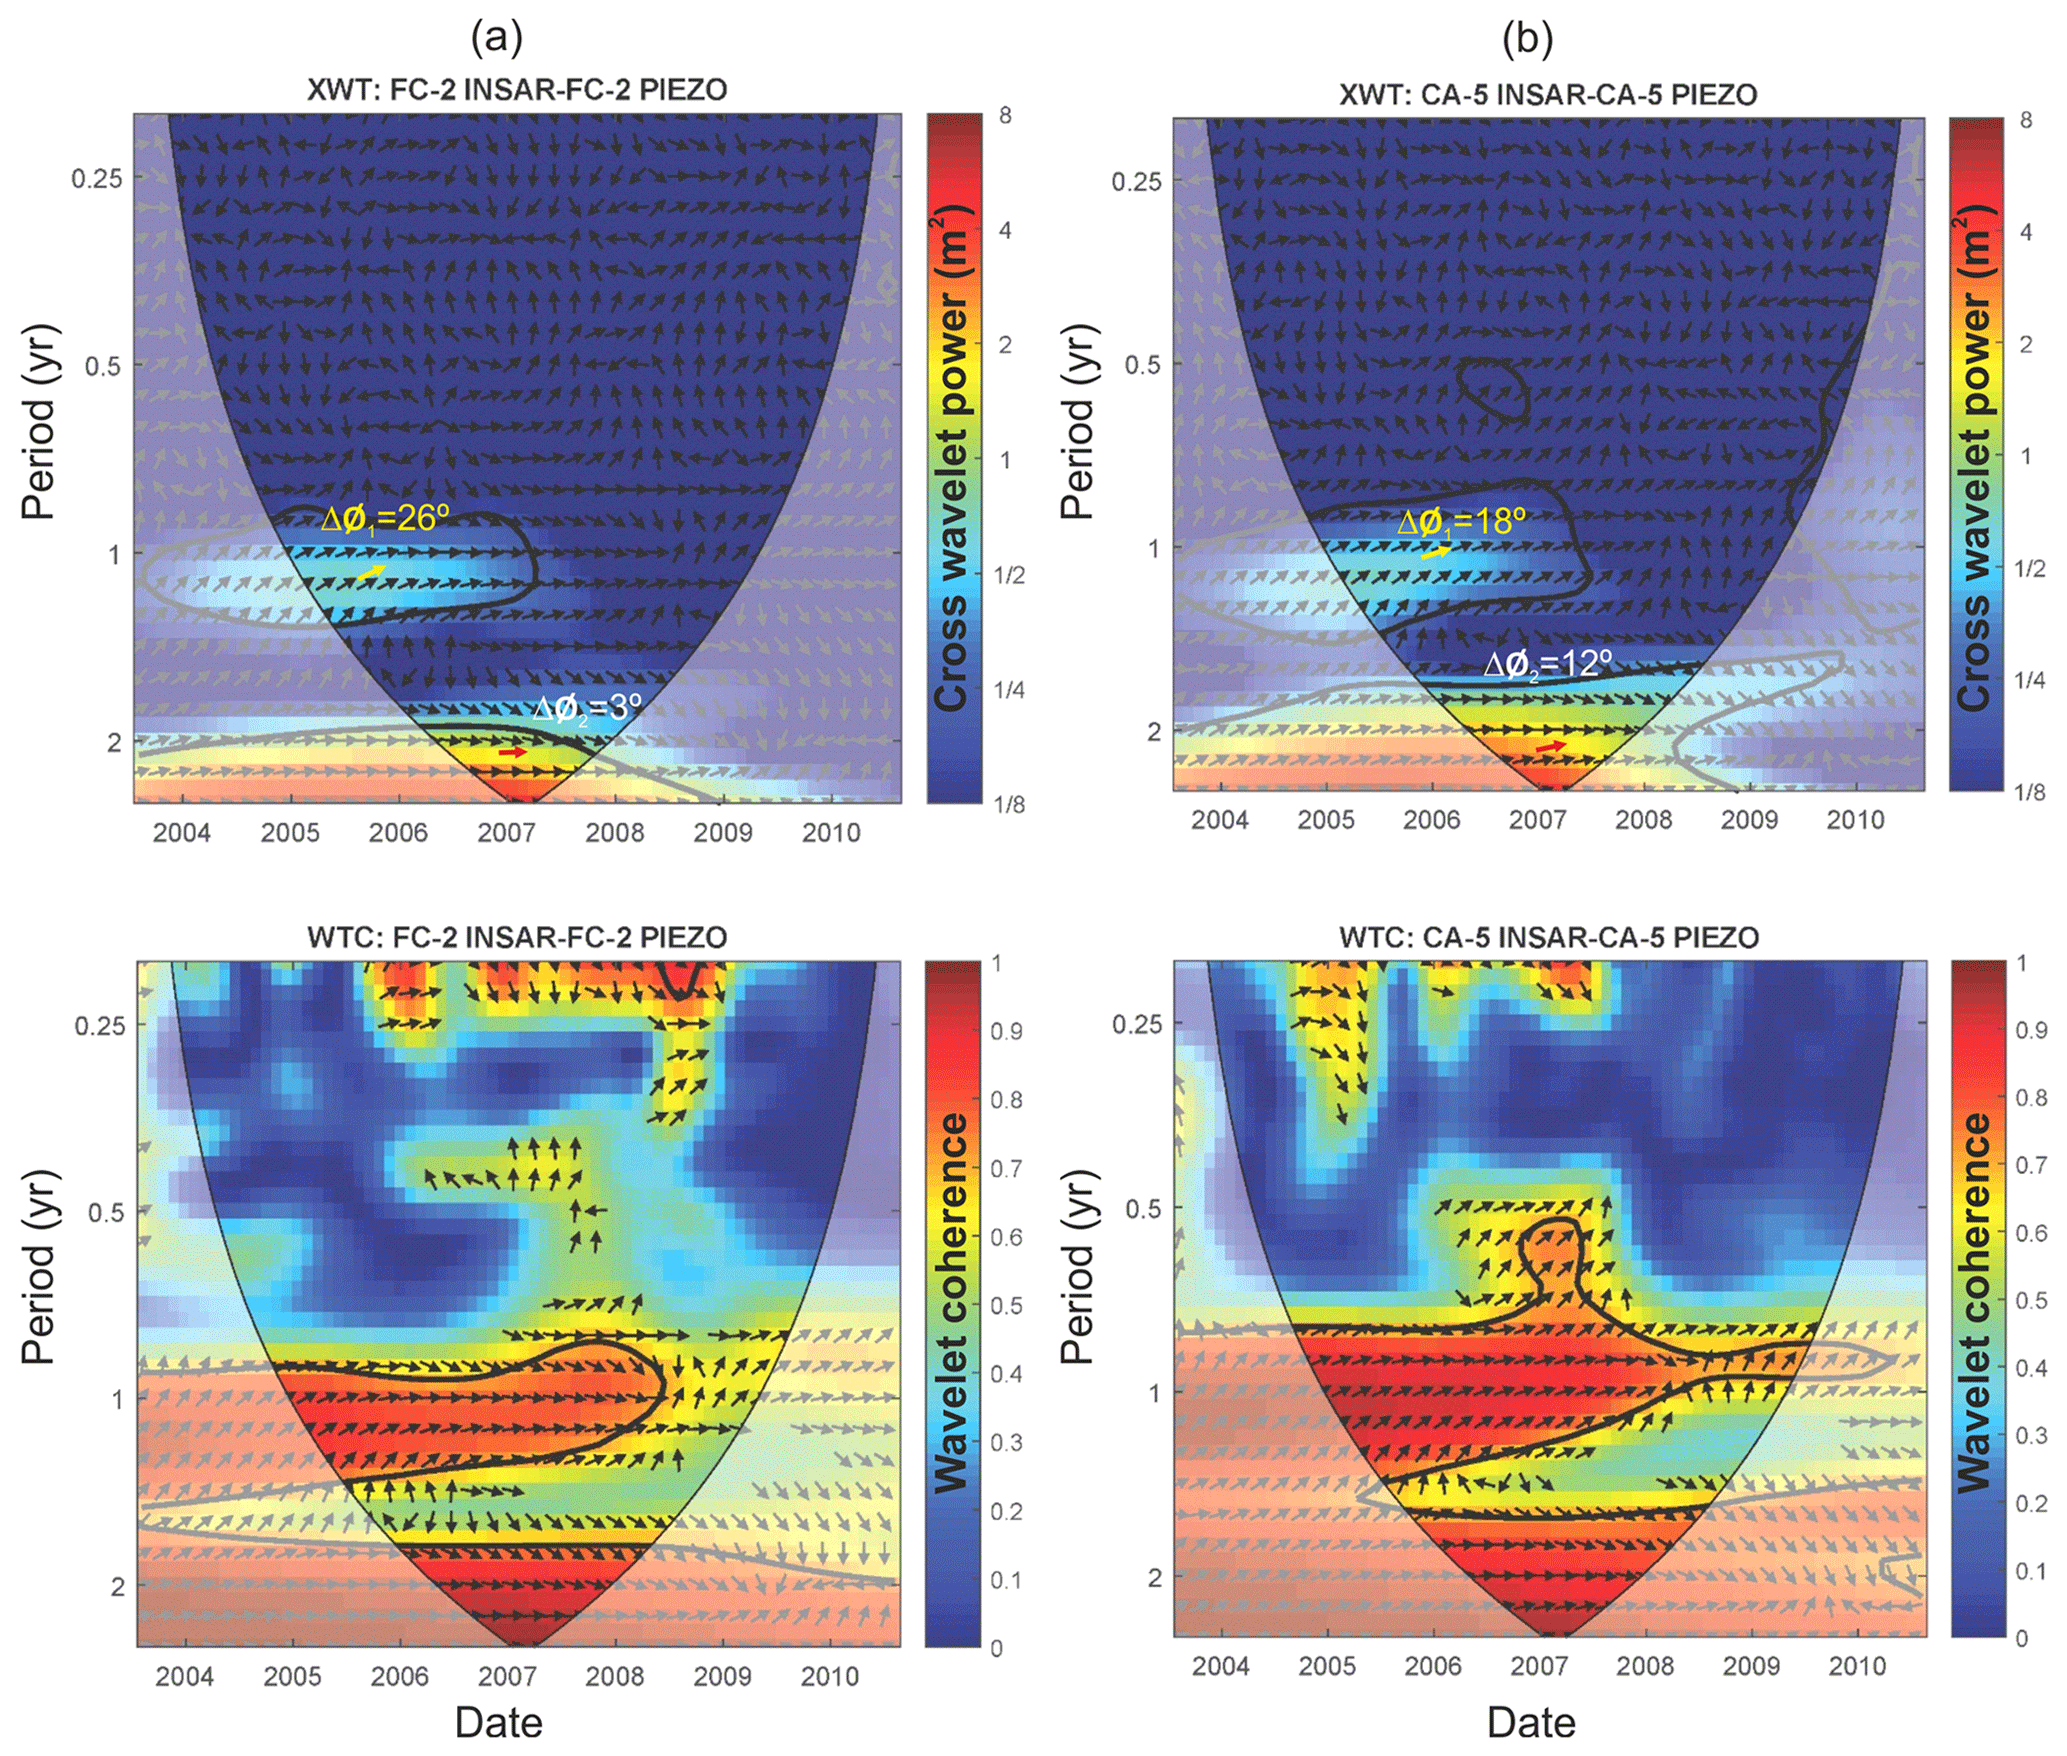
Figure 4XWT cross-wavelet power spectra and WTC wavelet coherence of InSAR displacements and piezometric data time series from two wells (a) FC-2 and (b) CA-5 in the TDAM. Colour scale is described in Fig. 2 (caption).
Figure 4 shows the XWT cross-power spectra and WTC for the InSAR-derived displacement and water-level time series at wells FC-2 and CA-5. Regions of high cross-wavelet spectral power and high coherence are evident at periods of 1 and 2 years. The phase shifts at periods of 1 and 2 years indicate time lags of 1.0 and 0.2 months for FC-2 and 0.6 and 0.8 months for CA-5, respectively, between land subsidence and the forcing groundwater-level declines. The time-lag results obtained for all wells have a mean ±σ (standard deviation) of 0.9±0.8 and 1.3±0.8 months for the 1 and 2 year periods, respectively. Delays between ground displacements caused by aquifer-system compaction and groundwater levels in heterogeneous aquifer systems comprising layered assemblages of unconsolidated, permeable coarse-grained (sands and gravels) and low-permeability fine-grained (silts and clays) deposits that respectively constitute the aquifers and aquitards in the aquifer system, have been attributed to delayed fluid-pressure equilibration between the aquifers and aquitards (Galloway, 1999). In some systems with thick aquitards these delays can be on the order of years to decades or more. Consequently, the delays (Δt) of about one month observed between piezometric levels measured as water levels in the wells and ground displacements suggest that low-permeability clayey units have a limited influence in delaying the compaction of the aquifer system at periods of 1 and 2 years. Furthermore, subsidence and uplift displacements associated with the 2 year episode of drawdown and recovery, respectively, were proportional to the water-level changes. For example, for FC-2, the water level changed −120.5 m with a corresponding settlement of −65.3 mm, then when the water-level recovered +116.6 m, the corresponding displacement changed +60.1 mm to a displacement value on Fig. 3a of about −10.3 mm. The ratios of the change in displacement to the change in water level for the drawdown portion (i.e. 0.54 mm m−1) are similar to the ratios for the water-level recovery portion (i.e. 0.52mm m−1), suggesting a fully recoverable or elastic response of aquifer-system deformation to the groundwater level changes.
These examples confirm the capabilities of the wavelet method to recognize the oscillations of a time series in an intuitive way (Grinsted et al., 2004) and for testing proposed linkages between two time series (Tomás et al., 2016). This information can be used by researchers for stating causal relationships between land subsidence and its driving factors.
In this work, a time-frequency wavelet analysis (CWT, XWT and WTC) of a few synthetic time series and 19 paired time series of ground displacements measured using InSAR and the associated driving factor, water levels measured in wells for an actual case study in the TDAM has been successfully applied. On the one hand, CWT has proven its ability to expand individual time-series records into time-frequency space to identify localized intermittent periodicities. In the actual case study, periods of 1 and 2 years have been identified for the available land subsidence and piezometric time series. Therefore, two overlapped signals have been recognized in the TDAM during the period analysed, 2003–2010. The first signal corresponds to a two-year drought period. It is a longer period during which groundwater resources were extracted from wells due to the lack of rainfall. The second signal corresponds to one-year seasonal period (winter-summer cycles) typical of the expected seasonal variations in natural recharge and discharge and groundwater extraction under normal climatic conditions. On the other hand, XWT and WTC revealed physical relationships between the two signals (i.e. piezometric level and land subsidence time series). The means and standard deviations of the observed time lags, that strongly depend on the permeability of the different lithologies existing in each well, are similar for both identified periods (0.9±0.8 and 1.3±0.8 months for 1 and 2 years periods, respectively). Because the time lags are relatively short we infer that the low-permeability silt and clay units in the aquifer system have little influence on the subsidence record for the period of study. Further, because the relation between the ratios of changes in ground displacements and changes in water levels were similar for the drawdown and recovery portions of the water-level record we can assume a purely elastic behaviour of the aquifer.
The information derived from wavelet methods can be exploited by researchers for identifying and quantifying causal relationships between water-level and ground displacement time series and improving numerical models on land subsidence. However, we have to take into account that wavelet methods do not provide direct information about the underlying physical mechanism causing land subsidence and therefore additional hydrogeologic information and analysis are required to more fully explain the mechanisms that underlie the relationships inferred from time-series analysis of land subsidence and its driving factors.
The SAR Interferometry and groundwater level time series are available upon request by contacting the correspondence author.
RT and JL designed and performed the analysis. MB, RB, PE y GH provided the time series. RT y JL wrote the draft version of the manuscript. All authors analysed the results and revised the manuscript.
The authors declare that they have no conflict of interest.
This article is part of the special issue “TISOLS: the Tenth International Symposium On Land Subsidence – living with subsidence”. It is a result of the Tenth International Symposium on Land Subsidence, Delft, the Netherlands, 17–21 May 2021.
The authors acknowledge Aslak Grinsted, John Moore and Svetlana Jevrejeva for providing the MATLAB-based software package for the calculation of the CWT, XWT and WTC. We also thank Devin L. Galloway for the thorough revision of the manuscript and their valuable comments.
This research has been supported by the Spanish Ministry of Economy and Competitiveness, the State Agency of Research and the European Funds for Regional Development (grant no. TEC2017-85244-C2-1-P)
Ezquerro, P., Herrera, G., Marchamalo, M., Tomás, R., Béjar-Pizarro, M., and Martínez, R.: A quasi-elastic aquifer deformational behavior: Madrid aquifer case study, J. Hydrol., 519, 1192–1204, https://doi.org/10.1016/j.jhydrol.2014.08.040, 2014.
Béjar-Pizarro, M., Ezquerro, P., Herrera, G., Tomás, R., Guardiola-Albert, C., Ruiz Hernández, J. M., Fernández Merodo, J. A., Marchamalo, M., and Martínez, R.: Mapping groundwater level and aquifer storage variations from InSAR measurements in the Madrid aquifer, central Spain, J. Hydrol., 547, 678–689, https://doi.org/10.1016/j.jhydrol.2017.02.011, 2017.
Costantini, M., Falco, S., Malvarosa, F., and Minati, F.: A new method for identification and analysis of persistent scatterers in series of SAR images, Int. Geosci. Remote Sens., 2, 449–452, https://doi.org/10.1109/IGARSS.2008.4779025, 2008.
Galloway, D. L., Jones, D. R., and Ingebritsen, S. E. (Eds.): Land subsidence in the United States: U.S. Geological Survey Circular, available at: http://pubs.usgs.gov/circ/circ1182/ (last access: 1 March 2020), p. 177, 1999.
Grinsted, A., Moore, J. C., and Jevrejeva, S.: Application of the cross wavelet transform and wavelet coherence to geophysical time series, Nonlinear Proc. Geoph., 11, 561–566, https://doi.org/10.5194/npg-11-561-2004, 2004.
Hernández-García, M. E. and Custodio, E.: Natural baseline quality of Madrid Tertiary detrital aquifer groundwater (Spain): A basis for aquifer management, Environ. Geol., 46, 173–188, 2004.
Tomás, R., Li, Z., Lopez-Sanchez, J. M., Liu, P., and Singleton, A.: Using wavelet tools to analyse seasonal variations from InSAR time-series data: A case study of the Huangtupo landslide, Landslides, 13, 437–450, https://doi.org/10.1007/s10346-015-0589-y, 2016.
Torrence, C. and Compo, G. P.: A Practical Guide to Wavelet Analysis, B. Am. Meteorol. Soc., 79, 61–78, https://doi.org/10.1175/1520-0477(1998)079< 0061:APGTWA>2.0.CO;2, 1998.
Yélamos, J. G. and Villarroya Gil, F.: El acuífero terciario detrítico de Madrid: Pasado, posibilidades actuales y retos pendientes, Ens. Cienc. Tierra, 153, 317–324, 2007.