the Creative Commons Attribution 4.0 License.
the Creative Commons Attribution 4.0 License.
 | 22 Apr 2020
Permafrost seasonal surface changes revealed from Sentinel-1 InSAR time-series, Yamal peninsula
Kanayim Teshebaeva
Ko J. van Huissteden
Alexander V. Puzanov
Dmitry N. Balykin
Anton I. Sinitsky
Nelley Kovalevskaya
Widespread thawing of permafrost in the northern Eurasian continent causes severe problems for infrastructure and global climate. We test the potential of Sentinel-1 SAR imagery to enhance detection of permafrost surface changes in the Siberian lowlands of the northern Eurasian continent at the Yamal peninsula site. We used InSAR time-series technique to detect seasonal surface movements related to permafrost active layer changes. The satellite InSAR time-series analysis has detected continuous movements, subsidence in three zones, which have occurred during the time period from 2017 to 2018. Observed subsidence zones show up to 180 mm yr−1 rates of seasonal active layers changes. These seasonal ground displacement patterns align well with lithology and linked to anthropogenic impact on the permafrost surface changes in the area. The results show that Sentinel-1 mission is of great importance for the longer-term monitoring of active layer thickening in permafrost regions. The combined analyses of the obtained InSAR time series with additional field observations may support regular process monitoring as part of a global warming risk assessment.
- Article
(24103 KB) - Full-text XML
- BibTeX
- EndNote


Widespread thawing of permafrost, by present and future climate warming, has potentially huge impacts on natural environments, global climate, and human activities in the Arctic. Ice-rich permafrost thaw readily due to climate change and human activity causing soil subsidence and have a devastating effect on infrastructure (French, 2017; Hjort et al., 2018; Nauta et al., 2015). Despite three decades of intensifying research in Arctic terrestrial and marine environments, these hold still strong surprises for us, shown by the recent discoveries of CH4 seeps in lakes, in the Arctic ocean, and CH4 emitting craters in the permafrost. The feedbacks of permafrost change on climate, such the Arctic carbon feedback and changes in land surface characteristics (soil moisture, lakes and ponds) still require better quantification (Schuur et al., 2015). This is a scientific challenge, which calls for innovative methods to detect and quantify permafrost change over large areas. Some of recent studies used Radar Interferometry to detect and quantify permafrost surface changes (Chen et al., 2013; Liu et al., 2010; X. Liu et al., 2015; Short et al., 2014). We focus on an area of recent, early 2014, discovery of crater on the Yamal Peninsula of the Western Siberia in Russia (Kizyakov et al., 2017; Leibman et al., 2014; Olenchenko et al., 2015). The crater is formed by a powerful release of gas and located in close vicinity of the Bovanenkovo oil-gas field (Leibman et al., 2014). We study the area to quantify feedback of permafrost thaw to climate, and to detect areas where permafrost thaw hazards to human infrastructure are potentially high.
The objective of this study is to detect and quantify permafrost surface changes using InSAR time-series. The combination of InSAR with available geomorphological and geological data and on-site data collection that may be used to develop conceptual and quantitative models that can be used to predict subsidence by permafrost thaw and CH4 emission hotspots on a larger scale.
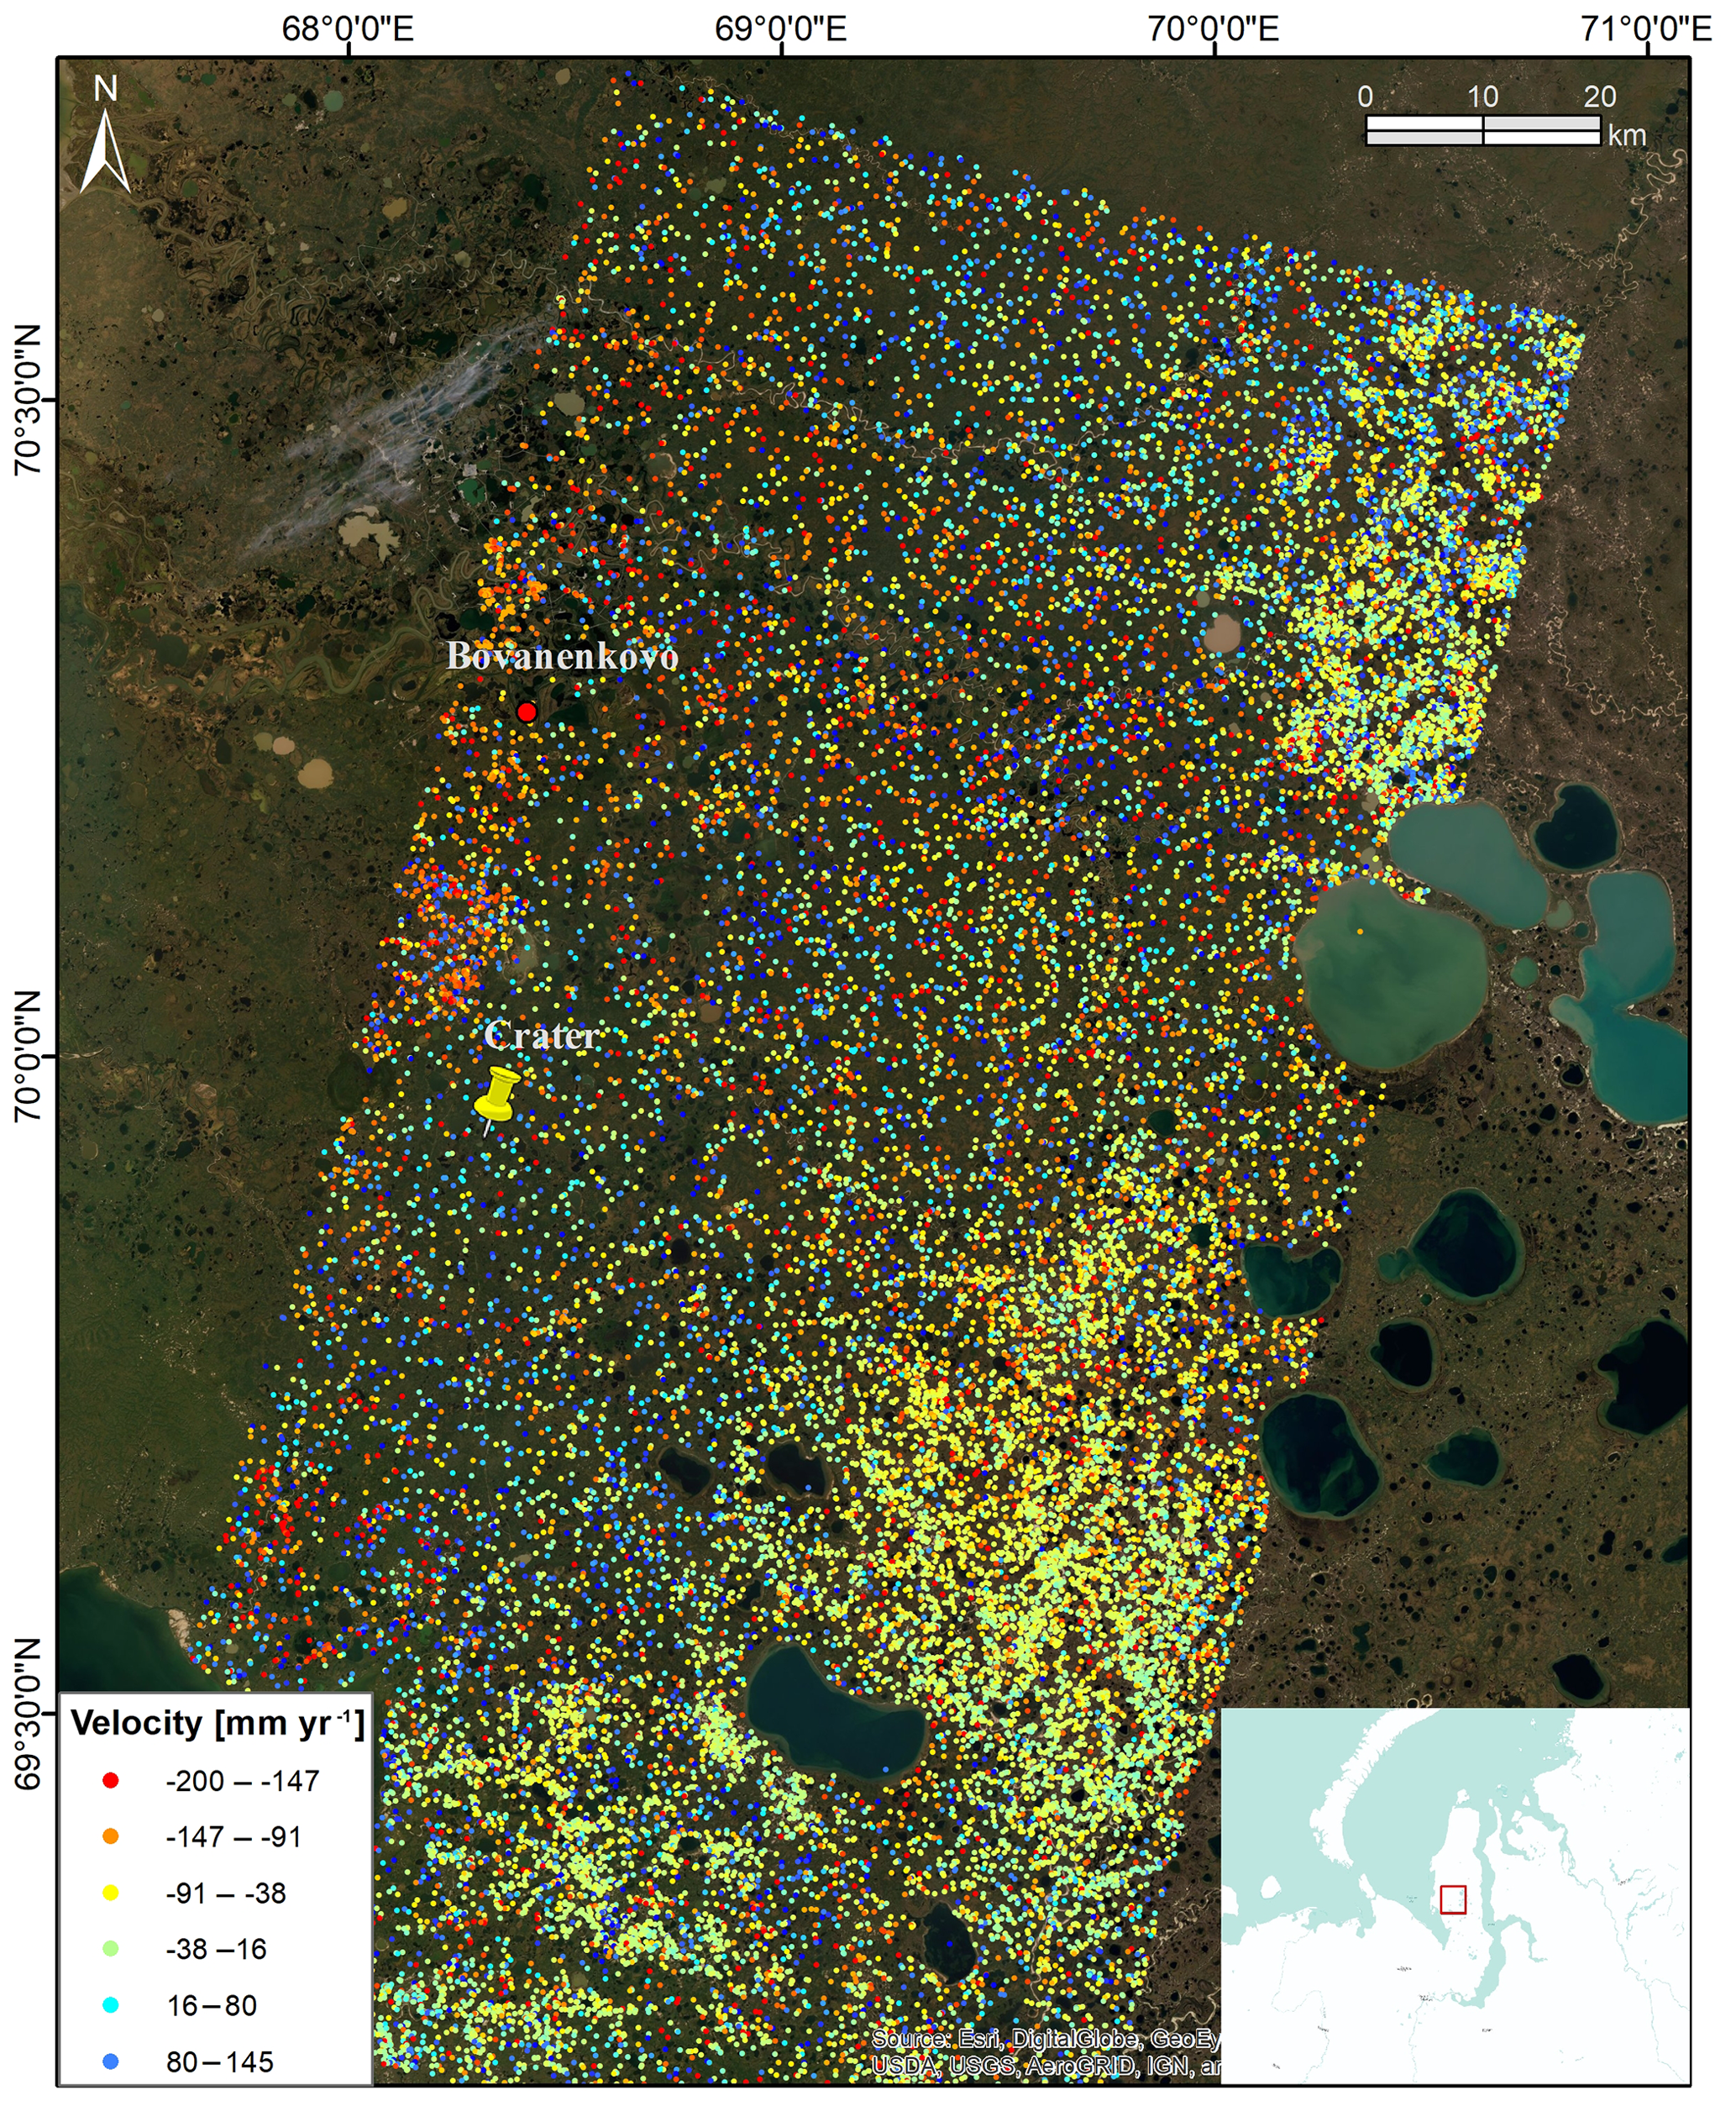
Figure 1Results of PS InSAR analysis, colors show spatial pattern of seasonal subsidence velocity for June–October 2017–2018.
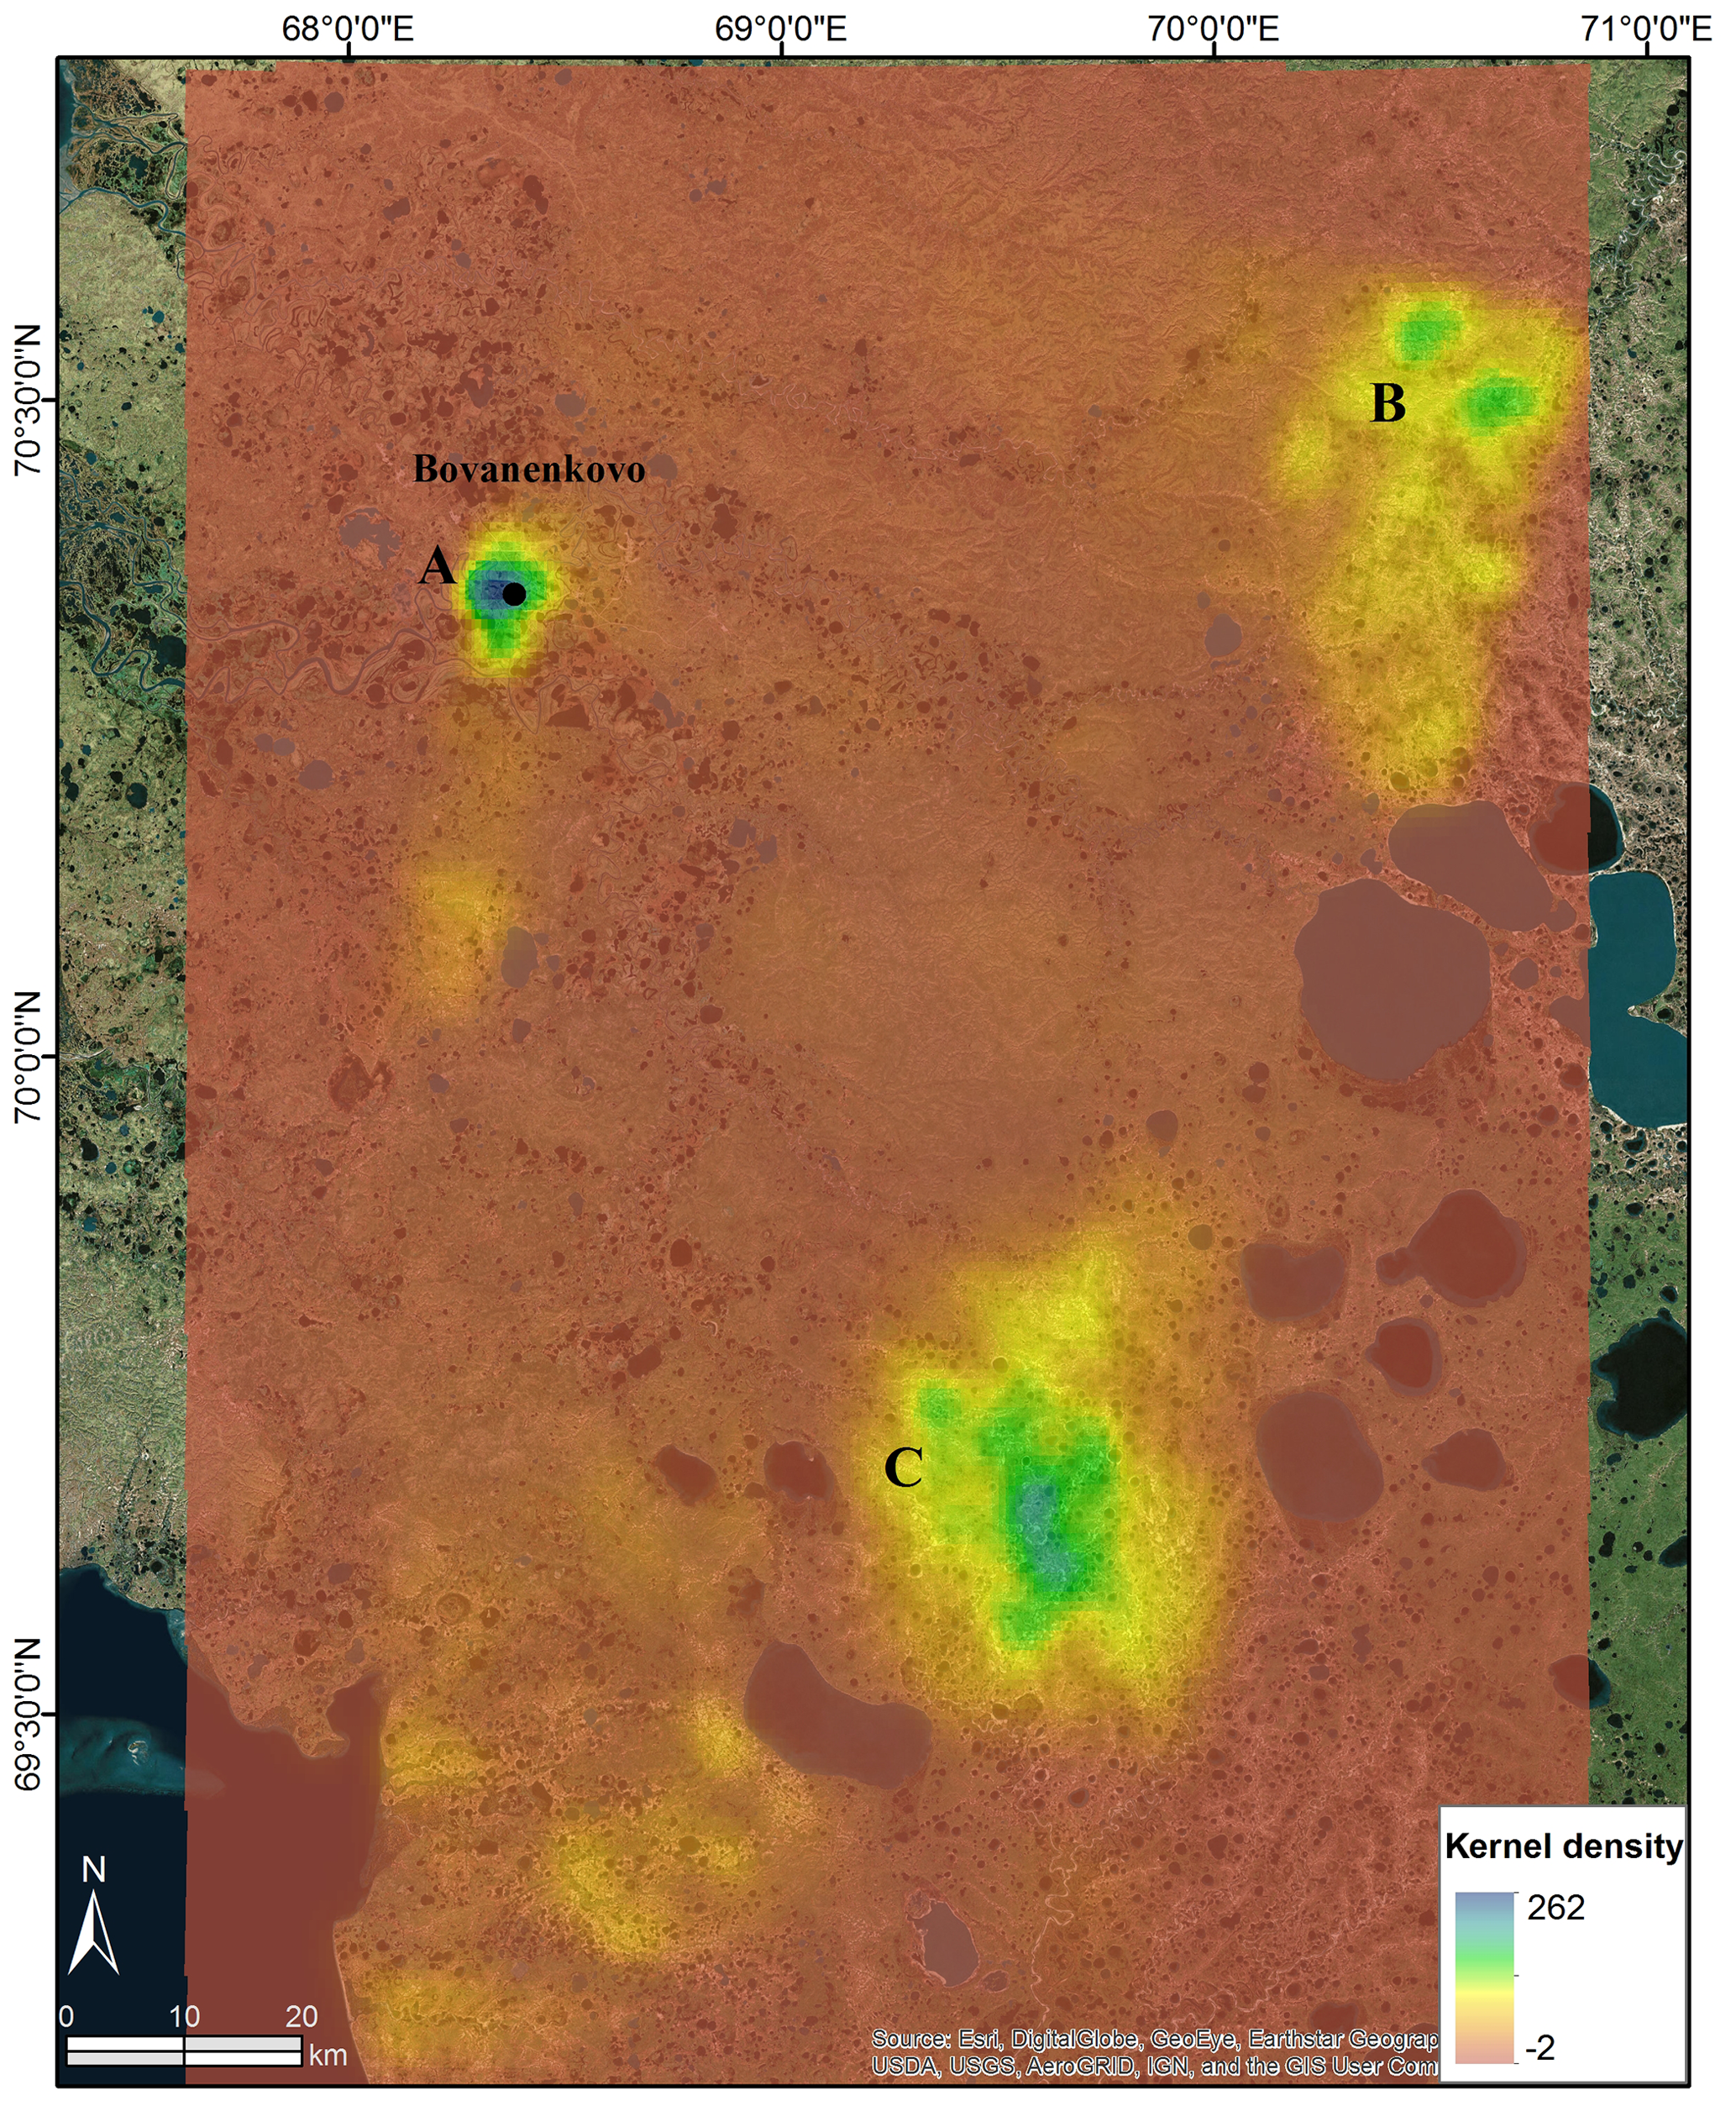
Figure 2Hotspot cluster kernel-density map showing smoothed spatial location of clusters in zones A, B and C. Analysis highlights areas of spatially correlative regions as high kernel-density values in blue. Hotspot analysis was performed on results of PS InSAR analysis (Fig. 1).
The results derived from Sentinel-1 InSAR time-series are mean LOS seasonal velocities for 2017 and 2018. The displacement rates were 60–180 mm yr−1 and found mainly in the vicinity of Bovanenkovo settlement (Fig. 1). We identified spatially clustered areas of high values (hot spots) and their spatial location shows that the study area is characterized by subsidence in three distinguished zones. These subsidence zones are located at the west and east part of the test site and were highlighted as A, B and C zones (Fig. 2).
The zone A is located within area of Bovanenkovo settlement and oil/gas field. It is subsiding with velocity of about to 160 mm yr−1. The zone A is circular in shape with spatial dimension of the zone is about to 12 km length and 8 km width highlighting center of the subsidence (Fig. 2). The zone B is located in the east north with subsiding rates of about to 80 mm yr−1 site. The zone B has a spatial dimension of about 41 km length and 20 km width. The zone C is located just south of the lakes in the study area with spatial dimension of 36 km length and 22 km width (Fig. 2). The zone C is subsiding with velocity of about to 90 mm yr−1. The subsiding rates of the zone A is double higher than zones B and C (Fig. 2).
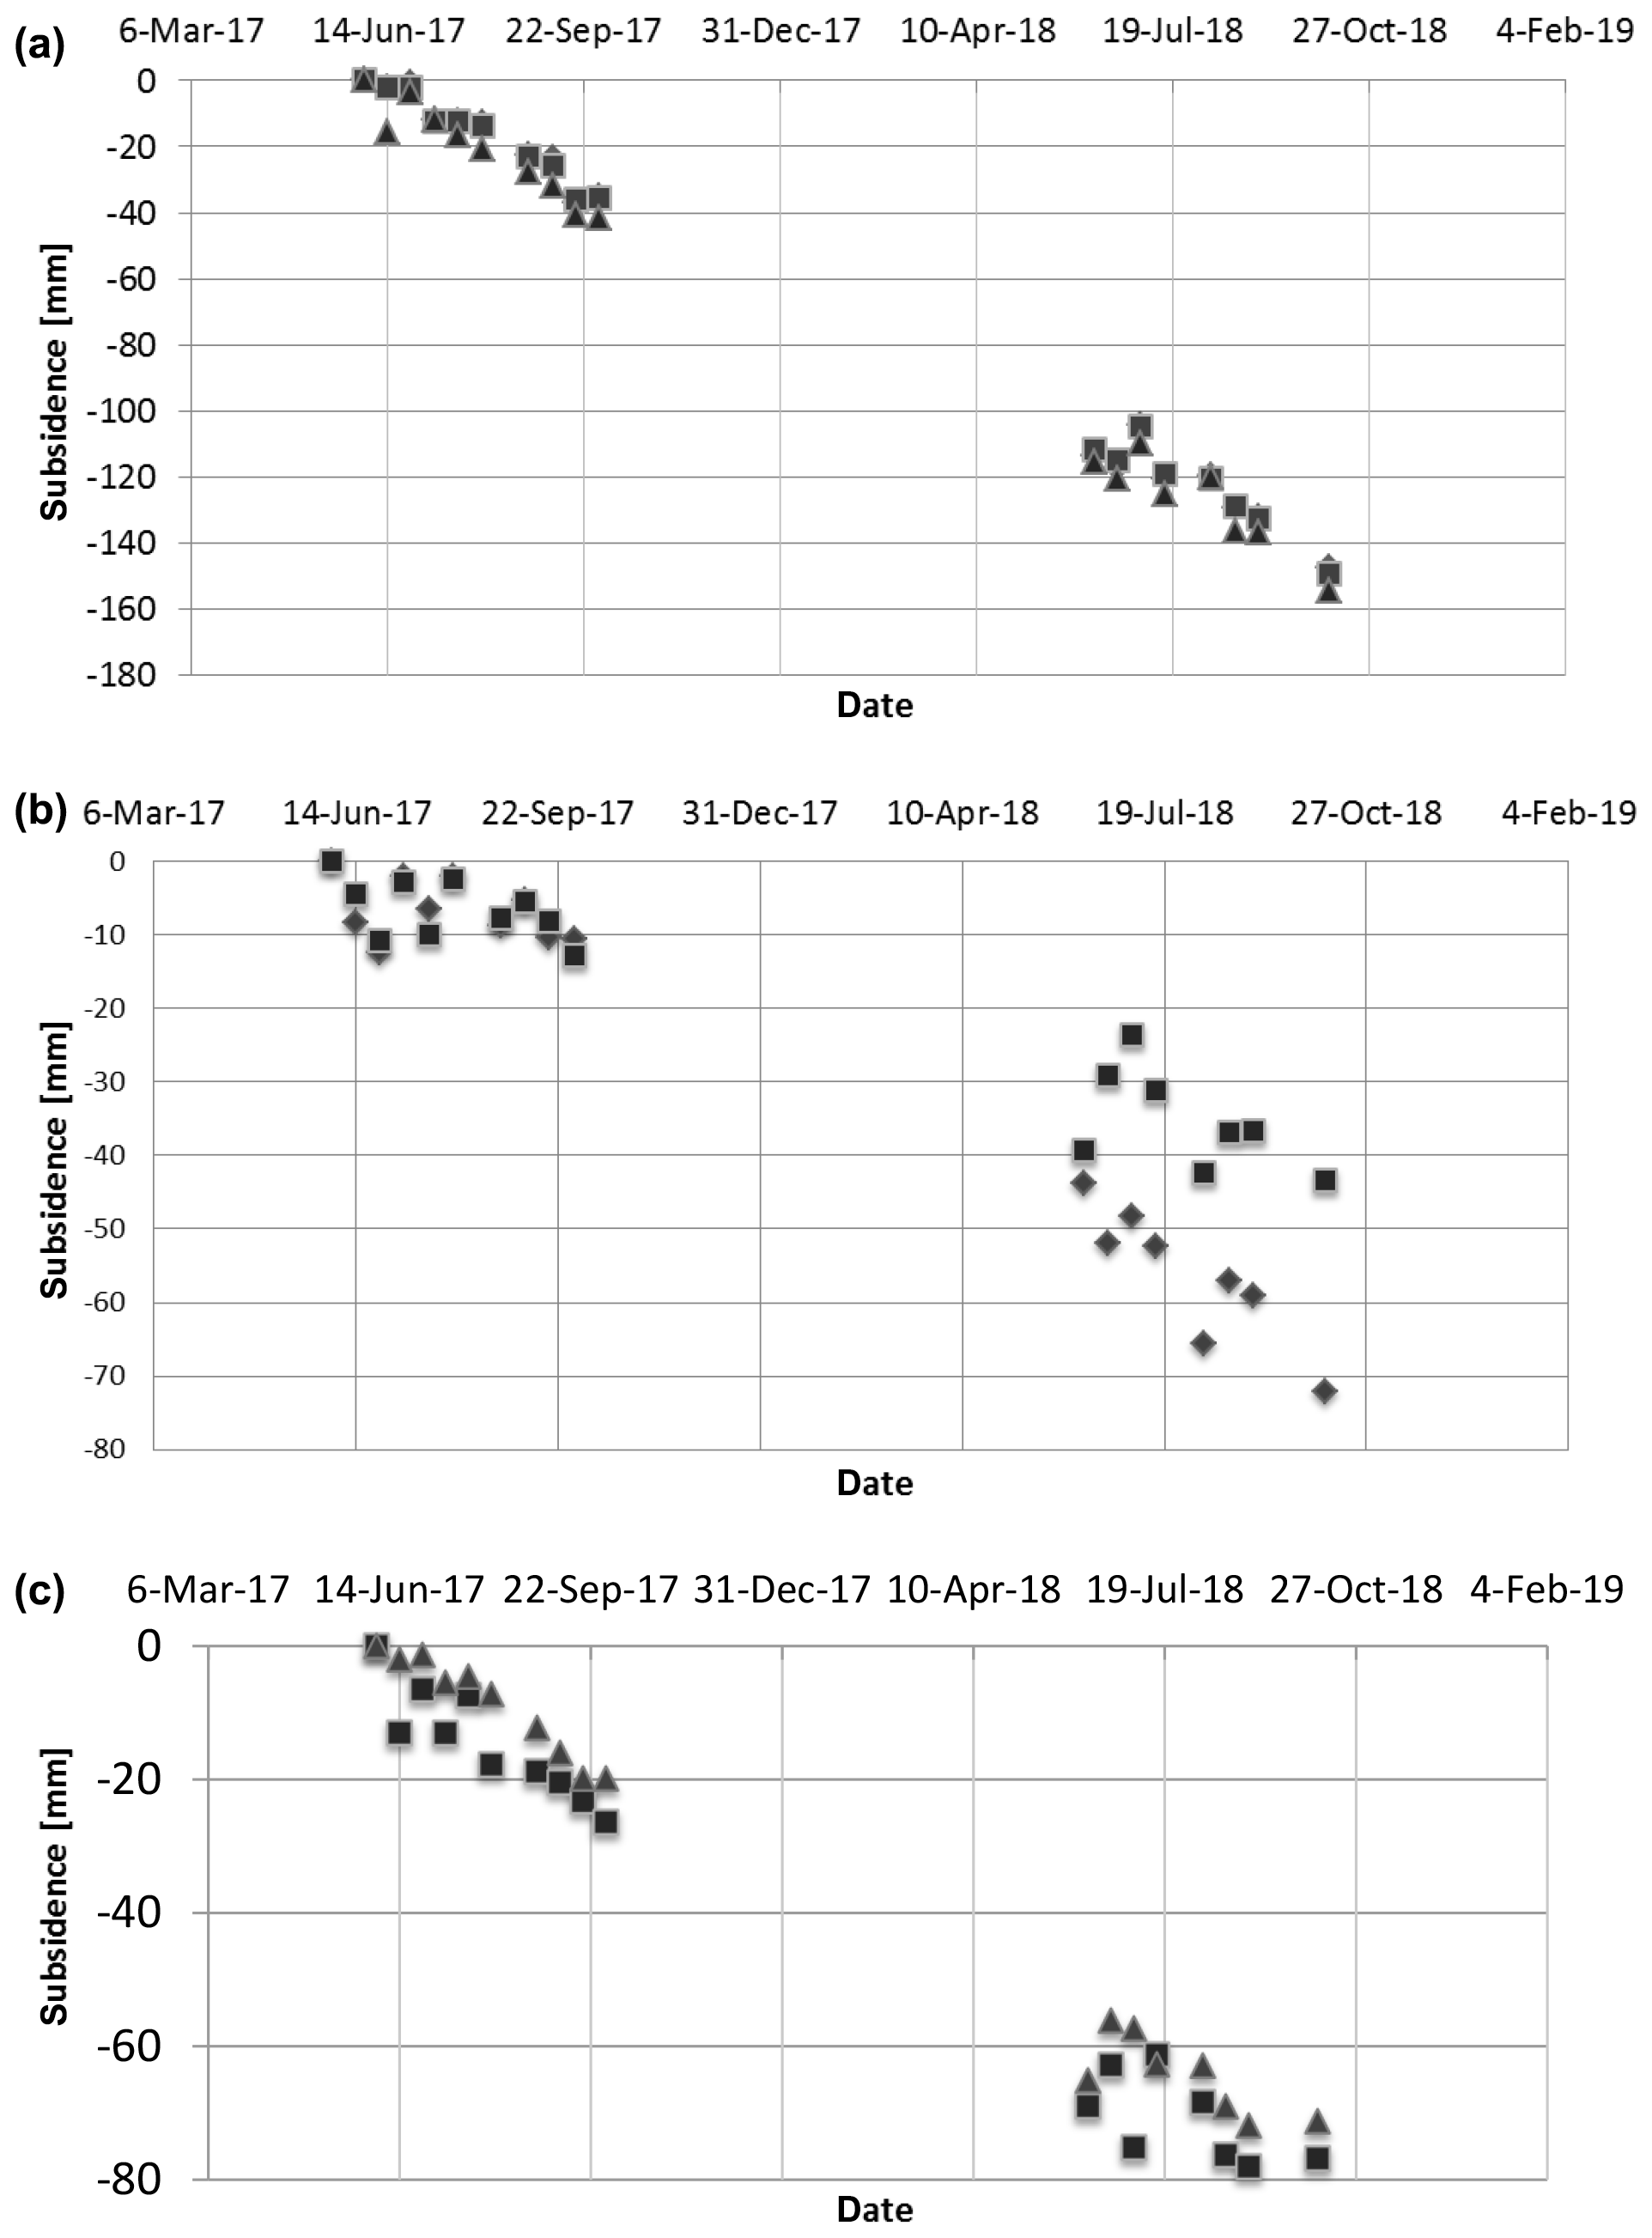
Figure 3InSAR time-series showing gradual seasonal subsidence for A, B and C zones (Figs. 1 and 2). This analysis reveals that zone A is subsiding with higher rates relative to zones B and C.

Figure 4Soil profiles showing the depth of active layer 40–150 cm near Bovanenkovo site. Tundra Histic Crysol with permafrost occurring at 40 cm (a) consist of horizons O-Bg. The O horizon consists of organic horizon containing decomposed organic matter and peat. Bg is mineral gley horizon of soil, gray with bluish hue, light loam texture, sand. (b) Histic Crysol with permafrost occurring at 70 cm consist of horizons O-B1-B2-Cg. Soil horizon O consist of peat. The mineral horizons B1 and B2 are heterogeneous in color, gray with dark spots and light loam texture. Cg mineral horizon consist of unconsolidated earth material with gray sandy loam texture. (c) Eutric Cryosols with permafrost occurring at 150 cm depth. The soil consist of horizons A-Bg-Cg. Mineral horizon A dark brown, sandy loam texture with fine grained material sand. Bg mineral horizon, yellow brown to dark brown and sandy loam texture. Cg is light brown and sandy soil.
The temporal evolution of the detected surface subsidence between June–September 2017 and 2018 based on the time-series of date-to-date LOS displacements plotted in Fig. 3. The temporal evolution of the subsidence rates in all plots is a continuous with a gradual increase in rate season to season. The plot A shows a seasonal deformation signal which gradually increase up to 170 mm, while plots B and C show differences up to 70 and 80 mm in the temporal evolution between the deformation rates (Fig. 3). The rates indicate the subsidence in these areas are related to the seasonal thawing process.
PS-InSAR technique is a powerful tool to measure displacements of moving ground objects from time series of SAR images to millimeter precision (Colesanti et al., 2003). It is not so straight forward to exactly identify individual objects acting as persistent scatterers in the SAR images over a remote permafrost region. Therefore, for regional permafrost remote areas with fewer ground control, it can be assumed that the displacements of the objects reflecting the radar signal represent the ground movements of the earth surface and not only the object on top of it. In the present study, we verified whether the observed slow subsidence in Yamal peninsula can be explained by glaciation of preexisting geomorphic/tectonic setting or whether it is the result of anthropogenic activity in the region or it is result of both.
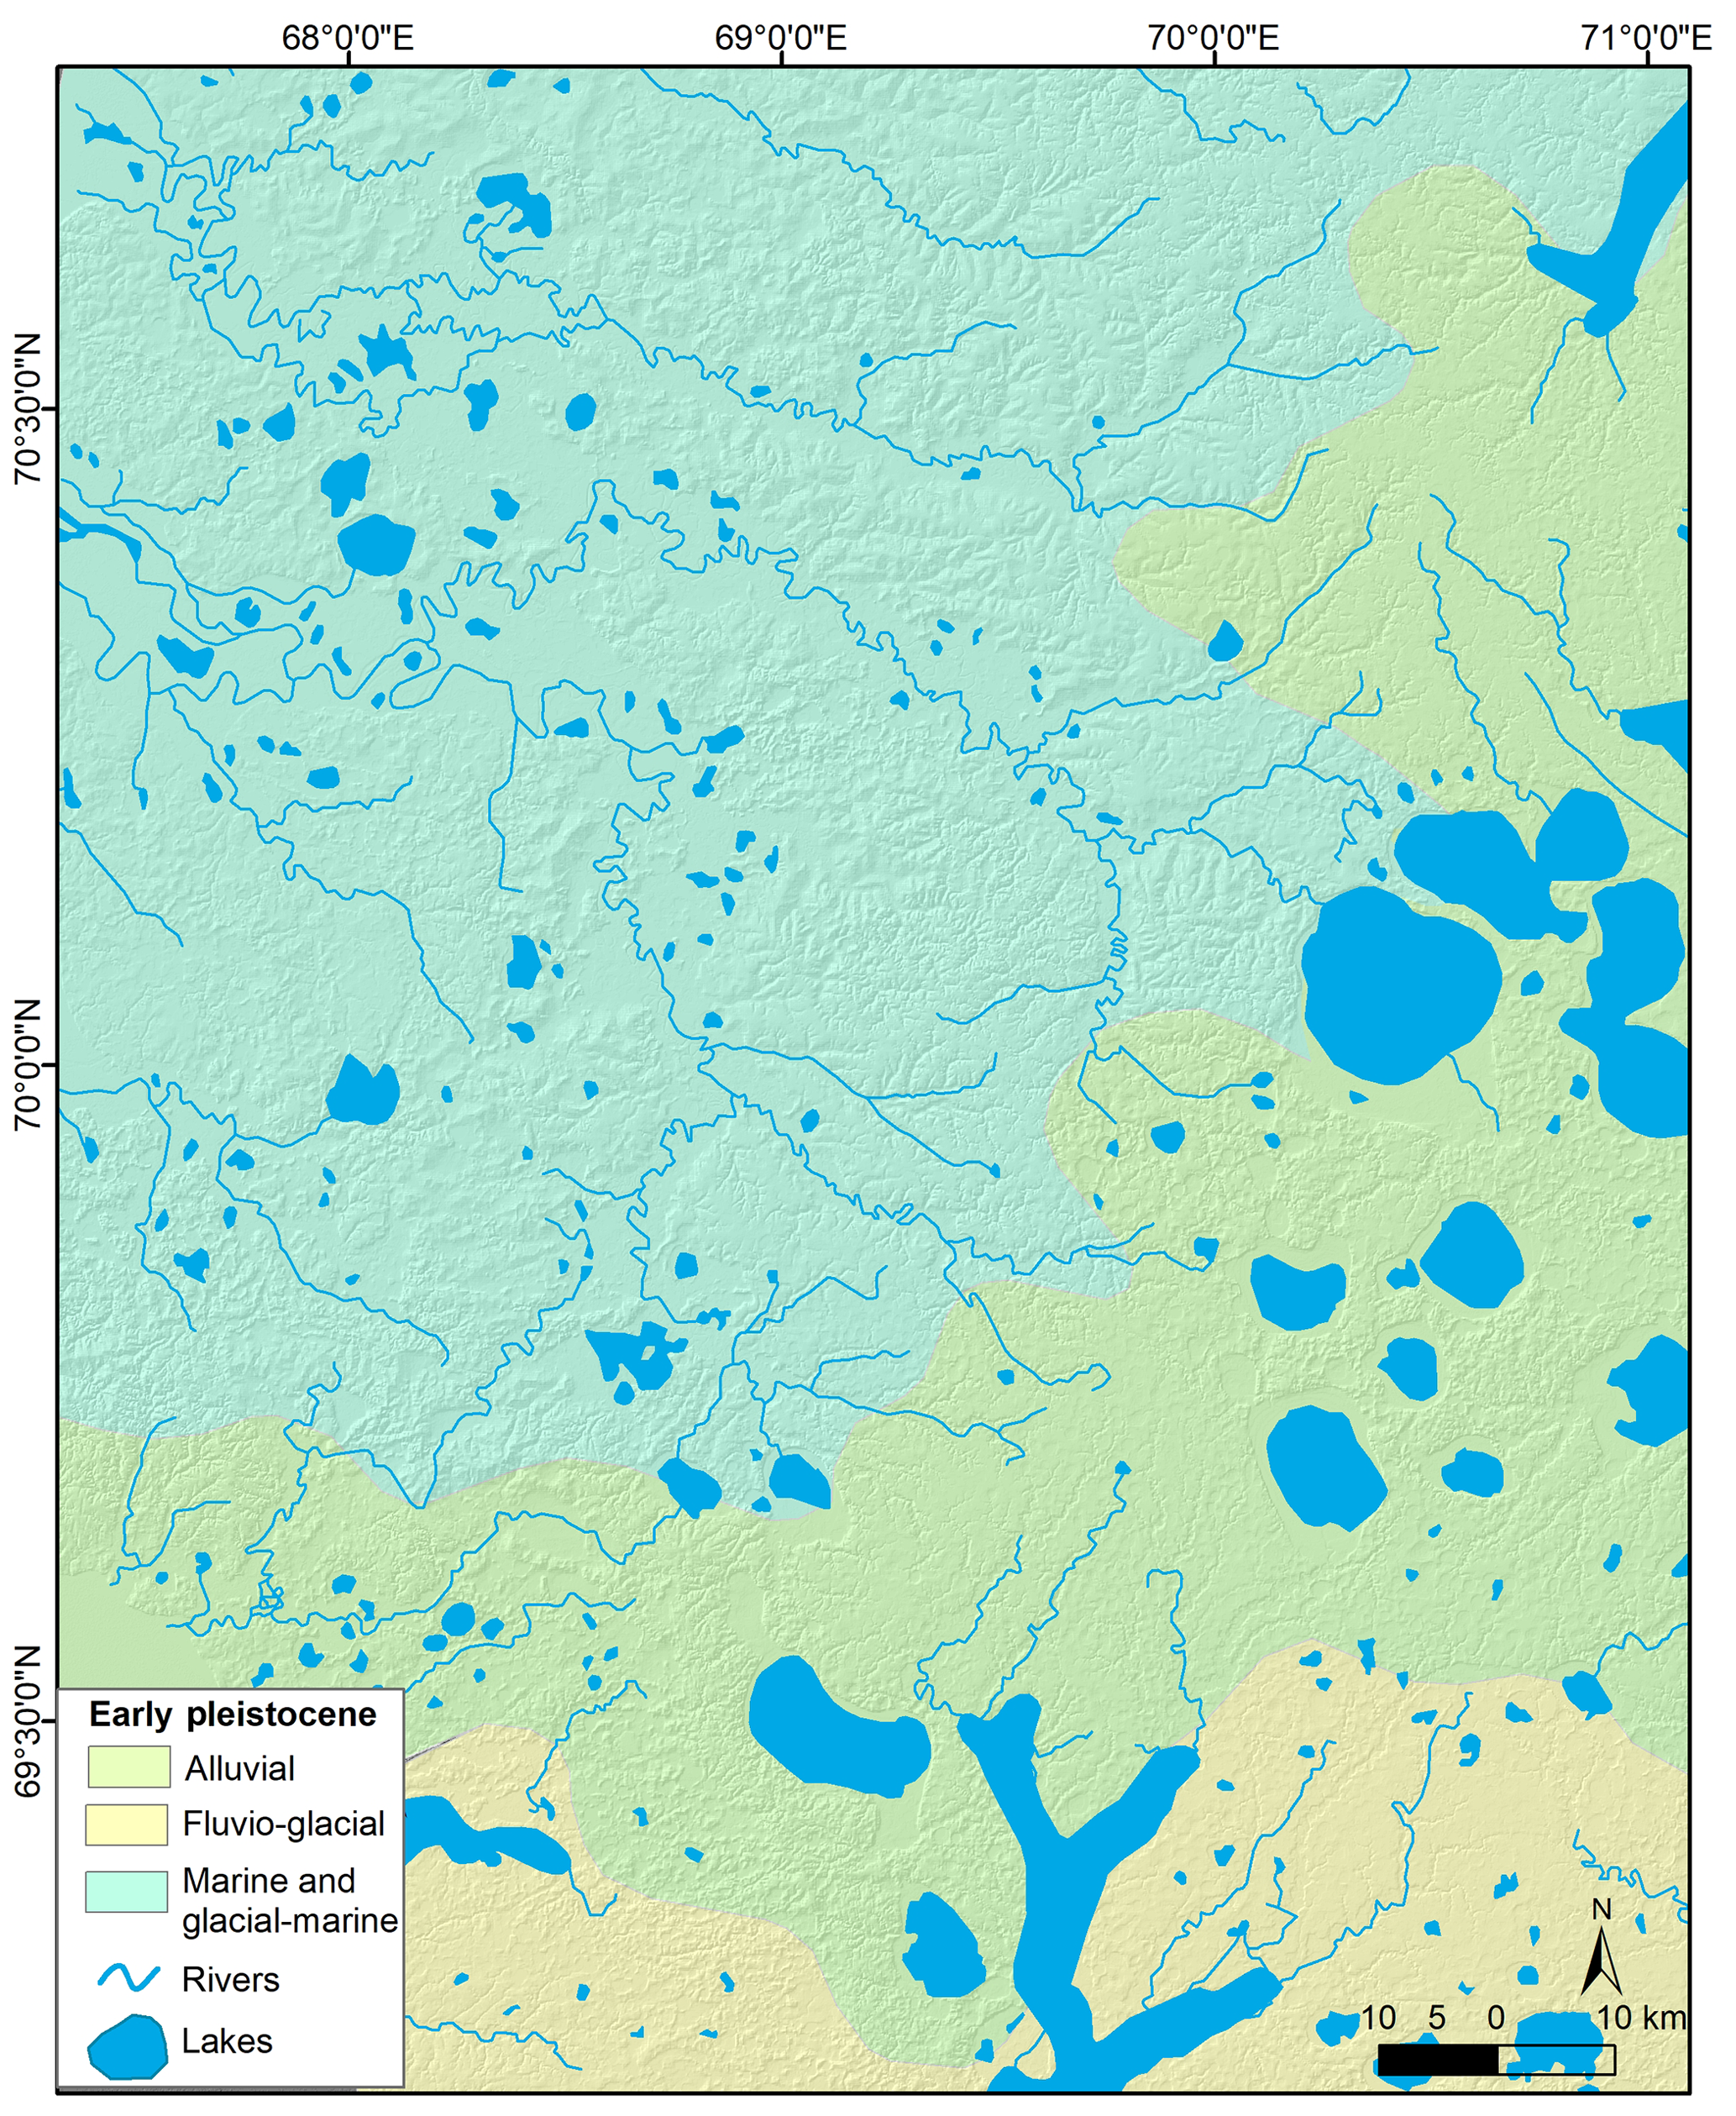
Figure 5Geology map of the study area. The map is modified after FAO project defined geology map of the western Siberia.
Concerning the tectonic setting Yamal peninsula is located north of Ural Mountains and was uplifted and eroded during Oligocene-Pliocene time. Available limited seismic data indicate that the north to northwest trending linear structures are present. Late Pliocene-Quaternary glacial marine sediments up to 200 m thick overlie the erosional surface (Astakhov, 2004, 2011; Chuvilin et al., 2000; Ulmishek, 2003; Volkova, 2014) The permafrost is continuous; the thickness of the permafrost layer varies between 200 m river valleys and 250 in hilly terrain (Chuvilin et al., 2000).
The active layer within study area varies from 40 to 150 cm from field work observations during early September 2017 (field observations, Fig. 4). The subsidence zones are correlated with lithology of the area. Zone A is located in the area of marine deposits and zones B and C are located within alluvial deposits (Fig. 5).
The temporal evolution of the subsidence rates in zone A around the Bovanenkovo field show higher rates compared to zones B and C (Figs. 1 and 3). Zone A is underlain by fine grained deposits subside faster because the overlying loess-like silty-clay materials are likely to have a high ice content (Fig. 5). The soils are characterized by a high content of fine-grained material and, owing to this, by predominance of crustal and lense-like cryostructures in the transition zone at the top of the permafrost. The Eocene marine sediments in the region are bedded thin-tabular gray and dark gray clay (Astakhov, 2004; Chuvilin et al., 2000; Volkova, 2014). Bodies of ground ice in the area have been detected by geophysical surveys (Olenchenko et al., 2015).
The subsidence rates in zones B and C are less compared to zone A due to the ice wedges with coarser grain deposits covered by loess (Figs. 2 and 5). The zones B and C are within alluvial deposits, the most distinctive feature of the cryogenic structure. The alluvial deposits are loess layers with ice wedges formed during Valdai glaciation (Astakhov, 2011). Given correlation with lithology within study area, the hypothesis of preexisting geomorphic/tectonic setting can be accepted.
Regarding the second hypothesis, studies have demonstrated that human activity as settlements and gas extraction have major impact on permafrost melt and subsidence (Hjort et al., 2018; L. Liu et al., 2015; Raynolds et al., 2014). Subsidence due to gas extraction may have contributed in particular to zone A; subsidence caused by gas extraction is a common feature in gas fields (van Thienen-Visser et al., 2015).
All data presented in this paper are available upon request. Please contact the corresponding author (kanayim@gmail.com).
KT performed the analyses and interpretation, she wrote the paper with contributions from KJvH. AVP, DNB, AIS and NK helped with field work and analyses of soil profiles.
The authors declare that they have no conflict of interest.
This article is part of the special issue “TISOLS: the Tenth International Symposium On Land Subsidence – living with subsidence”. It is a result of the Tenth International Symposium on Land Subsidence, Delft, the Netherlands, 17–21 May 2021.
We thank Inter-Regional Expedition Center “Arctic” for assistance with field expeditions to the Yamal peninsula.
This research has been supported by the Netherlands Organization for Scientific Research NWO (grant no. ALW-GO/16-13).
Astakhov, V.: Pleistocene ice limits in the Russian northern lowlands, Quat. Glaciat. Chronol. Part, 1, 309–319, 2004.
Astakhov, V.: Ice margins of northern Russia revisited, in: Developments in Quaternary Sciences, edited by: Ehlers, J., Gibbard, P. L., and Hughes, P. D., Vol. 15, 323–336, Elsevier, 2011.
Chen, F., Lin, H., Zhou, W., Hong, T., and Wang, G.: Surface deformation detected by ALOS PALSAR small baseline SAR interferometry over permafrost environment of Beiluhe section, Tibet Plateau, China, Remote Sens. Environ., 138, 10–18, 2013.
Chuvilin, E. M., Yakushev, V. S., and Perlova, E. V: Gas and possible gas hydrates in the permafrost of Bovanenkovo gas field, Yamal Peninsula, West Siberia, Polarforschung, 68, 215–219, 2000.
Colesanti, C., Ferretti, A., Locatelli, R., Novali, F., and Savio, G.: Permanent scatterers: precision assessment and multi-platform analysis, in: IGARSS 2003, 2003 IEEE Int. Geosci. Remote Sens. Symp., Proceedings (IEEE Cat. No. 03CH37477), 2, 1193–1195, 2003.
French, H. M: The periglacial enviroment, 4th Edition, John Wiley & Sons, 544, 2017.
Hjort, J., Karjalainen, O., Aalto, J., Westermann, S., Romanovsky, V. E., Nelson, F. E., Etzelmüller, B., and Luoto, M.: Degrading permafrost puts Arctic infrastructure at risk by mid-century, Nat. Commun., 9, 5147, 2018.
Kizyakov, A., Zimin, M., Sonyushkin, A., Dvornikov, Y., Khomutov, A., and Leibman, M.: Comparison of Gas Emission Crater Geomorphodynamics on Yamal and Gydan Peninsulas (Russia), Based on Repeat Very-High-Resolution Stereopairs, Remote Sens., 9, 1023, 2017.
Leibman, M. O., Kizyakov, A. I., Plekhanov, A. V., and Streletskaya, I. D.: New permafrost feature–dep crater in Central Yamal (West Siberia, Rusia) as a response to local climate fluctuations, Geogr. Environ. Sustain., 7, 68–79, 2014.
Liu, J., Kang, S., Gong, T., and Lu, A.: Growth of a high-elevation large inland lake, associated with climate change and permafrost degradation in Tibet, Hydrol. Earth Syst. Sci., 14, 481–489, https://doi.org/10.5194/hess-14-481-2010, 2010.
Liu, L., Schaefer, K. M., Chen, A. C., Gusmeroli, A., Zebker, H. A., and Zhang, T.: Remote sensing measurements of thermokarst subsidence using InSAR, J. Geophys. Res.-Earth Surf., 120, 1935–1948, 2015.
Liu, X., Guo, Y., Hu, H., Sun, C., Zhao, X., and Wei, C.: Dynamics and controls of CO2 and CH4 emissions in the wetland of a montane permafrost region, northeast China, Atmos. Environ., 122, 454–462, 2015.
Nauta, A. L., Heijmans, M. M. P. D., Blok, D., Limpens, J., Elberling, B., Gallagher, A., Li, B., Petrov, R. E., Maximov, T. C., and Van Huissteden, J.: Permafrost collapse after shrub removal shifts tundra ecosystem to a methane source, Nat. Clim. Chang., 5, 67–70, 2015.
Olenchenko, V. V., Sinitsky, A. I., Antonov, E. Y., Eltsov, I. N., Kushnarenko, O. N., Plotnikov, A. E., Potapov, V. V., and Epov, M. I.: Results of geophysical surveys of the area of “Yamal crater”, the new geological structure, Kriosf. Zemli, 19, 84–95, 2015.
Raynolds, M. K., Walker, D. A., Ambrosius, K. J., Brown, J., Everett, K. R., Kanevskiy, M., Kofinas, G. P., Romanovsky, V. E., Shur, Y., and Webber, P. J.: Cumulative geoecological effects of 62 years of infrastructure and climate change in ice-rich permafrost landscapes, Prudhoe Bay Oilfield, Alaska, Global Change Biol., 20, 1211–1224, 2014.
Schuur, E. A. G., McGuire, A. D., Schädel, C., Grosse, G., Harden, J. W., Hayes, D. J., Hugelius, G., Koven, C. D., Kuhry, P., and Lawrence, D. M.: Climate change and the permafrost carbon feedback, Nature, 520, 171–179, 2015.
Short, N., LeBlanc, A.-M., Sladen, W., Oldenborger, G., Mathon-Dufour, V., and Brisco, B.: RADARSAT-2 D-InSAR for ground displacement in permafrost terrain, validation from Iqaluit Airport, Baffin Island, Canada, Remote Sens. Environ., 141, 40–51, 2014.
van Thienen-Visser, K., Pruiksma, J. P., and Breunese, J. N.: Compaction and subsidence of the Groningen gas field in the Netherlands, Proc. Int. Assoc. Hydrol. Sci., 372, 367–373, 2015.
Ulmishek, G. F.: Petroleum geology and resources of the West Siberian Basin, Russia, US Department of the Interior, US Geological Survey Reston, Virginia, 2003.
Volkova, V. S.: Geologic stages of the paleogene and neogene evolution of the Arctic shelf in the Ob'region (West Siberia), Russ. Geol. Geophys., 55, 483–494, 2014.