the Creative Commons Attribution 4.0 License.
the Creative Commons Attribution 4.0 License.
 | 18 Dec 2018
Validating improved-MODIS products from spectral mixture-Landsat snow cover maps in a mountain region in southern Spain
Carlo Marín
Ludovica De Gregorio
Mattia Callegari
María J. Pérez-Palazón
Claudia Notarnicola
María J. Polo
Remote sensing is the only feasible data source for distributed modelling of snow in mountain regions on medium to large scales, due to the limited access to these areas together with the lack of dense ground monitoring stations for snow variables. Observations worldwide identify snow cover persistence together with snowfall occurrence as the most affected variables by global warming. In Mediterranean regions, the spatiotemporal evolution of the snow cover can experiment quick changes that result in different accumulation-ablation cycles during the cold season. High frequency sensors are required to adequately monitor such shifts; however, for trend analyses, the Landsat time series constitute the only available source of data, being their frequency low for this regime, especially when cloudy conditions limit the available images. On the other hand, the MODIS daily series provide more than 15 years of continuous snow maps, despite the spatial resolution may pose a constraint in areas with abrupt topography; several approaches have been done to improve their spatial resolution from combining different information. This work presents a methodological approach to validate the improved MODIS daily snow cover maps from Notarnicola et al. (2013a, b), with 250 m spatial resolution, in Sierra Nevada (southern Spain), from a reference data set obtained by spectral mixture analyses of Landsat TM data by Pimentel et al. (2017b). This reference time series of fractional snow maps, with 30 m spatial resolution, were validated from high resolution local time series of snow maps obtained by terrestrial time-lapse cameras. The results show a significantly high correlation between the two snow map products both on a global and basin scales in the Sierra Nevada area. Selected areas and time periods are shown to address the convergence and divergence between both products and assess the development of a fusion algorithm to retrieve daily Landsat-resolution snow maps on a long term basis.
- Article
(3195 KB) - Full-text XML
- BibTeX
- EndNote


Figure 1Area of Sierra Nevada Mountain (Spain) above 1500 m a.s.l. and limits of the five regions in which the study area has been divided for the spatial analysis: R1 – Adra, R2 – Andarax, R3 – Fardes, R4 – Genil and R5 – Guadalfeo.
Remote sensing techniques constitute the best source to provide distributed information about the snowpack evolution on medium to long time scales, complementing the traditional in situ field surveys and automatic ground measurements. Snow cover fraction (SCF) is one of the more reliable snow related variable measured from the space (Dozier and Painter, 2004) and is commonly used in hydrological studies to calibrate, evaluate, or be assimilated into snow distributed modelling (Andreadis and Lettenmaier, 2006; Parajka and Blöschl, 2008; Pimentel et al., 2015) Within the different Earth Observation (EO) missions, (1) Landsat-5 (TM), Landsat-7 (ETM+) and Landsat-8 (OLI), with 30×30 m spatial resolution and 16 days revisiting time (Roy et al., 2014; Pimentel et al., 2017a), and (2) MODIS Terra and Aqua, with 500 m grid cell resolution and daily temporal frequency for snow, are the most extended data sources for snow studies, since they offer the highest spatial and temporal resolution, respectively (Hall et al., 2002).
However, Mediterranean mountainous areas are extremely vulnerable to climate change effects and highly dependent on snow water resources (Barnett et al., 2005; Giorgi, 2006). The particularities of the snowpack make the use of raw EO products not enough to capture these specific patterns. For instance, the very strong spatiotemporal variability, which very often undergoes different accumulation-snowmelt cycles during the cold season in a given year, or the snow patched distribution around local singularities, such as rocks and vegetation, consequence of a very complex ablation process (Ménard et al., 2014; Pimentel et al., 2015, 2017b). Hence, both high temporal and spatial resolutions are required to have a realistic representation of the snow cover.
In this context Pimentel et al. (2017a) carried out a spectral mixture analysis to derive fractional snow cover map time series from Landsat TM and ETM+. High resolution terrestrial photography (TP) was used as ground truth to validate the obtained product. The spatial resolution of the snow cover area was improved using this technique; however, the large revisiting time of Landsat TM and ETM+ in addition to the presence of clouds in some of the dates with snow presence, constitute a big constraint for useful time series. Using the same idea of improving spatial representation of the snow, Notarnicola et al. (2013a, b) developed an algorithm that combines different MODIS products: MOD09GQ-MYD09GQ, MOD09GA-MYD09GA, MOD021KM-MYD021KM, MOD03-MYD03, to produce snow cover maps at 250 m spatial resolution and daily frequency. The algorithm has specific modules to take into account the effect of vegetation and clouds and increase the spatial resolution of the standard snow MODIS product, MOD10A1-MOD10A2, from 500 to 250 m.
This work presents a methodological approach to assess the improved MODIS daily snow cover maps from Notarnicola et al. (2013a, b), in Sierra Nevada (southern Spain), using as reference data set the Landsat fractional cover maps obtained by spectral mixture analyses by Pimentel et al. (2017a).
This study is carried out in Sierra Nevada Mountains, southern Spain (Fig. 1). They are a linear mountain range of 90-km length that runs parallel to the coastline of Mediterranean Sea. Alpine and Mediterranean climate conditions coexist in just a 40-km distance. Strong altitudinal gradients with marked differences between the south (directly affected to the sea) and the north faces are found in the area.
The snow usually appears above 2000 m a.s.l. during winter and spring even though the major snowmelt season generally lasts from April to June, but can be also found at lower altitudes every year. The typically mild Mediterranean winters produce several snowmelt cycles before the final melting phase, which distributes the snow in patches over the terrain. Precipitation and temperature regimes are highly variable among years, with annual precipitation values averaged in the area that can range from 200 to 900 mm and annual mean of the daily minimum and maximum temperature of −5 and 30 ∘C, respectively (Pérez-Palazón et al., 2015).
Two snow cover EO products are used in this study: (1) Fractional snow cover maps, at 30×30 m and 16 days spatial and temporal resolution respectively, derived from spectral mixture analysis of Landsat TM and ETM+ validated using as high resolution terrestrial photography (Pimentel et al., 2017a); (2) binary snow cover maps obtained from an algorithm that combines several MODIS products and produce daily snow cover maps with a grid cell size of 250 m (Notarnicola et al., 2013a, b). In the text these products will be referred as Landsat-mix and MODIS-EURAC, respectively. Both products have a temporal overlapping from 1 January 2002 to 31 August 2013. For this period, a total number of 108 and 2963 cloud-free images were used in the study for Landasat-mix and MODIS-EURAC, respectively; considering as cloudy images those whose presence of clouds exceeded a 10 % of the study area.
SCF was calculated over the whole study area in Sierra Nevada (area above 1500 m a.s.l) and in each one of the five main headwaters regions: R1 – Adra, R2 – Andarax, R3 – Fardes, R4 – Genil and R5 – Guadalfeo, for both snow products, Landsat-mix and MODIS-EURAC.
SCF from both products were compared in the 108 common dates. A simple linear model was fitted in those days to relate both products. Landsat-mix was chosen as ground truth and MODIS-EURAC as dependent variable. Equation (1) was used for that,
where a and b are the two parameters of the lineal model. Using this model, the SCF from MODIS-EURAC was reconstructed using the 2963 cloud-free images.
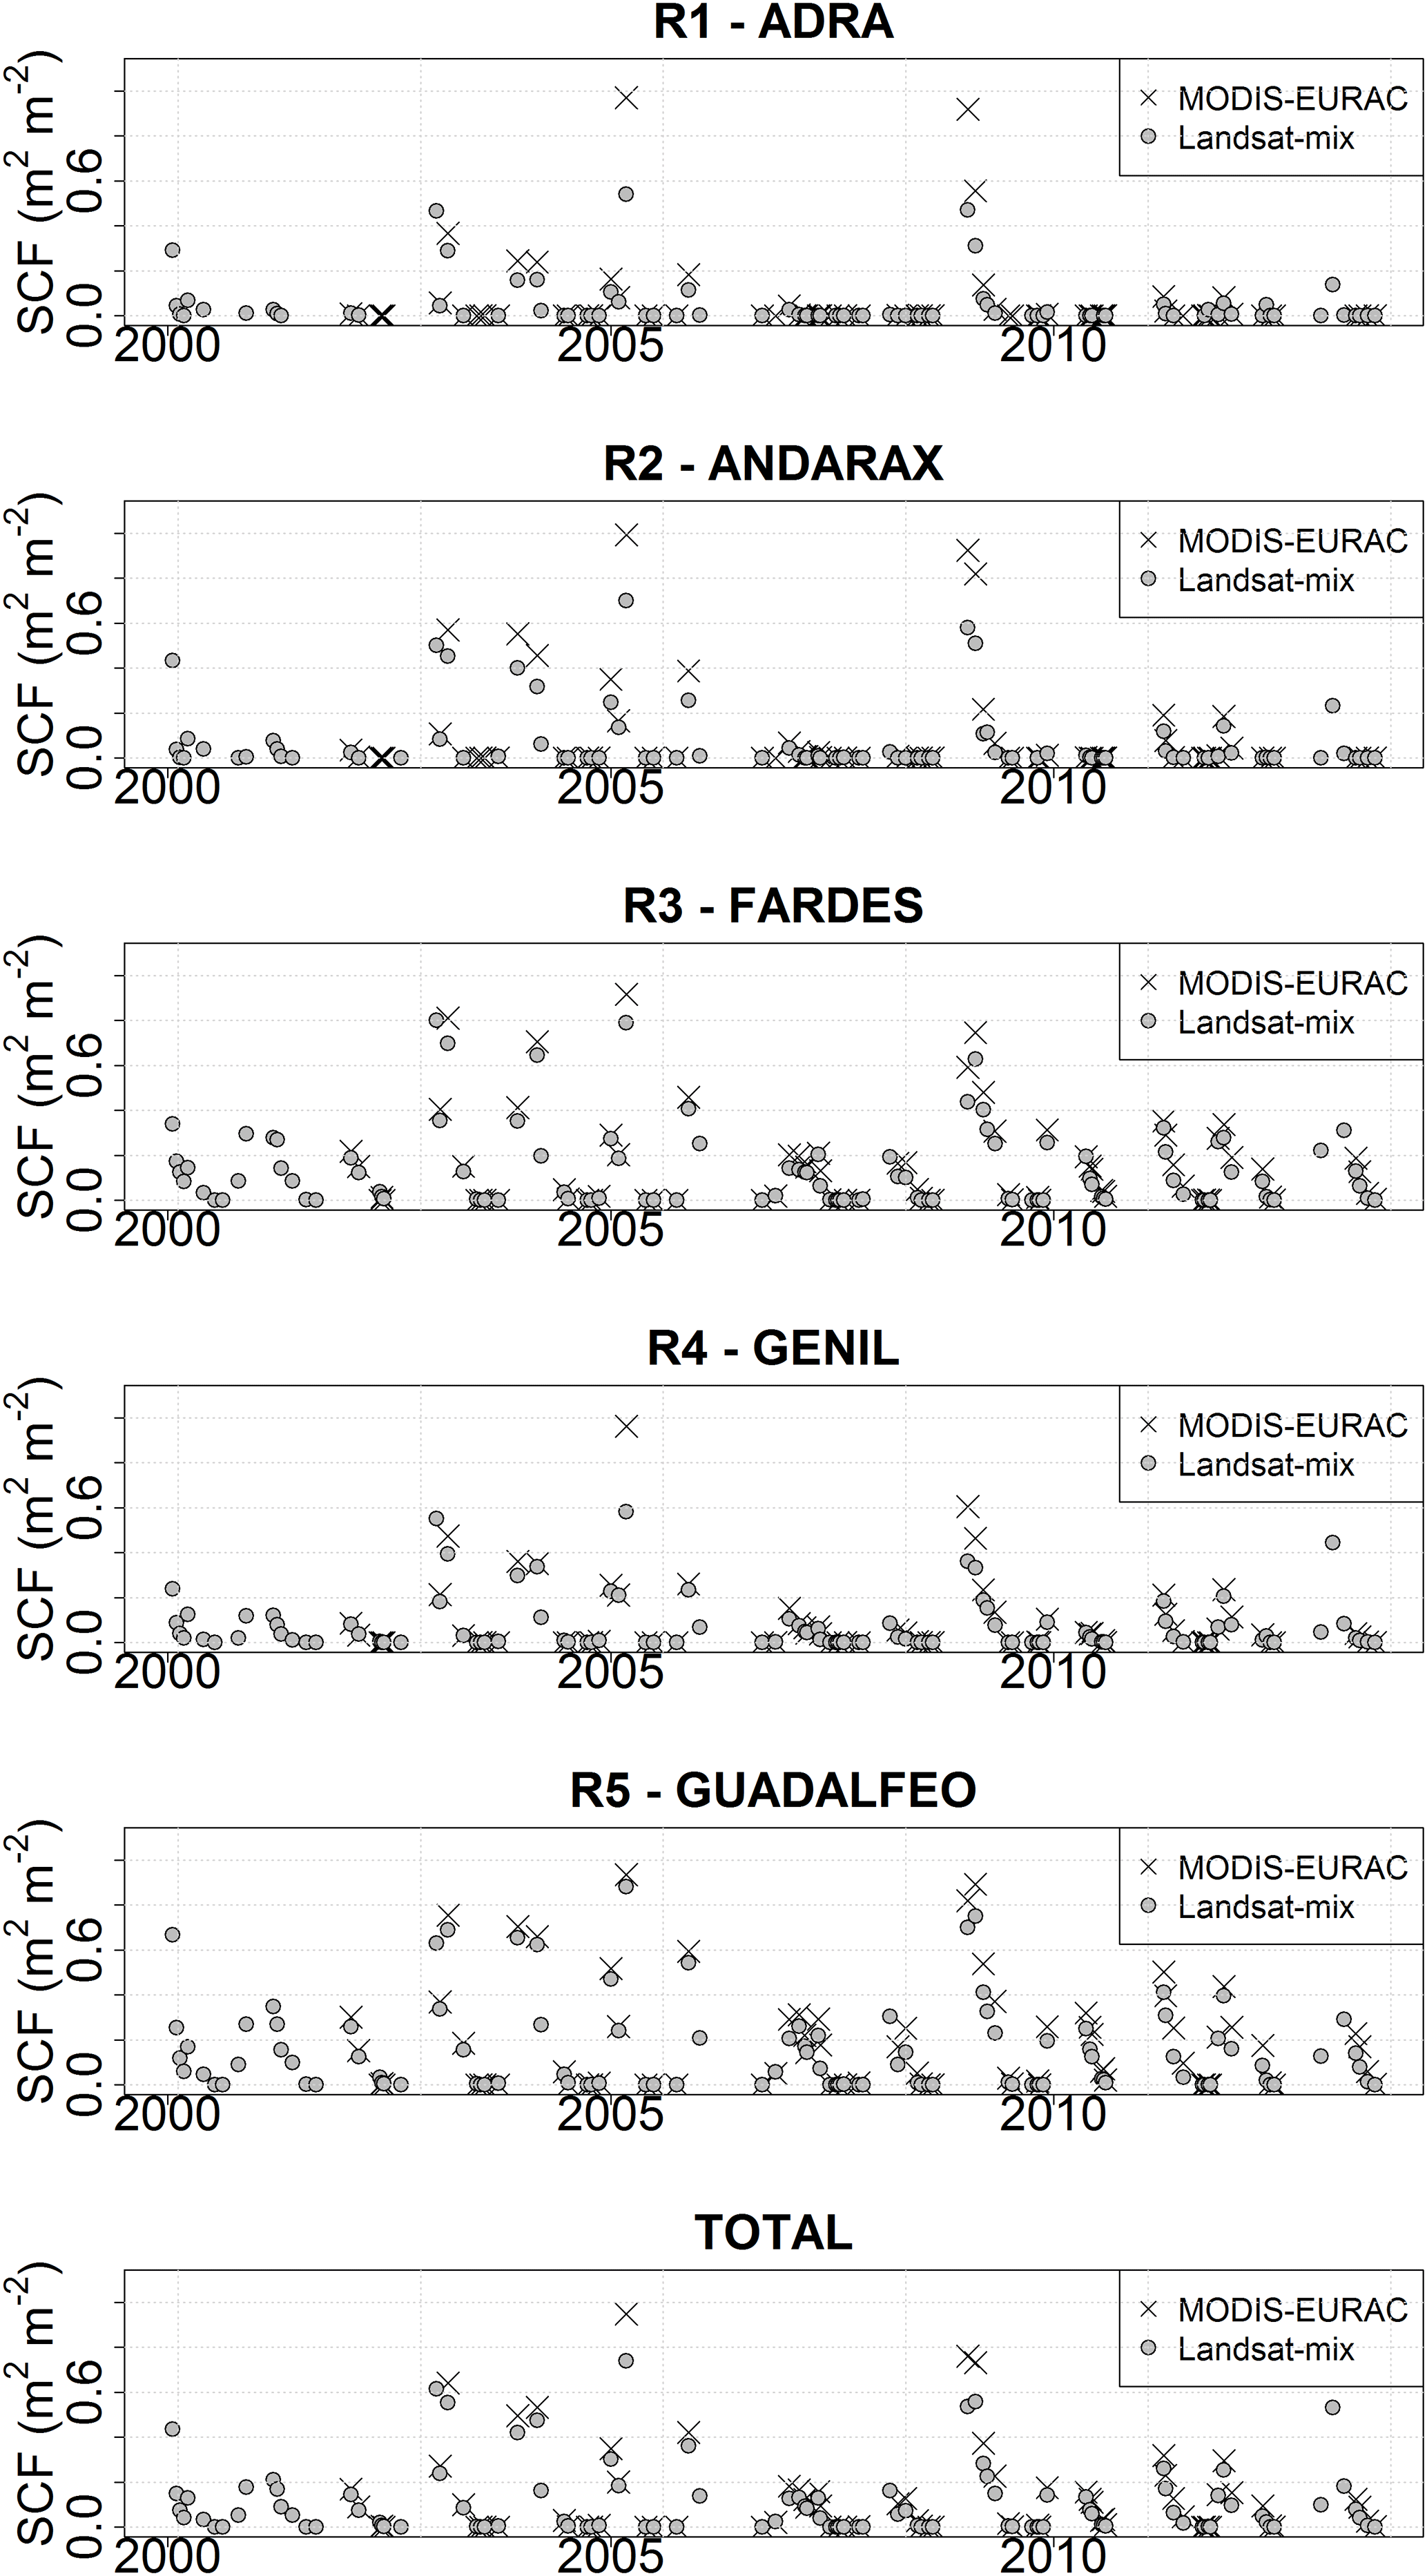
Figure 2Comparison between SCF evolution of both products MODIS-EURAC (black crosses) and Landsat-mix (gray dots) in the 108 overlapping dates, in each of the regions selected and in the whole study area.
Figure 2 shows the evolution of SCF from MODIS-EURAC and Landsat-mix in the overlapping dates for both products in each of the defined regions and over the whole study area. SCF follows the same trend for both products, with a clear overestimation of the SCF derived from MODIS-EURAC. This overestimation is especially significant during the dates with higher SCF values and specifically in R1 – Adra, where differences about 0.20 m2 m−2 can be found in the 2 days with more snow throughout the study period. Differences are practically negligible during dates with low SCF for all the regions. However, this general overestimation trend from MODIS-EURAC change during the last stages of the snowmelt season, when its lower resolution is not able to capture snow remaining isolated snow patches.
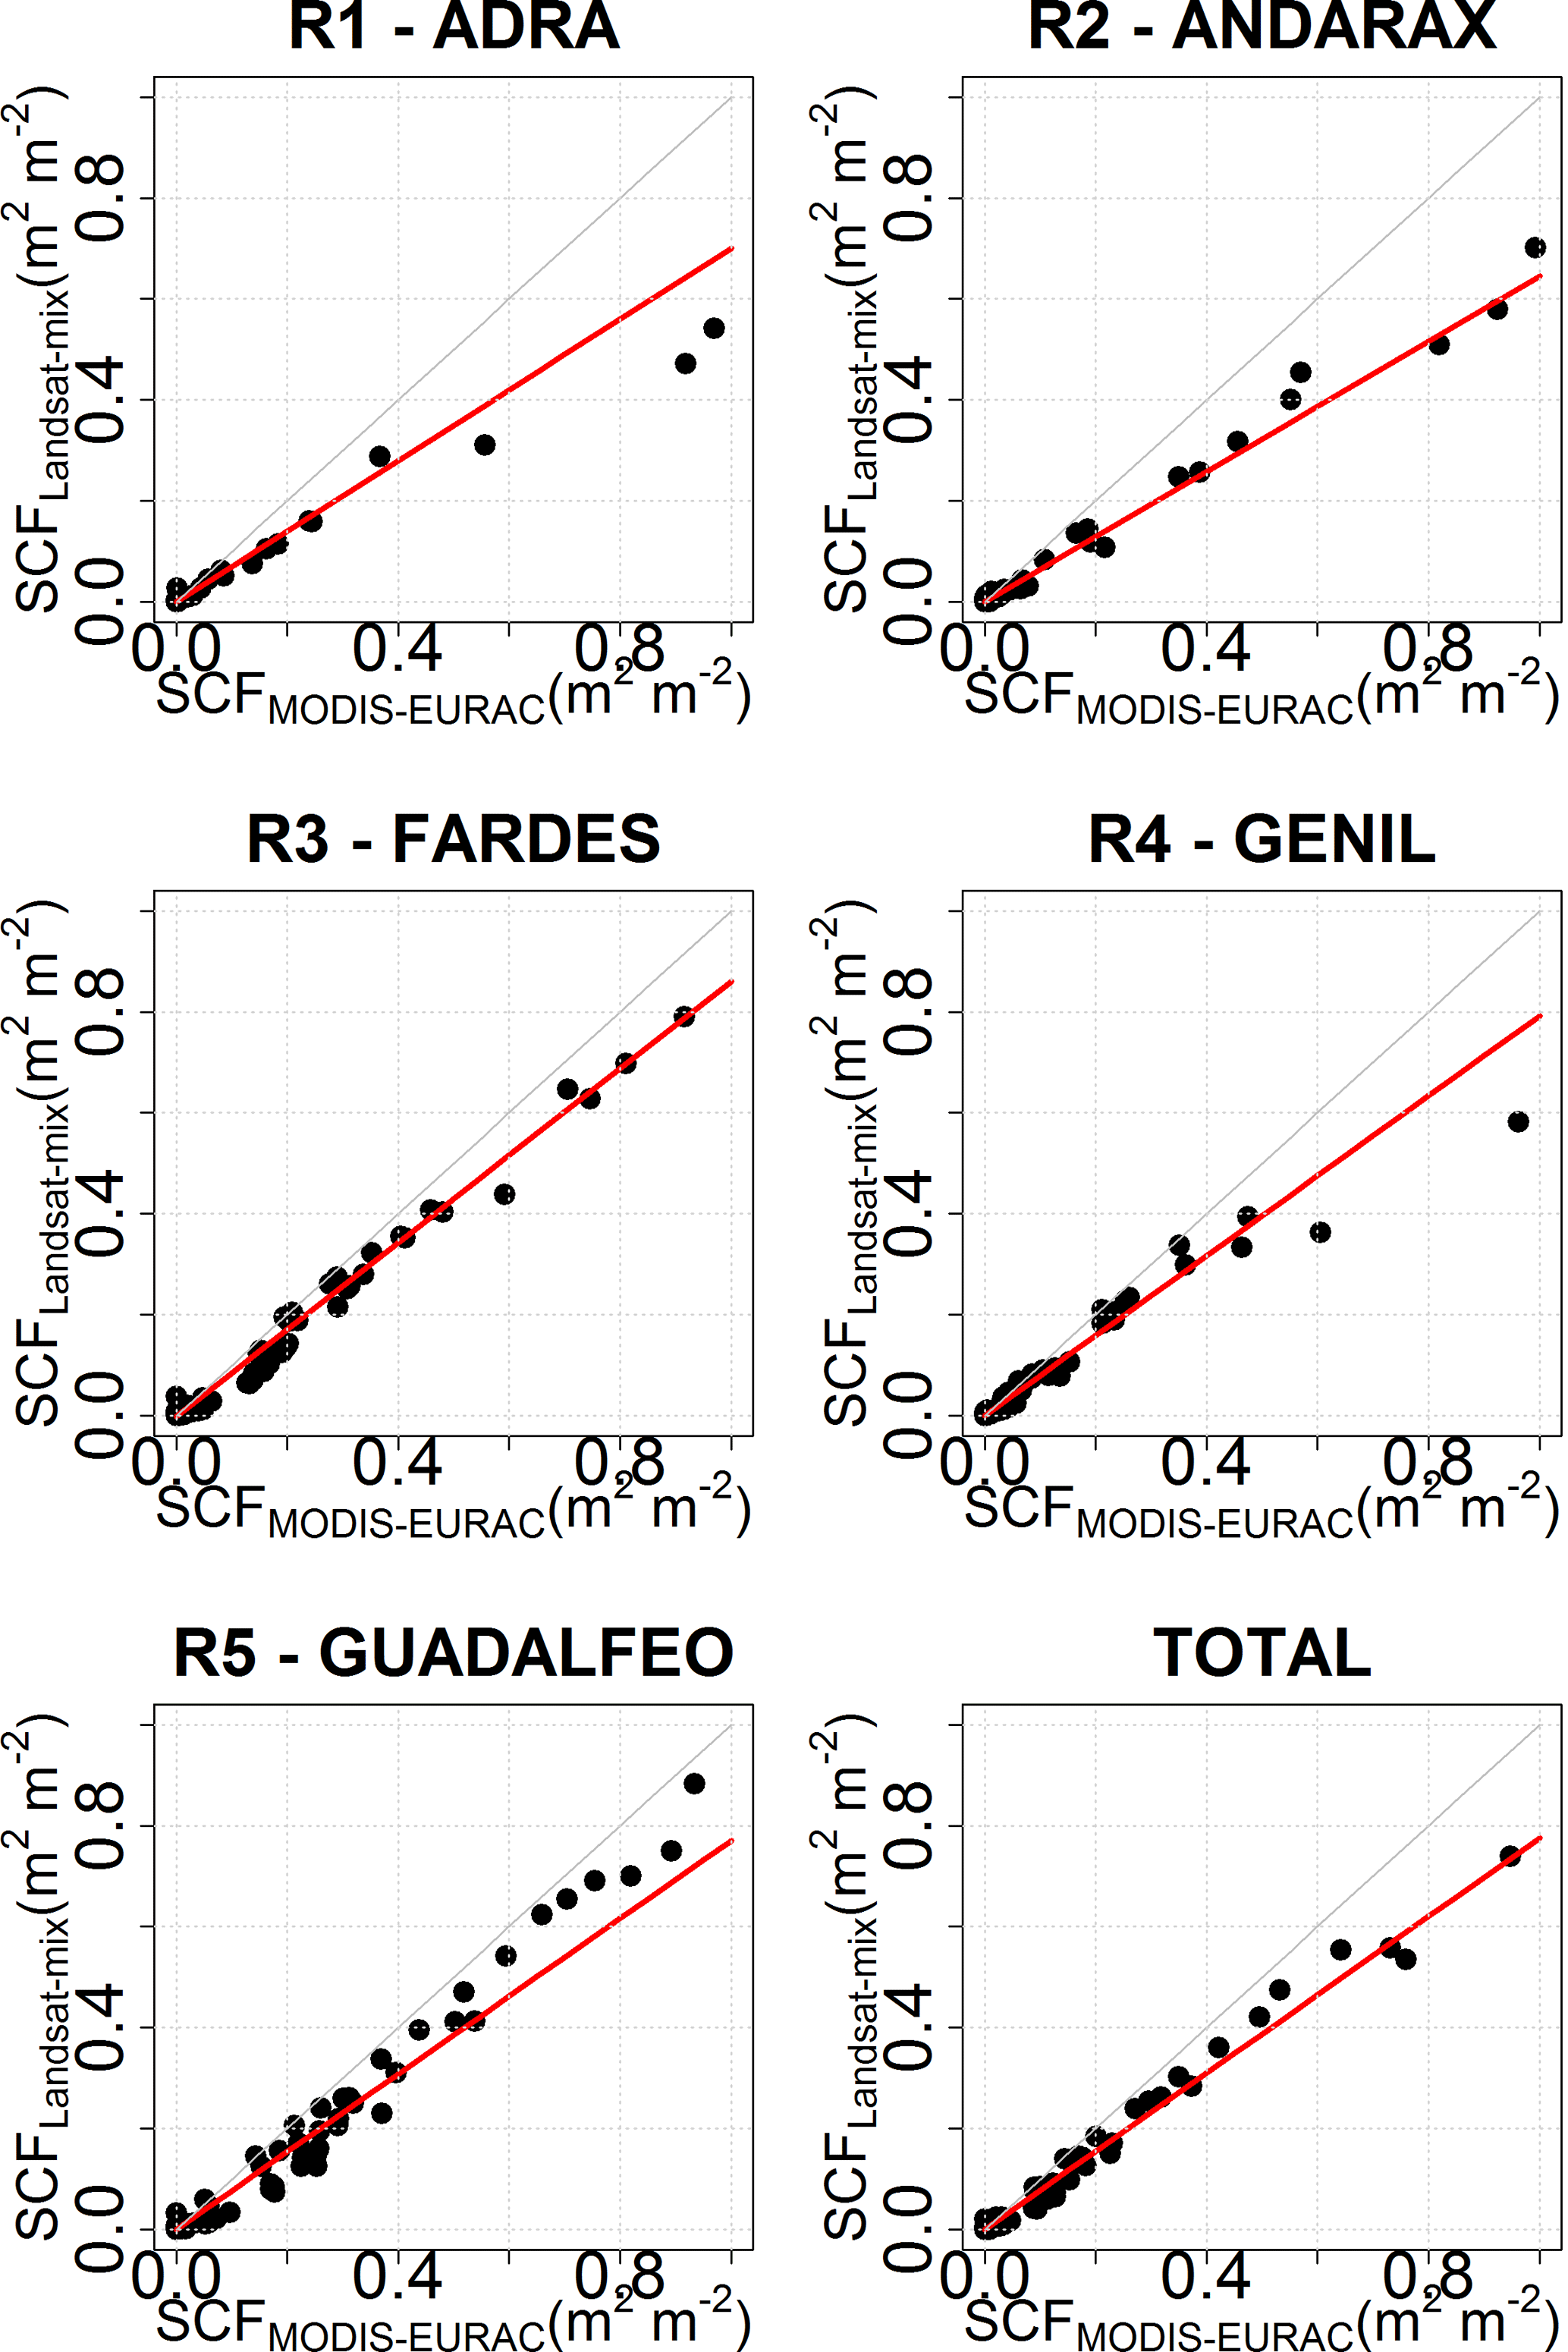
Figure 3Dispersion graphs comparing both products MODIS-EURAC (x-axis) and Landsat-mix (y-axis) in the 108 selected dates along the study period. Linear fit defined following Eq. (1) and the parameters of Table 1 (red line). 1:1 line in light grey.
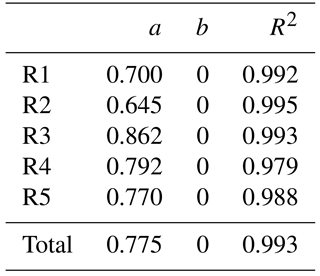
Figure 3 and Table 1 show the linear relation found between the two products and the parameters that fitted these relationships respectively. The linear pattern is clear for all regions, with determination coefficients ranging from 0.979 for R4 – Genil to 0.995 for R2 – Andarax, with a clear overestimation of MODIS-EURAC.
The parameter a (Table 1), which measures the slope of the fitted model and consequently determines the magnitude of the MODIS-EURAC overestimation, differs between regions. Lower values of the parameters, which imply higher overestimations, are found in the drier and warmer areas (Pérez-Palazón et al., 2015), 0.700 in R1 – Adra and 0.645 in R2 – Andarax; located in the south face and with lower mean elevation. On the contrary, wetter and colder regions have higher values and consequently less overestimation coming from MODIS-EURAC. Although, the general accuracy from MODIS snow products is estimated approximately at 93 % (Hall and Riggs, 2007) and similar studies has found an accuracy of 94.6 % comparing MODIS products with surface observations over northern China, (Huang et al., 2016), the heterogeneity of the snow distribution due to the abrupt terrain and climate conditions, make the overestimations of MODIS-ERURAC over this are slightly bigger.
Table 1Fitted parameters and coefficient of determination (a, b and R2) of the linear model that related both products, MODIS-EURAC and Landsat-mix in each of the region and in the whole study area.
The clear linear fit found allows using this relationship as a simple model to correct the average values calculated using MODIS-EURAC over the study area. Overestimation corrections of 0.30, 0.35, 0.13, 0.20 and 0.23 m2 m−2, were achieved for Adra, Andarax, Fardes, Genil and Guadalfeo, respectively; with a mean value of 0.23 m2 m−2 for the whole study area. Figure 4 shows an example of the new corrected values of MODIS-EURAC for the hydrological year 2004–2005. The general MODIS-EURAC overestimation has been reduced giving more realistic values of the total SCF over the study area.
Table 2Annual mean average snow cover fraction (SCF) calculated for the three snow products, Landsat-mix (Land), MODIS-EURAC (MOD) and Corrected MODIS-EURAC (NEW) in each of the study region and the whole study area.
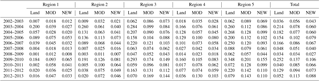
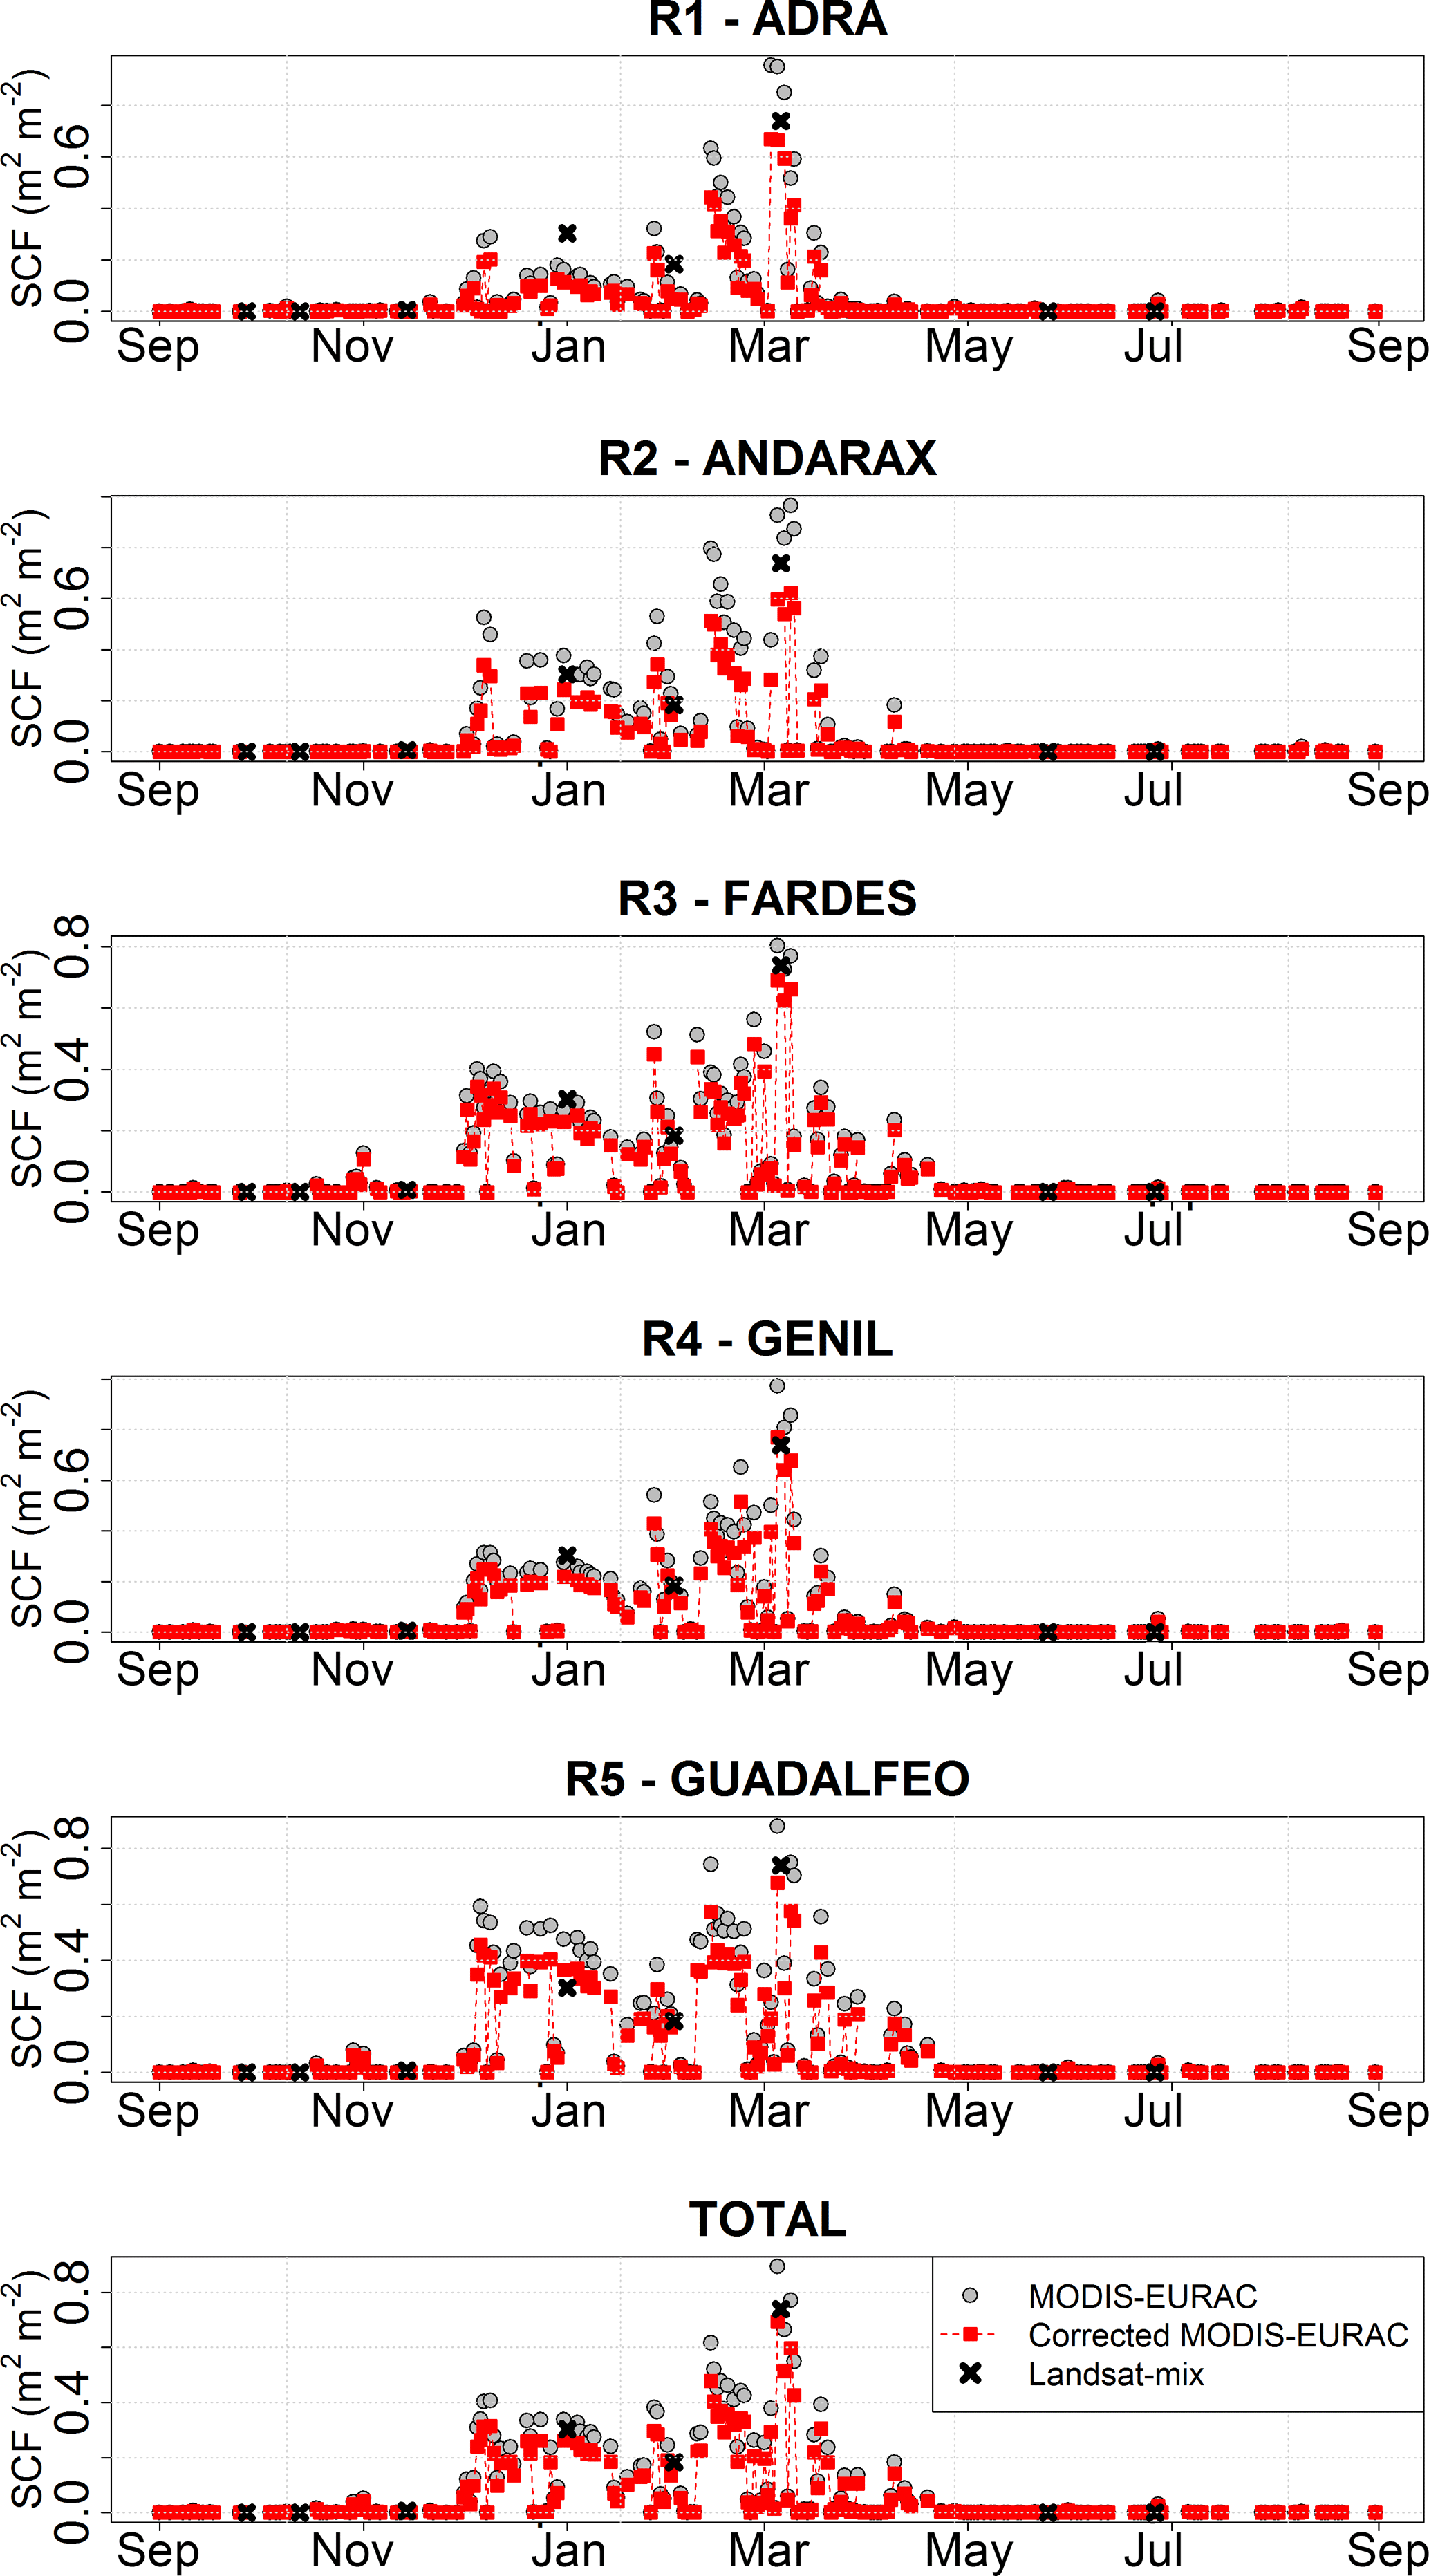
Table 3Annual maximum average snow cover fraction (SCF) calculated for the three snow products, Landsat-mix (Land), MODIS-EURAC (MOD) and Corrected MODIS-EURAC (NEW) in each of the study regions and the whole study area.
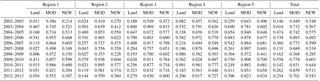
Tables 2 and 3 show the annual mean and maximum SCF calculated for the three snow products, Landsat-mix (Land), MODIS-EURAC (MOD) and Corrected MODIS-EURAC (NEW) in each of the study region and the whole study area, respectively. Both tables show the clear impact that this simple correction has on the quality of the results. The corrected MODIS-EURAC combines the spatial accuracy of the Landsat-mix and the high temporal resolution of the MODIS-EURAC products. Moreover, the direct use of EURAC-MODIS product presented a general overestimation during the high snow covered period, which was partially solved with the correction with the linear model. Further on-going work is exploring the apparent threshold in the large SCF values domain that can be observed in the graphs, together with the different behaviour of Region 5, the mostly-influenced by snow in the study area.
This work shows how the setting out of a simple approach provides a more accurate evolution of the average SCF values over this Mediterranean region, combining the advantages of two already existing products, the high spatial accuracy of Landsat-mix and the daily temporal resolution of MODIS-EURAC. The result is a daily time series on which different studies that require high resolution both of time and space can be based on. This work constitutes the first step in a more complex development of a data fusion algorithm that not only reproduces average behaviour but also snow distribution at grid/subgrid scales.
The improved-MODIS snow products used in this study are available at http://sdi.eurac.edu/geonetwork/srv/eng/metadata.show?id=357955&currTab=advanced (Notarnicola et al., 2013a, b).
RP has been the main responsible of the calculation and writting; CM, LDG and CN have processed the improved-MODIS product; MJPP has contribute in the Landsat scene processing; and MJP has provided the initial idea of this study and help in the writting. All the authors have contributed in the review process.
The authors declare that they have no conflict of interest.
This article is part of the special issue “Earth Observation for Integrated Water and Basin Management: New possibilities and challenges for adaptation to a changing environment”. It is a result of The Remote Sens. & Hydrology Symposium, Cordoba, Spain, 8–10 May 2018.
This work was funded by the Spanish Ministry of Economy and Competitiveness
– MINECO (Research Project CGL2014-58508R, “Global monitoring system for
snow areas in Mediterranean regions: trends analysis and implications for
water resource management in Sierra Nevada”). Moreover, this research was
partially developed within the framework of the Panta Rhei Research
Initiative of the International Association of Hydrological Science (IAHS) in
the Working Group on Water and Energy Fluxes in a Changing
Environment.
Edited by: Ana Andreu
Reviewed by: two anonymous referees
Andreadis, K. M. and Lettenmaier, D. P.: Assimilating remotely sensed snow observations into a macroscale hydrology model, Adv. Water Resour., 29, 872–886, https://doi.org/10.1016/j.advwatres.2005.08.004, 2006.
Barnett, T. P., Adam, J. C., and Lettenmaier, D. P.: Potential impacts of a warming climate on water availability in snow-dominated regions, Nature, 438, 303–309, 2005.
Dozier, J. and Painter, T. H.: Multispectral and Hyperspectral Remote Sens. of Alpine Snow Properties, Annu. Rev. Earth Pl. Sc., 32, 465–494, https://doi.org/10.1146/annurev.earth.32.101802.120404, 2004.
Giorgi, F.: Climate change hot-spots, Geophys. Res. Lett., 33, L08707, https://doi.org/10.1029/2006GL025734, 2006.
Hall, D. K. and Riggs, G. A.: Accuracy assessment of the MODIS snow products, Hydrol. Process., 21, 1534–1547, https://doi.org/10.1002/hyp.6715, 2007.
Hall, D. K., Riggs, G. A., Salomonson, V. V., DiGirolamo, N. E., and Bayr, K. J.: MODIS snow-cover products, Remote Sens. Environ., 83, 181–194, https://doi.org/10.1016/S0034-4257(02)00095-0, 2002.
Huang, J., Ji, M., Xie, Y., Wang, S., He, Y. and Ran, J.: Global semi-arid climate change over last 60 years, Clim. Dynam., 46, 1131–1150, https://doi.org/10.1007/s00382-015-2636-8, 2016.
Ménard, C. B., Essery, R., and Pomeroy, J.: Modelled sensitivity of the snow regime to topography, shrub fraction and shrub height, Hydrol. Earth Syst. Sci., 18, 2375–2392, https://doi.org/10.5194/hess-18-2375-2014, 2014.
Notarnicola, C., Duguay, M., Moelg, N., Schellenberger, T., Tetzlaff, A., Monsorno, R., Costa, A., Steurer, C., and Zebisch, M.: Snow Cover Maps from MODIS Images at 250 m Resolution, Part 1: Algorithm Description, Remote Sens., 5, 110–126, https://doi.org/10.3390/rs5010110, 2013a (data available at: http://sdi.eurac.edu/geonetwork/srv/eng/metadata.show?id=357955&currTab=advanced, last access: 11 September 2018).
Notarnicola, C., Duguay, M., Moelg, N., Schellenberger, T., Tetzlaff, A., Monsorno, R., Costa, A., Steurer, C. and Zebisch, M.: Snow Cover Maps from MODIS Images at 250 m Resolution, Part 2: Validation, Remote Sens., 5, 1568–1587, https://doi.org/10.3390/rs5041568, 2013b (data available at: http://sdi.eurac.edu/geonetwork/srv/eng/metadata.show?id=357955&currTab=advanced, last access: 11 September 2018).
Parajka, J. and Blöschl, G.: The value of MODIS snow cover data in validating and calibrating conceptual hydrologic models, J. Hydrol., 358, 240–258, https://doi.org/10.1016/j.jhydrol.2008.06.006, 2008.
Pérez-Palazón, M. J., Pimentel, R., Herrero, J., Aguilar, C., Perales, J. M., and Polo, M. J.: Extreme values of snow-related variables in Mediterranean regions: trends and long-term forecasting in Sierra Nevada (Spain), Proc. IAHS, 369, 157–162, https://doi.org/10.5194/piahs-369-157-2015, 2015.
Pimentel, R., Herrero, J., Zeng, Y., Su, Z., and Polo, M. J.: Study of Snow Dynamics at Subgrid Scale in Semiarid Environments Combining Terrestrial Photography and Data Assimilation Techniques, J. Hydrometeor., 16, 563–578, https://doi.org/10.1175/JHM-D-14-0046.1, 2015.
Pimentel, R., Herrero, J., and Polo, M. J.: Quantifying Snow Cover Distribution in Semiarid Regions Combining Satellite and Terrestrial Imagery, Remote Sens., 9, 995, https://doi.org/10.3390/rs9100995, 2017a.
Pimentel, R., Herrero, J., and Polo, M. J.: Subgrid parameterization of snow distribution at a Mediterranean site using terrestrial photography, Hydrol. Earth Syst. Sci., 21, 805–820, https://doi.org/10.5194/hess-21-805-2017, 2017b.
Roy, D. P., Wulder, M. A., Loveland, T. R., C.e., W., Allen, R. G., Anderson, M. C., Helder, D., Irons, J. R., Johnson, D. M., Kennedy, R., Scambos, T. A., Schaaf, C. B., Schott, J. R., Sheng, Y., Vermote, E. F., Belward, A. S., Bindschadler, R., Cohen, W. B., Gao, F., Hipple, J. D., Hostert, P., Huntington, J., Justice, C. O., Kilic, A., Kovalskyy, V., Lee, Z. P., Lymburner, L., Masek, J. G., McCorkel, J., Shuai, Y., Trezza, R., Vogelmann, J., Wynne, R. H., and Zhu, Z.: Landsat-8: Science and product vision for terrestrial global change research, Remote Sens. Environ., 145, 154–172, https://doi.org/10.1016/j.rse.2014.02.001, 2014.