the Creative Commons Attribution 4.0 License.
the Creative Commons Attribution 4.0 License.
 | 18 Dec 2018
Use of canopy coefficients obtained from satellite data to estimate evapotranspiration over high mountain Mediterranean watersheds
Elisabet Carpintero
María P. González-Dugo
Jorge Jódar
Sergio Martos-Rosillo
This work explores the dynamics of the water consumed by the vegetation in two Mediterranean watersheds of Sierra Nevada Mountains (Southern Spain). This region has experienced an increase in the demand of water in the last years due to the growth of irrigated areas, and a new water resources plan is required. The evapotranspiration (ET) of irrigated horticultural crops and natural communities were monitored for the hydrological years 2013/14 and 2014/15, using an approach based on the concept of reference evapotranspiration (ETo) and canopy coefficients derived from the computation of vegetation indices (VIs), which we will call the VI-ETo approach. A set of Landsat-8 and MODIS images has been used as remote input data. The results were used for the spatial analysis of water consumption in terms of the main land cover types in the area. The annual runoff obtained with a simple surface water balance, using the ET values estimated by the VI-ETo approach, was comparable to that obtained by the HBV (Hydrologiska Byrans Vattenbalansavdelning) model, a precipitation-runoff generation model that reproduces the observed river discharge at the outlet of the watershed.
- Article
(4336 KB) - Full-text XML
- BibTeX
- EndNote


The high mountain areas of Sierra Nevada (Southern Spain) have a great ecological value due to the presence of endemic ecosystems together with landscapes and cultural heritage, being protected by the status of Biosphere Reserve (1986) and National Park (1999). However, a considerable increase of irrigated areas has been observed in the region over the last few years, resulting in a rise in groundwater consumption, which in turns has an impact on the functioning regime of rivers and the water quality of the basins runoff. This led to the river basin authority to conduct a pilot study in order to improve the current knowledge of the hydrological behaviour of the high mountain area of Sierra Nevada. In this context, the dynamics of water consumption in the basin, including both irrigated horticultural crops and natural vegetation communities, should be continuously monitored to guarantee a sustainable management of water resources in this area.
Remote sensors provide distributed information about the status of vegetation. When this information is combined with meteorological data and integrated into models for estimating evapotranspiration (ET), it becomes a tool that allows a regular monitoring of water use at a regional scale. An extended approach in agricultural applications to estimate crop water requirements is the one proposed by Allen et al. (1998) FAO56 guidelines. It determines the actual ET using the concepts of crop coefficient and reference ET (ETo). There is an approach that combines this method with the spectral reflectance of vegetated surfaces, which is provided by remote sensors in the visible and near infrared regions through vegetation indices (VIs), hereunder called the VI-ETo approach (Campos et al., 2016; González-Dugo et al., 2009). As a result, the potential transpiration of the plant is determined in terms of a spatially-distributed basal crop coefficient.
The objective of this work is to estimate, on a regular and spatially distributed basis, the water consumption of the vegetation in two neighbouring high mountain watersheds of Sierra Nevada, for the hydrological years 2013/14 and 2014/15 by applying the VI-ETo approach. A water resources evaluation in the watersheds is conducted combining the VI-ETo approach with both, the results obtained from the hydrological HBV (Hydrologiska Byrans Vattenbalansavdelning) model (Bergström et al., 1976) and river runoff data measured in situ. Finally, the pattern of water consumption in terms of the main land cover types in the area is analyzed.
The study area is composed by the two adjacent watersheds of Bérchules and Mecina, located on the southern slopes of Sierra Nevada. The former one is located to the west and the latter to the east, with the intervening north-south water divide. Both watersheds are similar in size, shape, orientation, vegetation, soil and geological bedrock. The Bérchules watershed has an area of 68 km2, with an altitude which rises from 980 m a.s.l. at the outlet to about 2910 m at the highest point. The Mecina watershed is slightly smaller than Bérchules, it has an area of 55 km2 and presents an elevation ranging between 1042 and 2618 m a.s.l. In terms of land cover types, the study area is mainly characterized by natural vegetation of grassland, scrubs, conifers and oaks, followed by irrigated horticultural crops and rainfed fruit trees.
3.1 Remote sensing-based model
The VI-ETo approach is based on the concepts of ETo and the VIs derived crop/canopy coefficient (Kc). The former term, which takes into account the atmospheric demand, is calculated in this work with the Hargreaves equation (Hargreaves et al., 1985). The latter one, Kc, considers the effect of a specific canopy in relation to a given reference grass surface and was obtained using the dual method in the form popularized by FAO (Allen et al., 1998). It separates canopy transpiration from soil surface evaporation and compute evapotranspiration as follows:
being , where Kcb is the basal canopy coefficient and determines the vegetation transpiration, Ks is the water stress coefficient, that quantifies the reduction in transpiration due to soil water deficits, and Ke is the soil evaporation coefficient.
In this work, Kcb is derived from the canopy spectral response, provided by a set of satellite images. Numerous empirical relationships between VI-Kcb have been proposed for herbaceous and tree crops, (Consoli and Barbagallo, 2012; Odi-Lara et al., 2016) and natural canopies (Campos et al., 2013). The equation proposed by González-Dugo et al. (2009) to compute the basal crop coefficient from the SAVI index (Soil Adjusted Vegetation Index; Huete, 1988) is used here, and it can be expressed as:
where the subscripts max and min refer to the values of SAVI for a full ground vegetation coverage and bare soil, respectively. The ratio is an estimation of fc, and fc,max is the canopy ground-cover fraction (fc) at which Kcb is at its maximum (Kcb,max). Kcb,max is a canopy dependant parameter, with tabulated values taken from Allen et al. (1998). This equation has been validated with satisfactory results over a wide range of annual crops and fruit tree crops over the Mediterranean conditions of Southern Spain (González-Dugo et al., 2013; Mateos et al., 2013).
The soil evaporation coefficient Ke is obtained as:
Where Kr is a dimensionless evaporation reduction coefficient that depends on topsoil water depletion and Kc,max is the maximum value of Kc following a rainfall or irrigation event. The value of Ke cannot be higher than the product (), where few is the fraction of the soil surface that is both exposed and wetted (Allen et al., 1998).
The stress coefficient Ks is obtained on a daily basis by computing a soil water balance in the root zone. The daily root zone water deficit can be expressed as:
where the subscript i indicates a given day, RZWDi and RZWDi−1 are the root zone water deficit on days i and the previous one respectively, and R is rainfall or irrigation. When the root zone water content is at field capacity, the soil water content is maximum (RZWD =0), while this value is minimum at the wilting point. The depth of water between both extremes is named root zone water holding capacity (RZWHC). Equation (5) calculates the water stress coefficient Ks based on the relative root zone water deficit.
where p is the fraction of the RZWHC below which transpiration is reduced as a consequence of water deficit.
This simplified soil water balance does not take into account the lateral movement of the water which, under the conditions irrigated or little slope areas with scarce runoff, has a reduced impact. However, in areas with high steepness and low ground cover vegetation, as some part of this watershed, this simplification may increase the modelling error of ET. The limitations of the model under different conditions of steepness and ground fraction cover require further analysis.
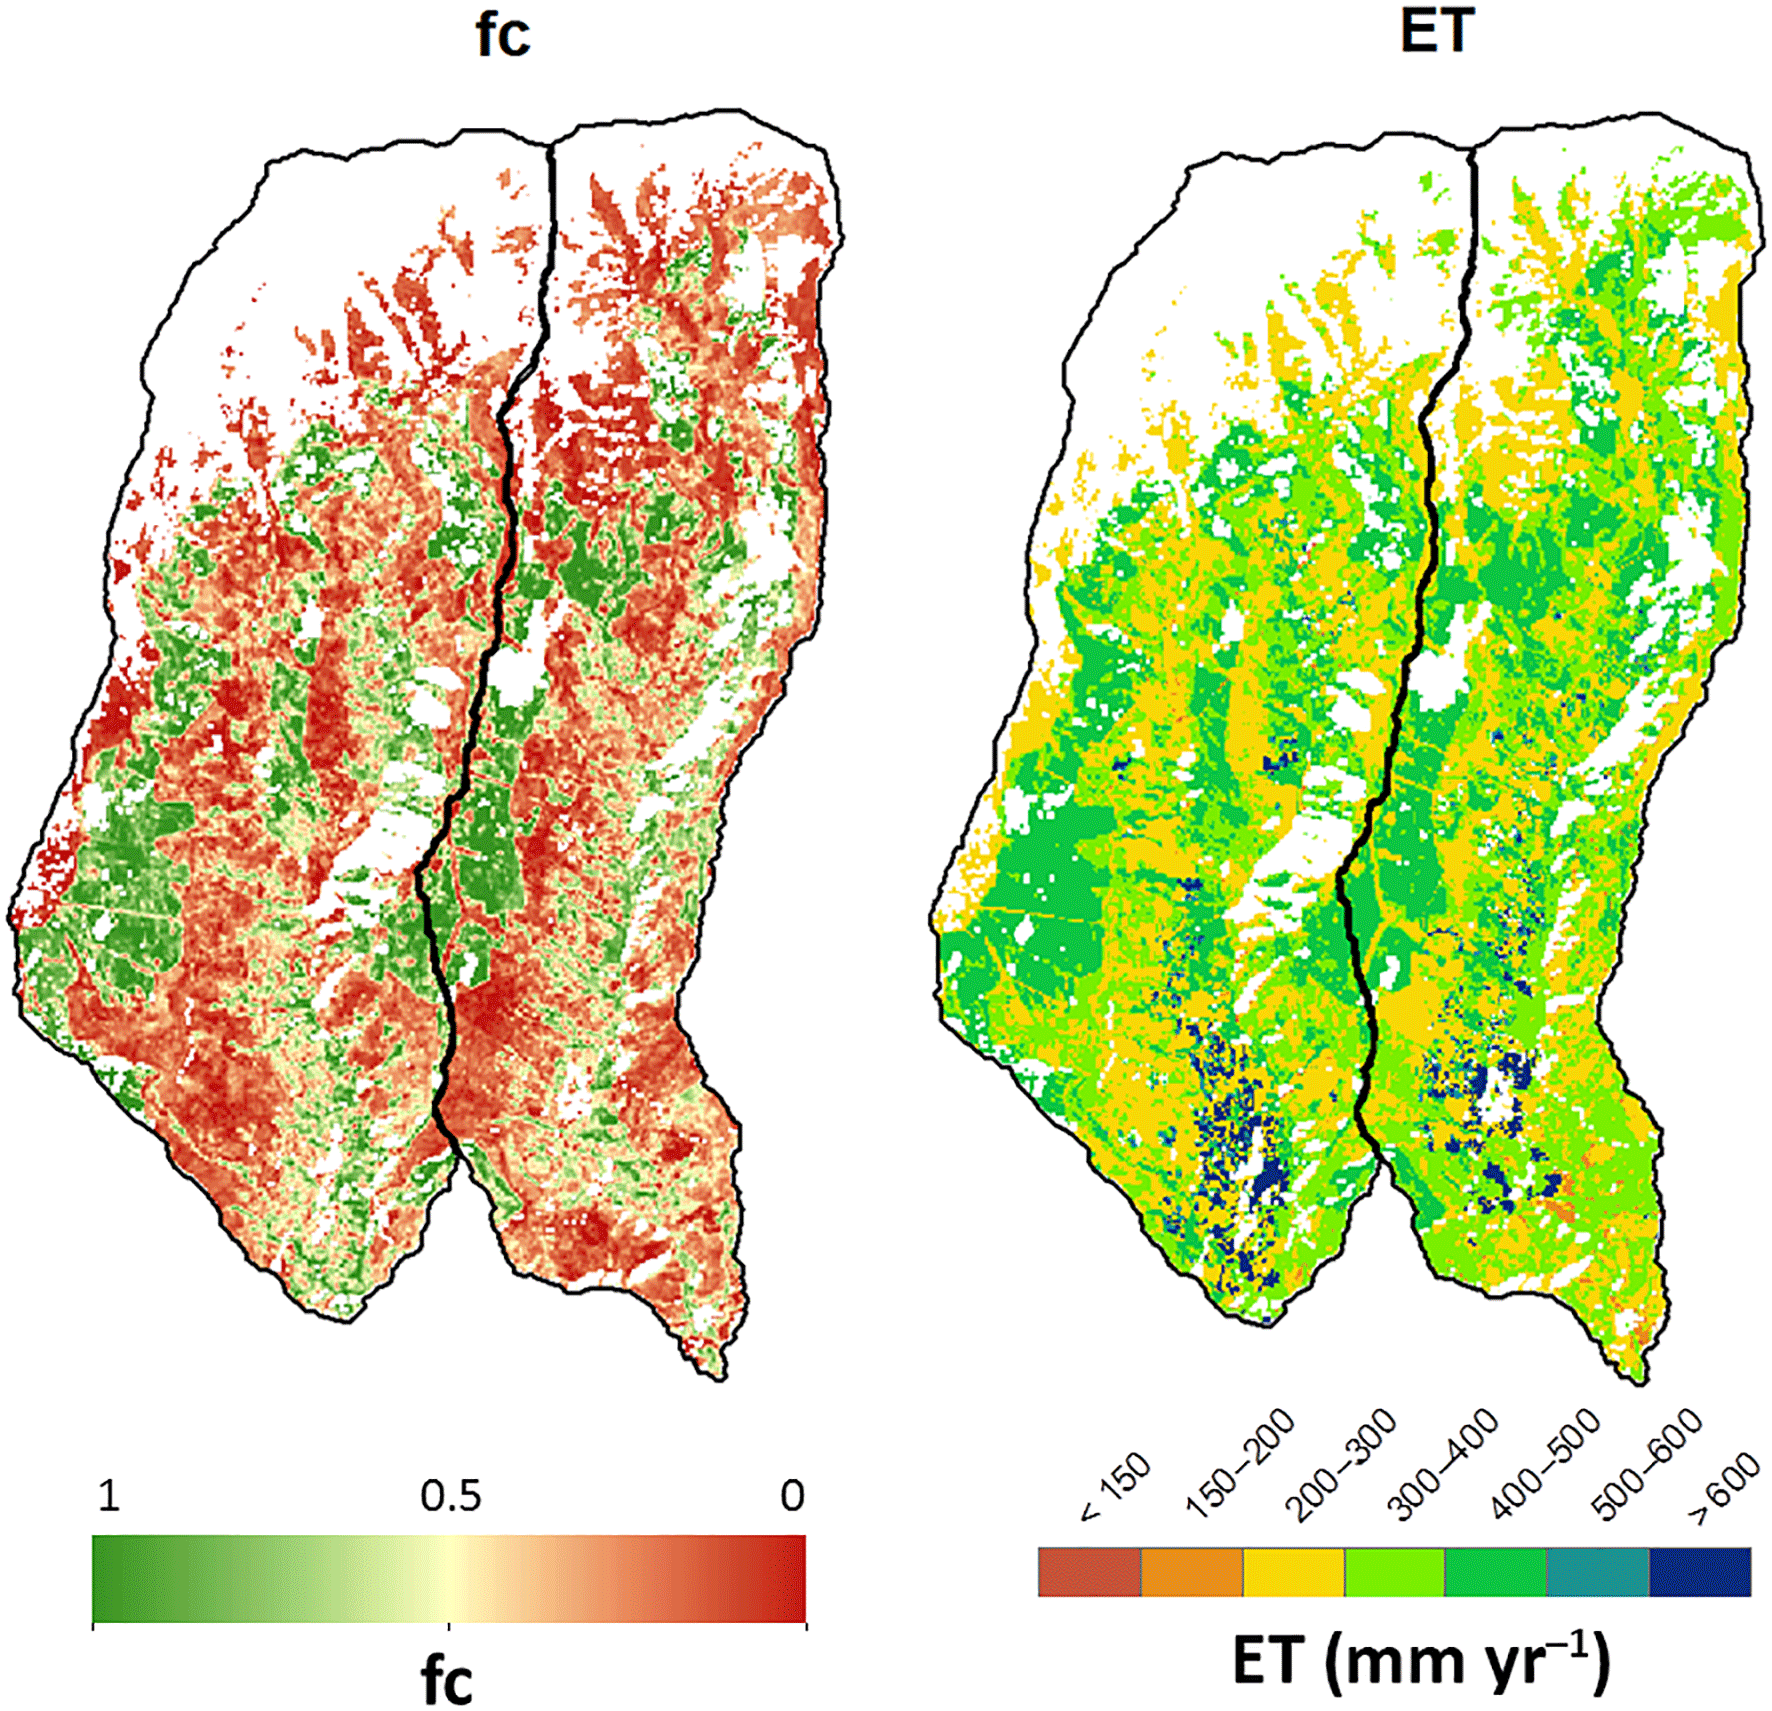
Figure 1Distributed average values of fc and annual estimated ET values for the hydrological year 2013/14.
The soil water balance computation was initiated in August 2013. The root zone water content was taken at field capacity on irrigated horticultural crops, while for the remaining vegetation types, the soil was considered dry and the root zone water deficit was assumed to be equal to the soil water holding capacity. It was established a standard irrigation schedule for the irrigated crops, based on common practices in the area. Irrigations every two days were applied by refilling the soil profile until reaching the field capacity during the irrigation season, from mid-May to mid-October. Selected values of parameters p and Kc,max for each land cover are described in Jódar et al. (2018).
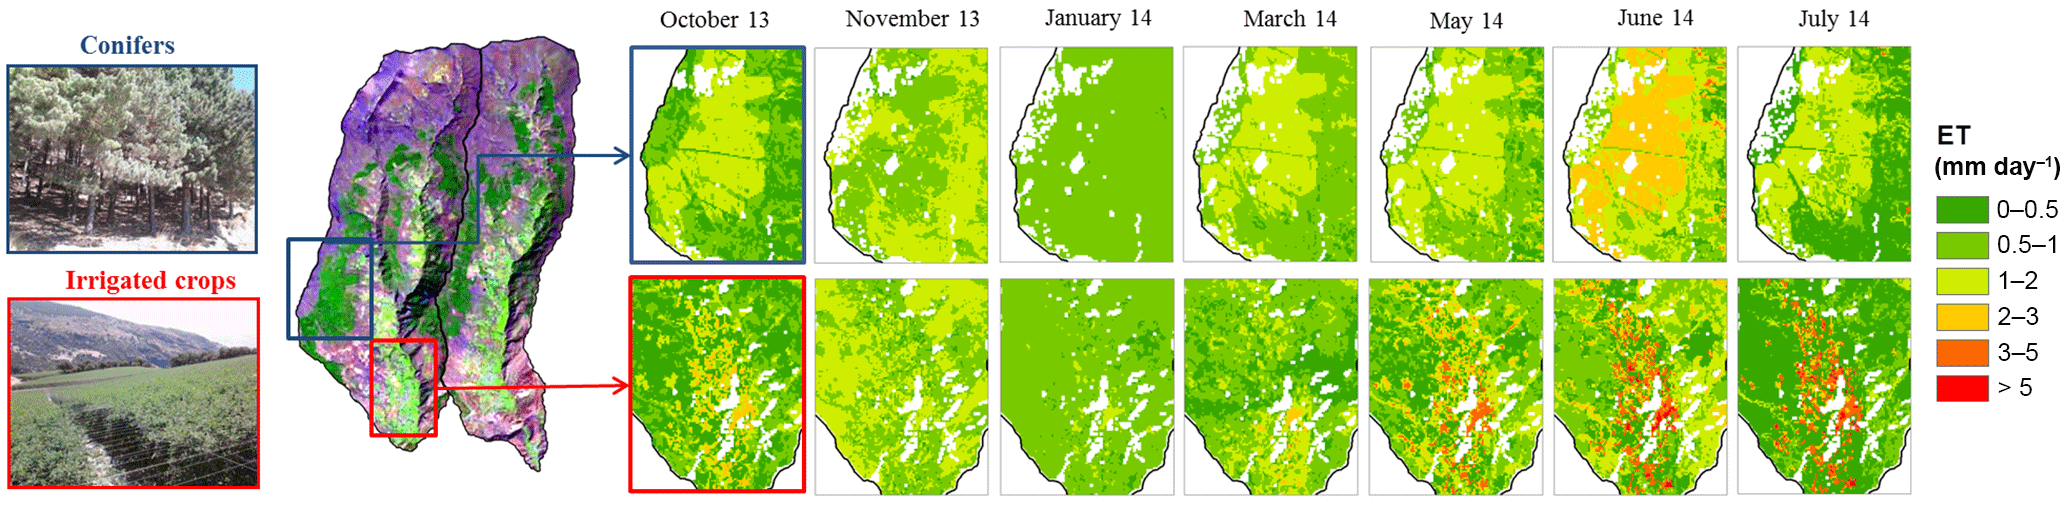
Figure 2Evolution of the distributed values of daily ET over areas with two representative vegetation: conifers (dark-blue line) and irrigated horticultural crops (line red) for Bérchules watershed.
3.2 Description of input data
A set of 26 cloud-free Landsat-8 images between August 2013 and October 2015 was selected and atmospherically corrected to obtain surface reflectance values. The optical bands correction was performed with the radiative transfer model Modtran4 (Berk et al., 1989), and using standardized parameters to characterize the state of the atmosphere at the acquisition time. Moreover, four MODIS images (product MOD09GQ) were added to complete the input data series. During the winter season, the low sun elevation angles produced that the steepest areas were not illuminated at sensor overpass time. These areas have been masked out during the image processing and their subsequent use. Daily meteorological data were provided by a network of automatic weather stations, including variables of rainfall, solar radiation, air temperature and humidity, and wind speed. The point data were spatially interpolated to obtain distributed information with the hydrological model WiMMed (Herrero et al., 2011) using the inverse distance IDW method, and taking into account the altitudinal factor.
The vegetation types have been obtained from the Information and Soil Uses System of Spain (SIOSE), which have been grouped into different classes with similar spectral response. For refining the identification of irrigated horticultural crops areas, satellite images and data provided by Environment and Water Agency of Andalusia (AMAYA) have also been used. Soil parameters (texture, water content at field capacity and wilting point, and soil depth) are provided by regional soil maps produced by the Agricultural Department of Andalusia at 250 m of spatial resolution (CAPMA, 2008).
3.3 Evaluation of water resources
Daily ET values were aggregated at annual and watershed scales, and a simple surface water balance was computed to estimate annual watershed runoff (Qrunoff) as follows:
where P is rainfall and I is rainfall interception by vegetation, which is assumed as 8 % of rainfall according to Polo et al. (2013). The annual runoff values obtained with the VI-ETo approach were compared with both, the observed runoff values at the Narila gauging station (located at the outlet of the Bérchules watershed) and the runoff values simulated by the HBV model. HBV is a conceptual rainfall-runoff model for catchment hydrology modeling. It is based on the general water balance and provides daily basin discharge by subjecting daily precipitation to four conceptual modules: a snow routine, a soil moisture routine, a response routine and a routing routine (Bergström et al., 1976).
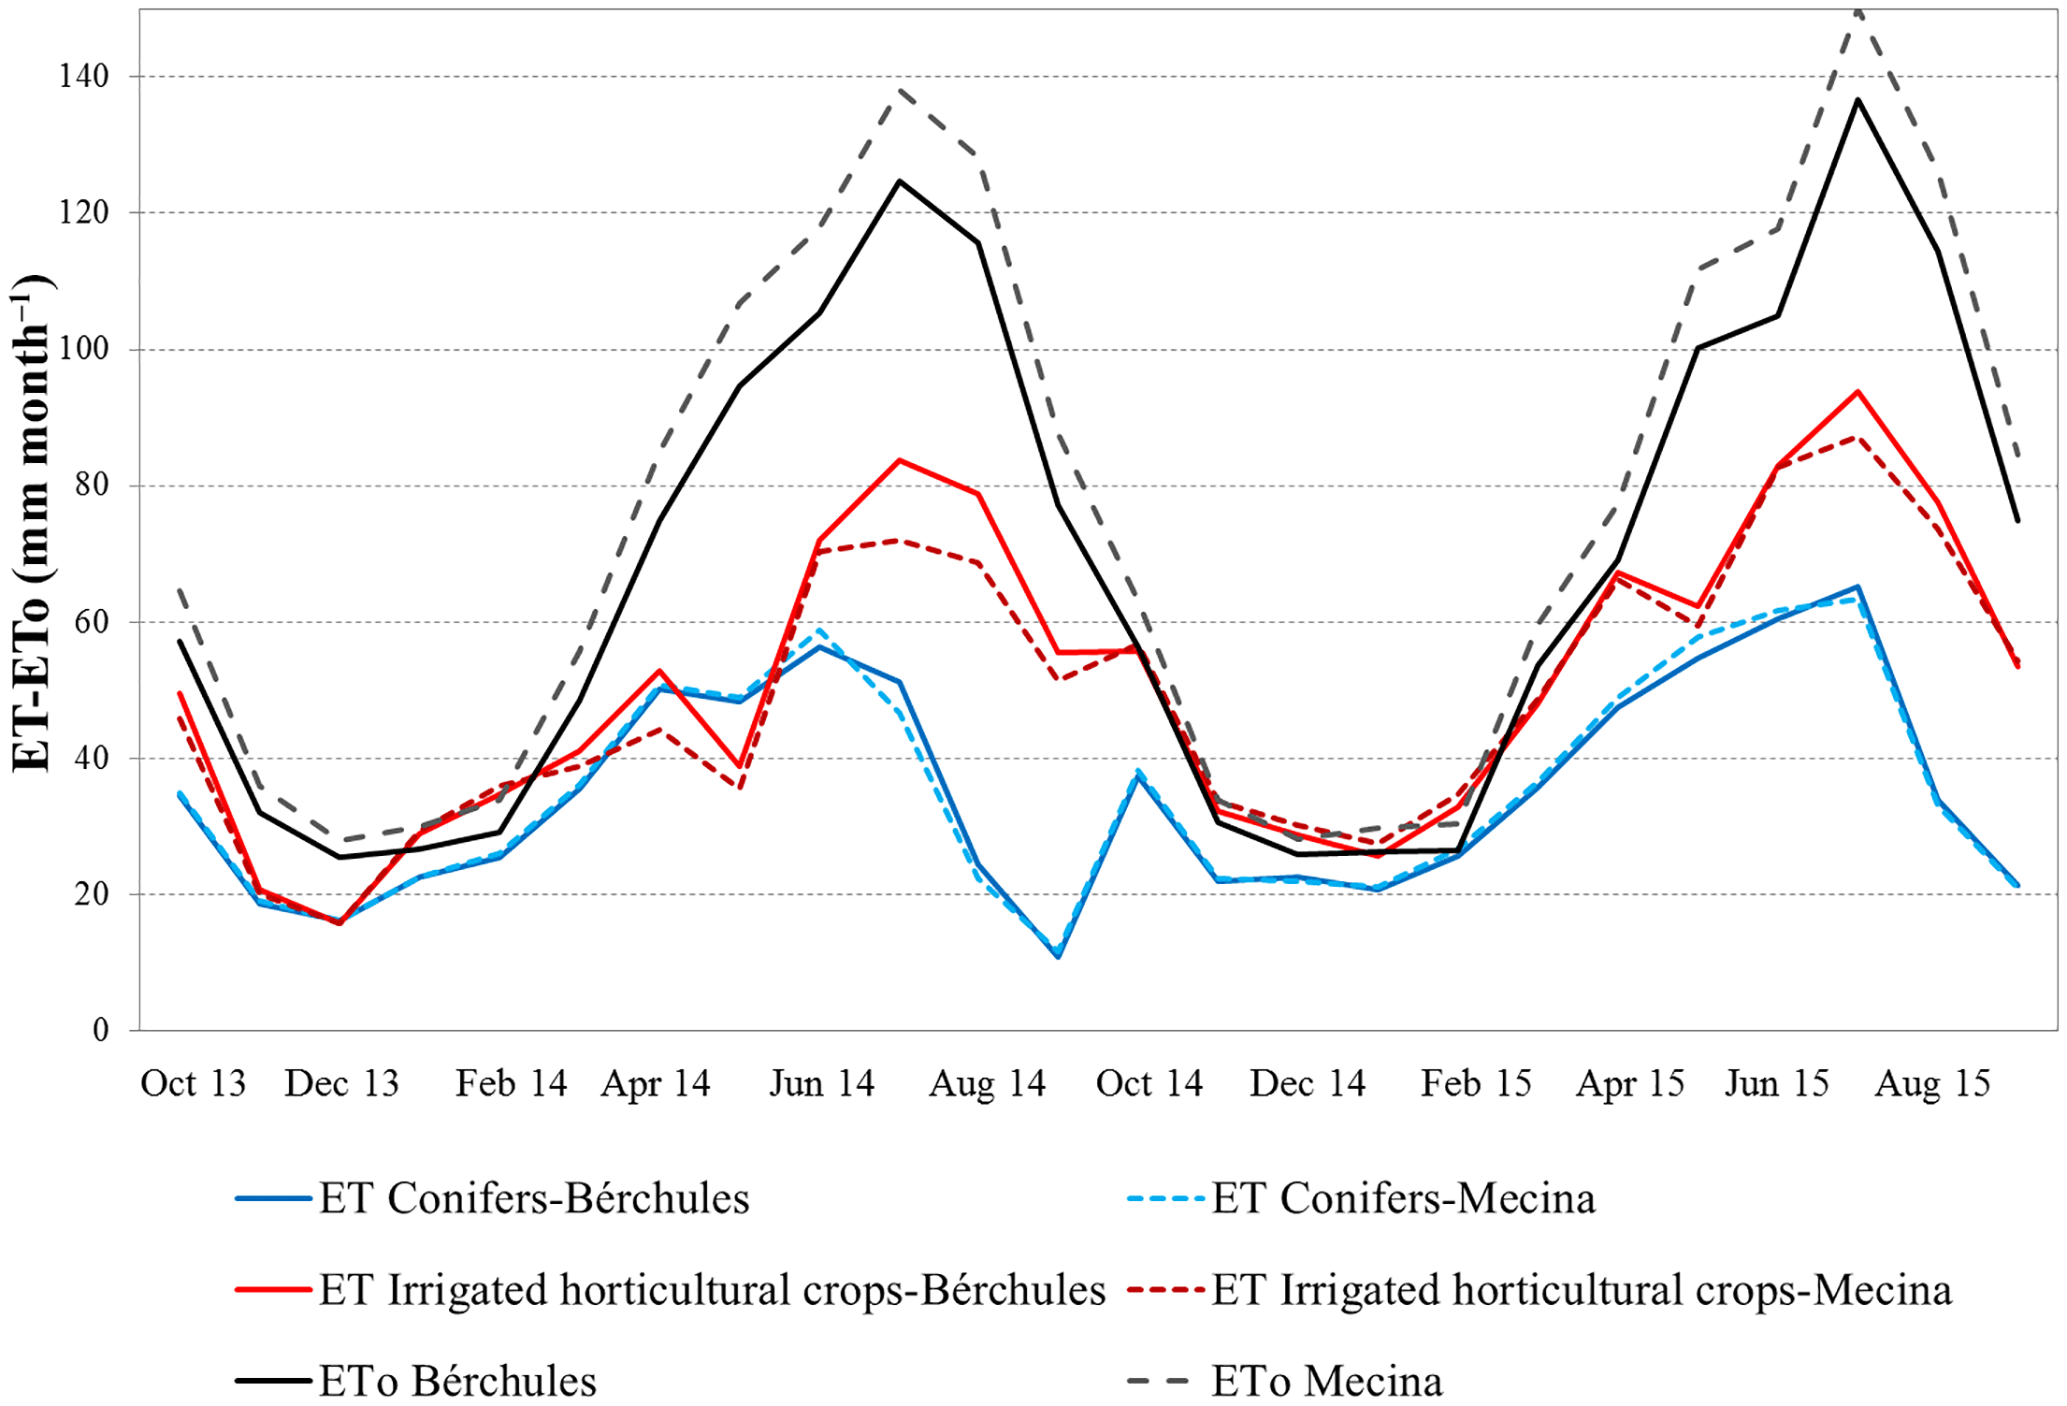
Figure 3Monthly ETo and estimated ET values of two representative canopies: conifers and irrigated horticultural crops for the Bérchules and the Mecina watersheds.
4.1 The VI-ETo model
One of the main variables required by this approach to compute the water consumption of the different canopies is the evolution of their vegetation ground cover fraction (fc), which keeps a linear relationship with the values of SAVI derived from the satellite images. Figure 1 shows the average fc values for both watersheds and the first hydrological year (2013/14). The lowest values can be found in the upper parts of the watersheds, corresponding to high mountain grasslands and scrubs. The conifers areas, located at the western sunny hillside of each watershed, present the higher and more stable fc values along the year. The irrigated horticultural crops are predominant in the South, with significant changes during the year.
Spatially distributed values of canopy water consumption were obtained at 30 m spatial resolution and on a daily time step, which were later aggregated to monthly and annual time steps. In Fig. 1, annual ET values are also shown for the hydrological year 2013/14. Average values estimated for the two hydrological years (2013/14 and 2014/15) were 353.5 mm in Bérchules and 352.2 mm in Mecina. These numbers support the assumption of a similar hydrological behaviour of both watersheds.
The annual runoff values obtained by the VI-ETo approach were 81.9 and 83.2 mm (year 2013/14 and 2014/15 respectively) for the Bérchules watershed, while for Mecina are 45.9 and 58.1 mm. There is a reasonable agreement between the simulated data obtained by both models (HBV and VI-ETo approach), with a RMSE value of 4.4 and 5.5 mm for Bérchules and Mecina, respectively. Moreover, the RMSE value obtained with the VI-ETo approach when comparing the observed and simulated data for the Bérchules watershed is of 4.5 mm. A more detailed description on HBV model application and comparison results discussion can be found in Jódar et al. (2018).
4.2 ET patterns of the main land cover types
Distributed daily ET values over areas with two representative vegetation types, conifers and irrigated horticultural crops, for some months of the year 2013/14 are shown in Fig. 2. These land covers present a particular interest as their surfaces in the area have experienced a significant increase in the last decades. Jiménez-Olivenza et al. (2015) quantified a 22.5 % of increase in the conifer area of Sierra Nevada since 1956 to 2011 and, even when a reduction in agricultural area around 12 % was reported by these authors, the river basin authority has observed in more recent years a clear rise of intensive horticulture. Both changes have significant implications on water consumption at the watershed scale. High daily water consumptions (>5 mm day−1) are estimated over the irrigated areas during the summer months (crop growth and irrigation season) as can be observed in Fig. 2. Likewise, conifers areas can be well identified with high ET values in June (2–3 mm day−1). The temporal evolution of monthly ETo and estimated actual ET of conifers and irrigated horticultural crops covers are depicted in Fig. 3.
Conifers present intra-annual changes in ET coupled with variations in the evaporative demand of the atmosphere, while maintaining quite regular vegetation coverage along the year. The ET evolution of irrigated horticultural crops follows a seasonal pattern, with a main annual peak around the middle of the summer (between 69 and 93 mm month−1), with crops starting their growing cycle in May and presenting quite low values during the end of autumn and winter.
In quantitative terms, the irrigated agriculture presents the highest values of water consumption (604.1 mm year−1 on average). However, the area of this land use represents about 4 % of the total area in both cases, leading to a small contribution (6–7 % on average) to the watershed total water use. On the other hand, conifer areas present a proportionally high contribution of 18.5 % to total ET with a higher coverage than horticultural crops (around 15 %) but lower annual consumption (422 mm year−1 on average). Considering that before 1956 the conifer area was almost null and the soil was occupied by grassland and scrubs (Jiménez-Olivenza et al., 2015) with a lower annual consumption of water, these results highlight the importance of considering not only agricultural uses when attending to the water management of these watersheds.
The VI-ETo approach has been used to estimate the spatio-temporal variation of ET in the Bérchules and the Mecina watersheds, using the vegetation indices derived from satellite images and other auxiliary information.
The analysis of water use patterns of the different land covers, in particular conifer and intensive horticulture, suggest that, even when the consumption of agricultural area is, on average, higher, the contribution of conifer and other forest uses to the total ET of the watershed is significant. The land use changes of these natural canopies in the last 60 years have had a quantitatively higher impact on total water consumption in the watershed than current increases in agricultural areas. A continuous monitoring of land uses changes and evapotranspiration using this procedure could be useful to assist future decisions leading to guarantee a sustainable management of water resources of this area.
This work is part of the project “Estudio de las cubiertas vegetales de la cabecera de los rios grande de bérchules y mecina aplicando técnicas de teledetección”, commissioned by D. G. de Planificación y Gestión del Dominio Público Hidráulico of Junta de Andalucía. Please, contact the authors if you are interested in this research data.
The authors EC and MPGD designed the application of the VI-ETo approach in the study area. EC carried out the application of the remote sensing-based model. JJ simulated the annual runoff values with the HBV model. SMR provided the observed data at the outlet of the watershed. All the authors contributed in the discussion of the results. Finally, EC and MPGD prepared the manuscript with the contributions of the rest of the authors.
The authors declare that they have no conflict of interest.
This article is part of the special issue “Earth Observation for Integrated Water and Basin Management: New possibilities and challenges for adaptation to a changing environment”. It is a result of The Remote Sensing & Hydrology Symposium, Cordoba, Spain, 8–10 May 2018.
The authors would like to recognize the funding supported by FPU program –
University Teachers Training – from Department of Education, Culture and
Sport. Additional support was provided by the National Agricultural and Food
Research and Technology Institute, INIA, and European Fund for Regional
Development 2014-2020 (Operative programme of smart growth) through project
RTA2014-00063-C04-02. The project ESTUDIO DE LAS CUBIERTAS VEGETALES DE LA
CABECERA DE LOS RIOS GRANDE DE BÉRCHULES Y MECINA APLICANDO TÉCNICAS DE
TELEDETECCIÓN (PP.PEI.IDF201401.9) funded by European Fund for Regional
Development (Operative programme of Andalucia 2007–2013) also provided
support.
Edited by: Guido D. Urso
Reviewed by: William Kustas and two anonymous referees
Allen, R. G., Pereira, L. S., Raes, D., and Smith, M.: Crop Evapotranspiration: Guidelines for Computing Crop Requirements, Irrigation and Drainage Paper No. 56, FAO, Roma (Italia), 1998.
Bergström, S.: Development and Application of a Conceptual Runoff Model For Scandinavian Catchments, SMHI, Report No. RHO 7, Norrköping, 1976.
Berk, A., Bernstein, L. S., and Robertson, D. C.: MODTRAN: a moderate resolution model for LOWTRAN7, GL-TR -89-0122, Air Force Geophys. Lab., Hanscom AFB, MA, 38 pp., 1989.
Campos, I., Villondre, J., Carrara, A., and Calera, A.: Remote sensing-based soil water balance to estimate Mediterranean holm oak savanna (dehesa) evapotranspiration under water stress conditions, J. Hydrol., 494, 1–9, 2013.
Campos, I., Balbontín, C., González-Piqueras, J., González-Dugo, M. P., Neale, C. M. U., and Calera, A.: Combining a water balance model with evapotranspiration measurements to estimate total available soil water in irrigated and rainfed vineyards, Agr. Water Manage., 165, 141–152, 2016.
Consejería de Agricultura y Pesca, Junta de Andalucía (CAPMA): Sistema de Inferencia Espacial de Propiedades Físico-Químicas e Hidráulicas de los Suelos de Andalucía (Informe Final), 2008.
Consoli, S. and Barbagallo, S.: Estimating water requirements of an irrigated mediterranean vineyard using a satellite-based approach, J. Irrig. Drain. E., 138, 896–904, 2012.
González-Dugo, M. P., Neale, C. M. U., Mateos, L., Kustas, W. P., Prueger, J. H., Anderson, M. C., and Li, F.: A comparison of operational remote sensing-based models for estimating crop evapotranspiration, Agr. Forest Meteorol., 149, 1843–1853, 2009.
González-Dugo, M. P., Escuin, S., Mateos, L., Cano, F., Cifuentes, V., Padilla, F. L. M., Tirado, J. L., Oyonarte, N., and Fernández, P.: Monitoring evapotranspiration of irrigated crops using crop coefficients derived from time series of satellite images. II. Application on basin scale, Agr. Water Manage., 125, 92–104, 2013.
Hargreaves, G. L., Hargreaves, G. H., and Riley, J. P.: Irrigation water requirements for Senegal river basin, J. Irrig. Drain. E., 111, 265–275, 1985.
Herrero, J., Millares, A., Aguilar, C., Díaz, A., Polo, M. J., and Losada, M. A.: WiMMed. Base Teórica, Grupo de Dinámica fluvial e Hidrología de la Universidad de Córdoba y Grupo de Dinámica de Flujos Ambientales de la Universidad de Granada, Spain, 2011.
Huete, A. R.: A soil-adjusted vegetation index (SAVI), Remote Sens. Environ., 25, 295–309, 1988.
Jiménez-Olivenza, Y., Porcel-Rodríguez, L., Caballero-Calvo, A., and Bonet, F. J.: Evolución de los usos del suelo en Sierra Nevada en los últimos 50 años y cambios del paisaje, La huella del Cambio Global en Sierra Nevada: Retos para la conservación, Consejería de Medio Ambiente y Ordenación del Territorio, Junta de Andalucía, 54–56, 2015.
Jódar, J., Carpintero, E., Martos-Rosillo, S., Ruiz-Constán, A., Marín-Lechado, C., Cabrera-Arrabal, J. A., Navarrete-Mazariegos, E., Gonzáles-Ramón, A., Lambán, L. J., Herrera, C., and González-Dugo, M. P.: Combination of lumped hydrological and remote-sensing models to evaluate water resources in a semi-arid high altitude ungauged watersehd of Sierra Nevada (Southern Spain), Sci. Total Environ., 625, 285–300, 2018.
Mateos, L., González-Dugo, M. P., Testi, L., and Villalobos, F. J.: Monitoring evapotranspiration of irrigated crops using crop coefficients derived from time series of satellite images. I. Method validation, Agr. Water Manage., 125, 81–91, 2013.
Odi-Lara, M., Campos, I, Neale, C. M. U., Ortega-Farías, S., Poblete-Echeverría, C., Balbontín, C., and Calera, A.: Estimating Evapotranspiration of an Apple Orchard Using a Remote Sensing-Based Soil Water Balance, Remote Sens., 8, 253, https://doi.org/10.3390/rs8030253, 2016.
Polo, M. J., Aguilar, C., Díaz-Gutiérrez, A., and González-Dugo, M. P.: Cuantificando la interceptación en cuencas heterogéneas: la cuenca del río Guadalfeo (Granada), Interceptación de la lluvia por la vegetación en España, Instituto Euromediterráneo del agua, 297–317, 2013.