the Creative Commons Attribution 4.0 License.
the Creative Commons Attribution 4.0 License.
 | 05 Jun 2018
Long-term changes in river system hydrology in Texas
Yiwen Zhang
Ralph Wurbs
Climate change and human actives are recognized as a topical issue that change long-term water budget, flow-frequency, and storage-frequency characteristics of different river systems. Texas is characterized by extreme hydrologic variability both spatially and temporally. Meanwhile, population and economic growth and accompanying water resources development projects have greatly impacted river flows throughout Texas. The relative effects of climate change, water resources development, water use, and other factors on long-term changes in river flow, reservoir storage, evaporation, water use, and other components of the water budgets of different river basins of Texas have been simulated in this research using the monthly version of the Water Rights Analysis Package (WRAP) modelling system with input databases sets from the Texas Commission on Environmental Quality (TCEQ) and Texas Water Development Board (TWDB). The results show that long-term changes are minimal from analysis monthly precipitation depths. Evaporation rates vary greatly seasonally and for much of the state appear to have a gradually upward trend. River/reservoir system water budgets and river flow characteristics have changed significantly during the past 75 years in response to water resources development and use.
- Article
(1063 KB) - Full-text XML
- BibTeX
- EndNote


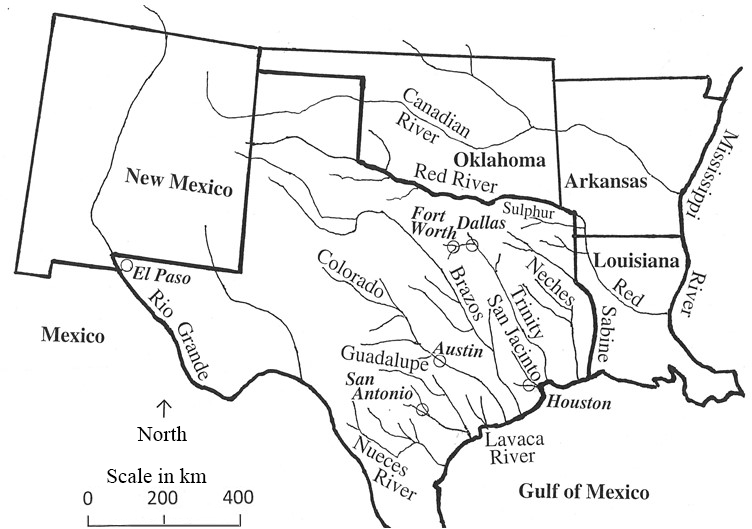
Texas is a large state located in the south-central United States that is representative of both the drier western and wetter eastern regions of the country. Climate, hydrology, geography, economic development, and water management vary dramatically across the 15 major river basins and 8 coastal basins of Texas shown in Fig. 1. The flows in Texas rivers are highly variable with daily, seasonal, and multiple-year fluctuations reflecting the extremes of floods and droughts as well as less severe variations. Mean annual precipitation ranges from 20 cm at El Paso on the Rio Grande in west Texas to 142 cm in the Sabine River Basin on the eastern border. The population of the state increased from 5.8 million people in 1930 to 25.4 million in 2010 and is projected to increase to 29.6 million in 2020, 46.3 million by 2060 and 51 million by 2070 which is nearly twice the population (25.4 million people) of the year 2010 (Texas Water Development Board, 2012).
Hydrology is extremely variable, subject to major floods and severe droughts along with seasonal and continuous fluctuations. The hydrologically most severe drought on record for much of the state began gradually in 1950 and ended in April 1957 with a major widespread flood event. Major droughts during the 1910s and 1930s were also extended by multiple-year dry periods over large areas. Droughts since the 1950s have been much costlier than the earlier droughts due to population and economic growth. More recent dry periods, for more than half of Texas, in 2011 experienced the smallest annual precipitation since the beginning of official precipitation records in 1895. On the other extreme, the year 2015 was one of the wettest on record throughout the year and included multiple major floods.
Many studies have investigated the impacts of land use changes, water resource management, and climate change on stream flow. Zhang and Schilling (2006) analysed the trend of increasing base flow in the Mississippi River attributed to land use changes. Reductions in the flow of the Wei River in China are attributable to a combination of multiple factors (Gao et al., 2013). Huang et al. (2015) and Gao et al. (2012) analysed flow regime changes resulting from constructing large dams on the Yangtze and Qingyi Rivers in China. This paper explores river flows and related quantities with a focus on the response mechanisms to climate change, water resource development, and other factors on long-term changes in hydrologic variables for the river systems of Texas (Wurbs and Zhang, 2014).
Databases maintained by the Texas Water Development Board (TWDB) contain the data of 1940–2014 monthly precipitation and 1954–2014 monthly reservoir evaporation rates that were used in studies at Texas A&M University (TAMU) to explore variability and past long-term trends (Wurbs and Zhang, 2014). The investigation included plots and statistical analyses of the precipitation and evaporation sequences for each of the 92 quadrangles. Plots of annual depth versus two-month maximum and two-month minimum depths precipitation for 1940–2014 and reservoir evaporation rates for 1954–2014 are presented in Figs. 2 and 3. The area-weighted 1940–2014 mean annual precipitation for the state is 709 mm, with individual quads varying from 295 mm in the extreme west increasing to 1430 mm in the southeast. The 1954–2014 state-wide mean annual reservoir evaporation rate is 1510 mm ranging from 1100 mm in east Texas to 1800 mm in the west. Tables 1 and 2 provide a summary of slopes from 1940–2014 annual precipitation, minimum two-month precipitation during each year, maximum two-month precipitation during each year. likewise, 1954–2014 trend analyses were performed for reservoir evaporation annual totals and annual two-month minima and maxima. As indicated in Table 1, a linear least squares regression line through the 75 years of annual state-wide precipitation depths has a slope of −0.0766 mm year−1 (−0.0108 % of 709 mm). The trend slopes for the total annual precipitation for the 92 individual quads are negative for 38 of the quads and positive for the other 54 and average −0.363 percent of their respective means (Zhang, 2014). The same analyses have been applied to monthly reservoir evaporation rates. The trend slope for state-wide evaporation implies an increase averaging 1.97 mm year−1 (Zhang, 2014). However, long-term changes possibly implied by these metrics are very small relative to the great continuous variability.
Table 1Statistics for mean statewide precipitation and evaporation.
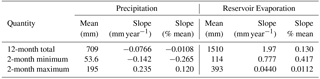
Table 2Statistics for mean statewide precipitation and evaporation.
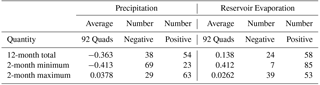
Figure 2Statewide annual mean (top plot), two-month maximum (middle plot), and two-month minimum (bottom plot) precipitation during each year of 1940–2014.
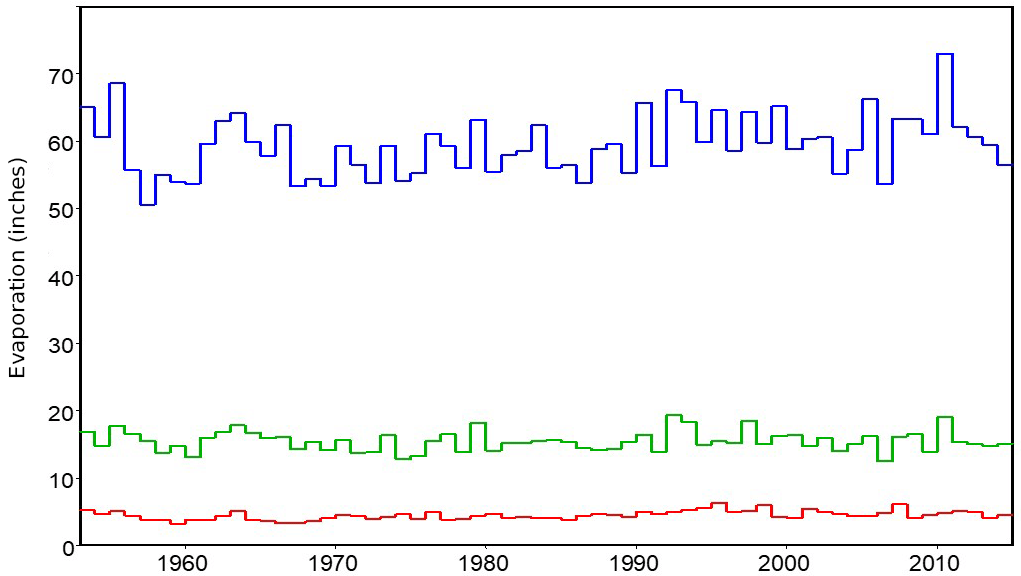
Figure 3Statewide annual mean (top plot), two-month maximum (middle plot), and two-month minimum (bottom plot) reservoir evaporation rates during each year of 1954–2014.
Wurbs and Zhang (2014) analysed observed flows at many selected U.S. Geological Survey (USGS) gauging stations on major rivers with records of at least 70 years. All sites exhibit drastic fluctuations including severe droughts and floods as well as continuous variability. The data were downloaded from the USGS NWIS website using HEC-DSSVue. Observed mean daily flows in cubic feet per second (cfs) at a gauging station on the Brazos River near Waco are plotted in Fig. 4 while annual volumes and annual minimum monthly flow are plotted in Fig. 5. The dataset consists of the 117 years from January 1899 through December 2015. The 42 782 flows from the dataset range from 0 to 158 000 cfs and have a mean and standard deviation (SD) of 2337 and 5835 cfs, respectively. The hydrographs at the Waco gauge on the Brazos River have presented the possibility that long-term changes in flow characteristics may differ significantly between daily and annual means. However, long-term changes in observed monthly and annual flows at most gauge sites appear to be relatively minimal.
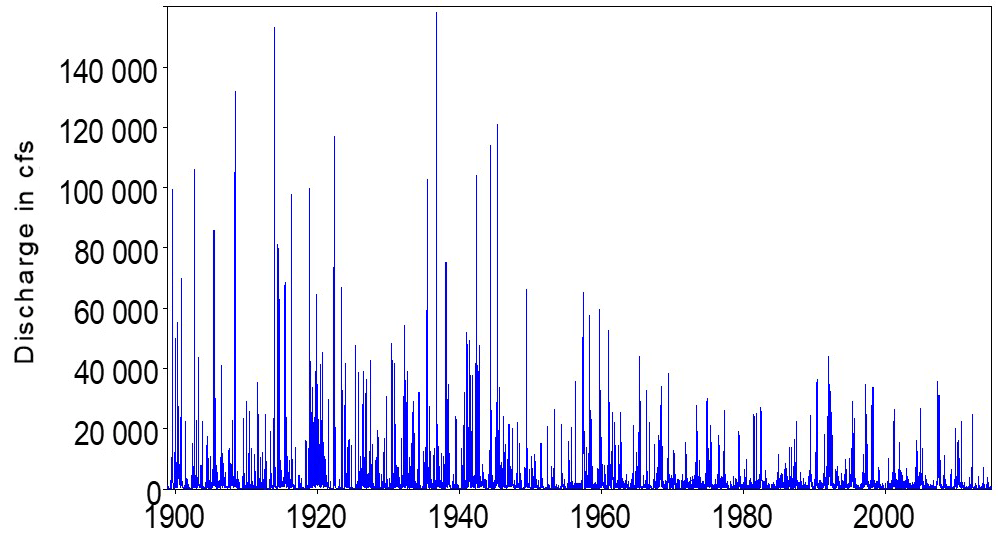
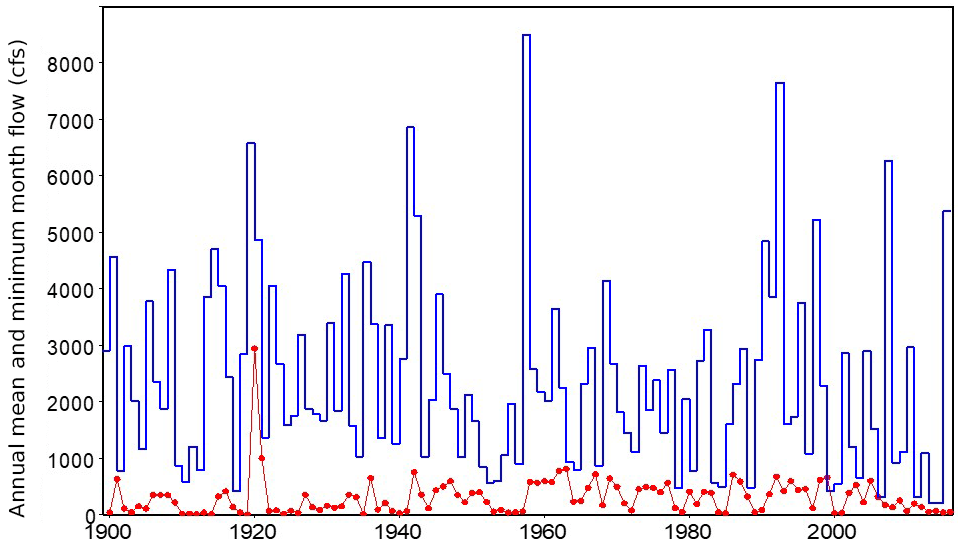
Figure 51899–2015 Annual Mean Flow (blue solid line) and Annual Minimum Monthly Flow (red dots) of the Brazos River at Richmond.
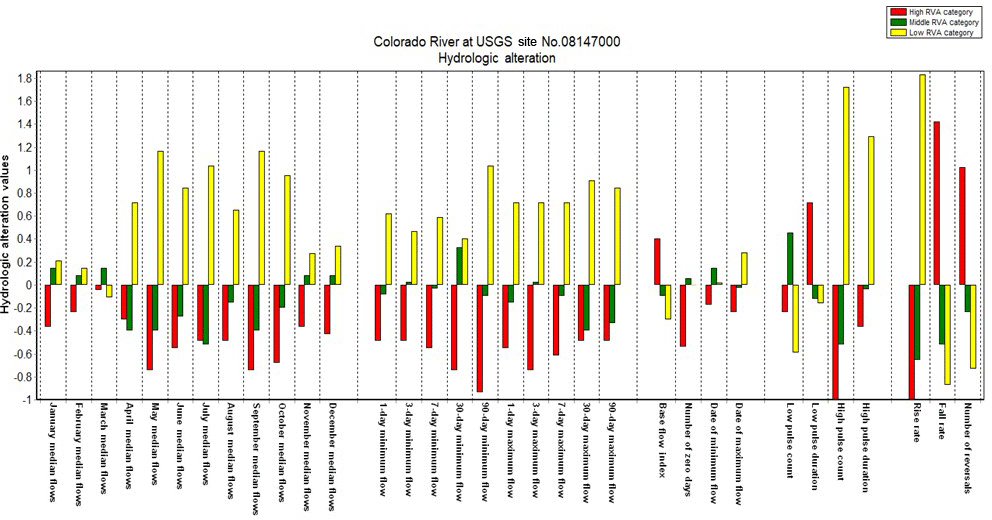
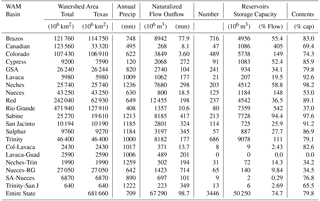
Table 4Frequency metrics for naturalized flows at basin outlets in m3 s−1.
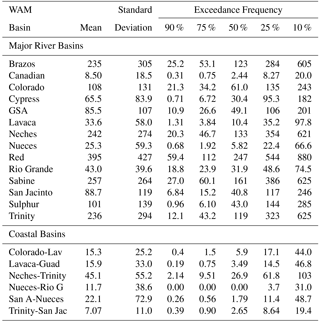
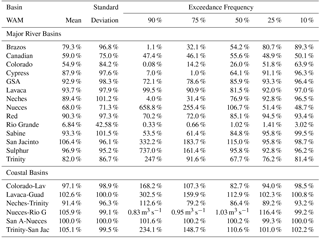
Table 5Frequency metrics for regulated flows at basin outlets as a percent of naturalized flows.
Comparative analyses of statistical metrics of observed gauged flows during historical periods prior to significant water resource development versus during more recent periods reflecting development are performed for daily flows at selected gauge sites. Indicators of Hydrologic Alteration (IAH) software, developed by The Nature Conservancy (TNC), calculate the characteristics of natural and altered hydrologic regimes by separating one period-of-record into two-time periods usually known as Pre-Impact and Post-Impact periods. All of the observed daily flows exhibit the great variability that characterizes stream flow throughout Texas. Long-term trends in river flow characteristics especially in high flows and low flows are very dependent on both location and the period-of-analysis adopted. Over the past several decades, long-term trends of decreases in high flows and increases of low flows have been evident at some gauges, due to construction and operation of reservoir projects. At a number of other sites both high flows and low flows have increased due to discharged return flows and increased rainfall runoff due to urbanization. Meanwhile, some sites exhibit no evident long-term changes at all.
Hydrologic Alteration (HA) factors are used in the RVA analyses in the IHA program. If the HA factor is positive, the frequency of values in the category (lowest third, middle third, highest third) has increased in the post-impact period; in contrast, if the HA factor is negative, it means that the frequency of values in the category has decreased in the post-impact period (Conservancy, 2009). Hydrologic Alteration factors at a gauging station on the Colorado River near San Saba are plotted in Fig. 6. The gauge located on the upper Colorado River near San Saba (5.2 mi downstream from San Saba River, 9.2 mi east of San Saba) has a daily recorded flow for the period from 1915 to present. The J. B. Thomas, E. V. Spence, and O. H. Ivie Reservoir are the three water suppliers in this upper Colorado River basin. The unimpacted period for this gauge is from 1915 to 1969, and the impacted period is from 1969 to 2017. The graph at this site illustrates the extreme variability characteristic of river flows throughout Texas on different periods. Figure 6 shows that the changes of runoff in the Colorado River near San Saba varies widely from month to month. The greatest Hydrologic Alteration (HA) factors were the increase in magnitude of baseflows, low-flow events, and monthly flows from April to October. Monthly flows from January to March are essentially unchanged for the impacted period. Although the magnitude and duration are similar, both 1-day, 7-day, 30-day, and 90-day minimum and maximum flow events tend to show a gradual decline of post-impact period.
The TCEQ WAMs combine historical natural river basin hydrology with specified scenarios of water resources development, allocation, management, and use. Hydrologic period-of-analysis sequences of naturalized, regulated, and unappropriated flows are generated (Wurbs, 2005, 2013, 2014). The approximately 200 major reservoirs in Texas with water supply storage capacities of at least 6.17 million m3 (5000 acre-feet) are all impounded by constructed dams. The WAMs datasets are available for simulation of the 3446 permitted reservoirs and other constructed water control facilities. The WAM System was applied to explore changes in river flows and the water budgets of the river basins. Simulation results include naturalized river flows that represent natural hydrology without human water development and use. Sequences of regulated flows in WAM are computed by altering homogenous naturalized flows to reflect a specified scenario of water resource development and use. Results reported by Wurbs and Zhang (2014) are summarized as the following: river basin characteristics are in Table 3 while frequency metrics for monthly naturalized flows are tabulated in 4 and 5.
The state-wide river basin characteristics information presented in Table 3 was developed by compiling information from the individual river basins derived from WAM simulation results. The long-term mean naturalized flow of 67.3 billion m3 represents the total of all stream flows under undeveloped conditions discharging into the Gulf of Mexico or across state borders under natural conditions. The estimated mean naturalized flow of 67.3 billion m3 is an annual volume equivalent to covering the state to a depth of 98.7 mm or 12.4 % of the mean annual precipitation of 709 mm year−1 falling on the state.
The frequency metrics in units of m3 s−1 are tabulated in Tables 4 and 5 and provide a comparison of river flows for current actual conditions of development versus natural undeveloped conditions. The impacts of development on river flows vary greatly between the river basins and also between different sites in the same river basin. The Brazos River Basin is used as an example for interpreting Tables 4 and 5. The mean and median (50 % exceedance) naturalized flows at the Brazos River outlet are 235 and 123 m3 s−1 (Table 4). The corresponding mean and median regulated flows are 210 and 8.7 m3 s−1, which are 79.3 and 54.2 % (Table 5) of the naturalized flows.
River basin hydrology in Texas, like elsewhere, is characterized by tremendous variability that includes continual short-term fluctuations, seasonality, and the extremes of severe multiple-year droughts and intense floods. Water resource development and management are governed largely by needs for dealing with the extremes of floods and droughts. Large volumes of reservoir storage are essential. Numerous reservoirs have been constructed in Texas, most since the 1940s, and are in operation today. Global warming has impacts on hydrology and population growth causing increased water use to be an important consideration in river system management over the past several decades.
The databases maintained by water agencies in Texas provide excellent opportunities to explore and facilitate an improved understanding of flow characteristics and long-term changes in flow characteristics. Long-term changes in precipitation during 1940–2014 are not evident, while reservoir evaporation rates in areas of Texas appear to have gradually increased over the past several decades. The IHA software program was to process daily hydrologic records to enable characterization of natural water conditions and facilitate evaluations of human-induced changes to flow regimes. Changes in flow characteristics exhibit dramatic fluctuations on all sites. Long-term trends of decreases in flows are evident at some gauges; increases are evident at others. Some exhibit both increases and decreases, and some sites exhibit no evident long-term changes. Analysis results are sensitive to the length of the period-of-analysis. Long-term changes in daily flows may differ greatly from changes in monthly and annual flows at the same site. Changes in low flow characteristics are very different than changes in flood flows. Compared with Climate Change, the impact contributed by human activity is relatively a greater influence on streamflow.
The WAM system provided water supply reliability and flow frequency metrics that are fundamental to water resources planning and administration of water rights permit system. The naturalized flow results from WAM exhibit essentially no long-term trends. Long-term changes in river system water budgets and flow characteristics are quantified by comparing WAM regulated versus naturalized flows. The comparative evaluations of simulation flow can be used to support effective water management between diverse types of human water users and various aspects of environmental requirements.
The monthly WRAP input datasets for all the river basins of the Texas are available at the TCEQ WAM website: https://www.tceq.texas.gov/permitting/water_rights/wr_technical-resources/wam.html (Texas Commission on Environmental Quality, 2015) observed stream flows from the USGS National Water Information System (http://waterdata.usgs.gov/tx/nwis/nwis, USGS National Water Information System, 2015).
The authors declare that they have no conflict of interest.
This article is part of the special issue “Innovative water resources management – understanding and
balancing interactions between humankind and nature”. It is a result of the 8th International
Water Resources Management Conference of ICWRS, Beijing, China, 13–15 June 2018.
Edited by: Dingzhi Peng
Reviewed by: two anonymous referees
Conservancy, N.: IHA Software Version 7.1 User's Manual, The Nature Conservancy, http://www.nature.org, 2009.
Gao, B., Yang, D., Zhao, T., and Yang, H.: Changes in the eco-flow metrics of the Upper Yangtze River from 1961 to 2008, J. Hydrology., 448–449, 30–38, 2012.
Gao, P., Geissen, V., Ritsema, C. J., Mu, X.-M., and Wang, F.: Impact of climate change and anthropogenic activities on stream flow and sediment discharge in the Wei River basin, China, J. Hydrol. Earth Syst. Sci., 17, 961–972, 2013.
Huang, F., Chen, Q., Li, F., Zhang, X., Chen, Y., Xia, Z., and Qiu, L.: Reservoir-induced changes in flow fluctuations at monthly and hourly scales: Case study of the Qingyi River, China, J. Hydrol. Eng., 20, https://doi.org/10.1061/(ASCE)HE.1943-5584.0001233, 2015.
Texas Water Development Board: Water for Texas 2012, Austin, TX, 2012.
Texas Commission on Environmental Quality: Water Availability Models, https://www.tceq.texas.gov/permitting/water_rights/wr_technical-resources/wam.html, last access: August 2015.
USGS National Water Information System: USGS Water Data for Texas, http://waterdata.usgs.gov/tx/nwis/nwis, last access: 31 December 2015.
Wurbs, R. A.: Texas water availability modeling system, J. Water Res. Pl., 131, 270–279, 2005.
Wurbs, R. A.: Water Rights Analysis Package (WRAP) Modeling System Reference Manual, Technical Report 255, Texas Water Resources Institute, 10th Edition, College Station, TX, 2013.
Wurbs, R. A.: Sustainable statewide water management in Texas, J. Water Res. Pl., 141, https://doi.org/10.1061/(ASCE)WR.1943-5452.0000499, 2014.
Wurbs, R. A. and Zhang, Y.: River System Hydrology in Texas, Technical Report 461, Texas Water Resources Institute, College Station, TX, 2014.
Zhang, Y.: Long-Term Changes in River System Water Budget in Texas, Master's thesis, Texas A & M University, available at: http://hdl.handle.net/1969.1/153334, 2014.
Zhang, Y. K. and Schilling, K. E.: Increasing streamflow and baseflow in Mississippi River since the 1940s: Effect of land use change, J. Hydrol., 324, 412–422, 2006.