the Creative Commons Attribution 4.0 License.
the Creative Commons Attribution 4.0 License.
 | 29 May 2018
Evaluation of sub daily satellite rainfall estimates through flash flood modelling in the Lower Middle Zambezi Basin
Thomas Matingo
Webster Gumindoga
Hodson Makurira
Flash floods are experienced almost annually in the ungauged Mbire District of the Middle Zambezi Basin. Studies related to hydrological modelling (rainfall-runoff) and flood forecasting require major inputs such as precipitation which, due to shortage of observed data, are increasingly using indirect methods for estimating precipitation. This study therefore evaluated performance of CMORPH and TRMM satellite rainfall estimates (SREs) for 30 min, 1 h, 3 h and daily intensities through hydrologic and flash flood modelling in the Lower Middle Zambezi Basin for the period 2013–2016. On a daily timestep, uncorrected CMORPH and TRMM show Probability of Detection (POD) of 61 and 59 %, respectively, when compared to rain gauge observations. The best performance using Correlation Coefficient (CC) was 70 and 60 % on daily timesteps for CMORPH and TRMM, respectively. The best RMSE for CMORPH was 0.81 % for 30 min timestep and for TRMM was 2, 11 % on 3 h timestep. For the year 2014 to 2015, the HEC-HMS (Hydrological Engineering Centre-Hydrological Modelling System) daily model calibration Nash Sutcliffe efficiency (NSE) for Musengezi sub catchment was 59 % whilst for Angwa it was 55 %. Angwa sub-catchment daily NSE results for the period 2015–2016 was 61 %. HEC-RAS flash flood modeling at 100, 50 and 25 year return periods for Angwa sub catchment, inundated 811 and 867 ha for TRMM rainfall simulated discharge at 3 h and daily timesteps, respectively. For CMORPH generated rainfall, the inundation was 818, 876, 890 and 891 ha at daily, 3 h, 1 h and 30 min timesteps. The 30 min time step for CMORPH effectively captures flash floods with the measure of agreement between simulated flood extent and ground control points of 69 %. For TRMM, the 3 h timestep effectively captures flash floods with coefficient of 67 %. The study therefore concludes that satellite products are most effective in capturing localized hydrological processes such as flash floods for sub-daily rainfall, because of improved spatial and temporal resolution.
- Article
(2669 KB) - Full-text XML
- BibTeX
- EndNote


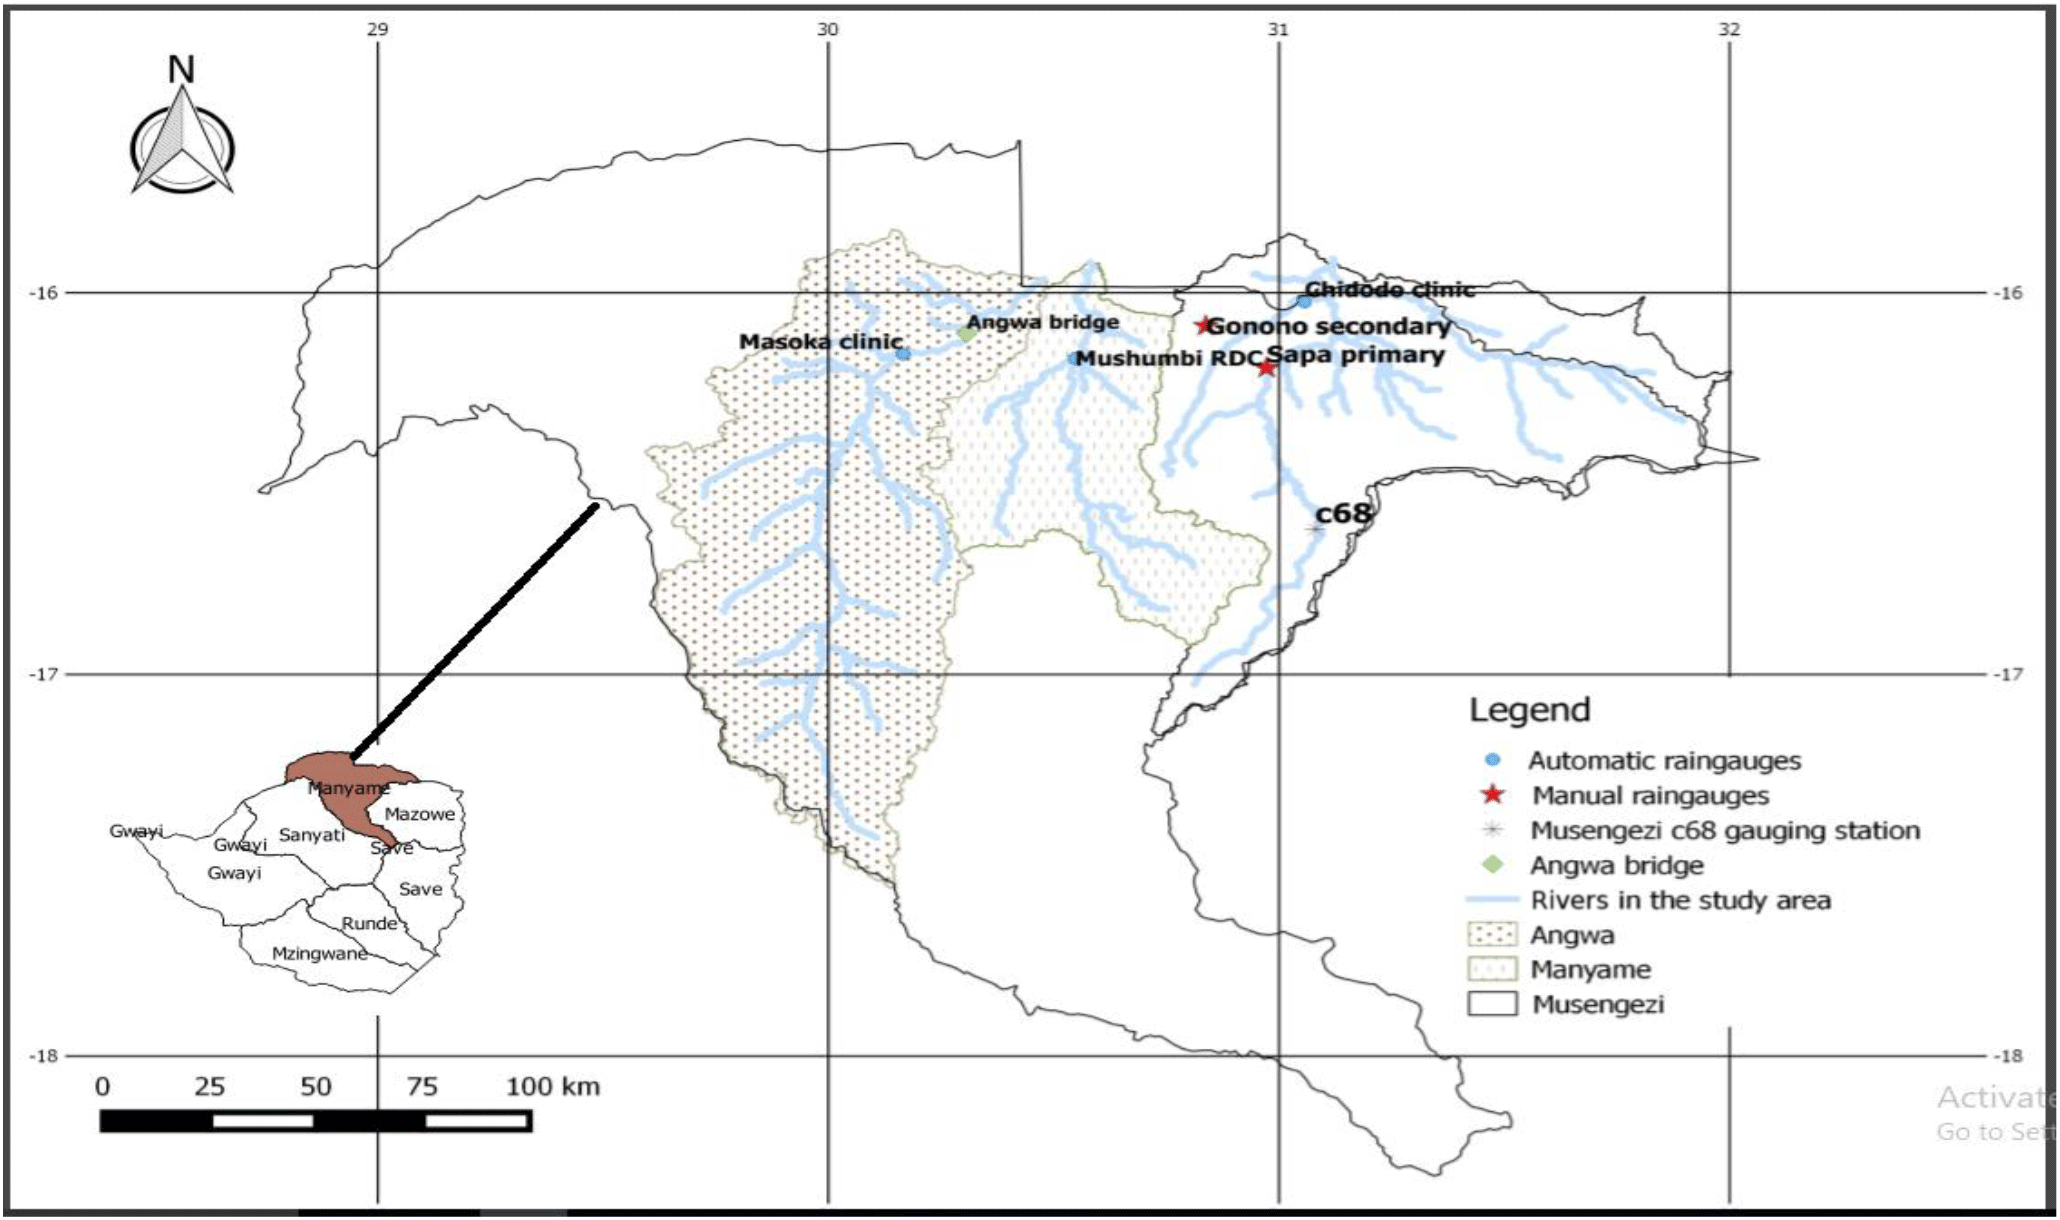
Figure 1The Mbire District in Lower Guruve showing manual and automatic rain gauge stations.
Accurate measurement of precipitation is key for dependable hydrologic predictions (Guo et al., 2015). Rain gauges are traditionally used to measure precipitation and have a drawback of reduced spatial coverage (Blacutt et al., 2015) thus rendering hydrological predictions inaccurate (Ning et al., 2016). it is impossible to place rain gauge stations at all places of interest. Therefore, satellite rainfall helps to augment the sparse rain gauges coverage (Maidment Ross et al., unpublished data, 2017). Nowadays satellite rainfall products such as Climate Prediction Centre Morphing technique (CMORPH), Tropical Rainfall Measuring Mission (TRMM) and Precipitation Estimation from Remotely Sensed Information using Artificial Neural Networks (PERSIANN) are produced at a spatial resolution of 8 km and temporal resolution of 3 h. Due to their indirect nature of measurements, satellite rainfall estimates (SREs) contain errors which can be divided into two groups; (i) systematic (bias) and (ii) random errors (Liu, 2015). As such, bias correction is needed before SREs are used with confidence in water resources applications. Previous studies in the Middle Zambezi Basin such as by Samuel Mwanangombe (unpublished data, 2015) only concentrated on highlighting the spatial aspects in SREs but ignored the temporal aspect in the hydrological outputs. Flash floods occur within a short period of time such that daily time scale used in previous studies may not be adequate to capture flash floods (Saber and Yilmaz, 2016). Floods are mostly localized. Besides the need for high spatial resolution to focus on floods, there is also need for temporal resolution such as sub daily time scales to capture the actual flood processes (Chen et al., 2016). By their improved spatial coverage and ability to provide rainfall estimates at recurrent time steps. SREs are suitable for basin-wide applications such capturing flash floods in cases where rain gauge measurements are not available. This is a welcome development in study sites such as Mbire District where there is limited spatial and temporal cover of automated recording rain gauges. The objective of this study was therefore to assess the performance of SREs at finer temporal resolutions and then applying the generated data in rainfall-runoff and flash flood modelling in the middle Zambezi Basin.
The study area covers 3 sub-catchments of Manyame cutting through the Mbire District of Zimbabwe, namely, Angwa, Lower Manyame and Musengezi. Mbire District lies between 30.60 and 31.20∘ E and 15.60 and 16.40∘ S. The estimated area of Mbire District is approximately 4700 km2 and is characterized mainly by the floodplains of the Zambezi River Basin. The altitude is approximately 400 m above sea level and being drained by the Angwa, Manyame, Musengezi and Kadzi rivers (Fig. 1). Mbire District receives low rainfall of below 600 mm and lies in agro ecological region IV of Zimbabwe (Bola et al., 2014). The district records high temperatures (sometimes exceeding 40 ∘C) with mean annual temperature of 25 ∘C, Mbire District lies on sedimentary geological foundations of lime and sandstone formations. Varied soils rich in sodium exist though lacking in organic matter. Mbire District experiences frequent localised flooding (CPU, unpublished data, 2015). Backflow from the downstream Cahora Bassa Dam and rainfall events from the large upstream catchment are the two main factors that contribute to flooding (Bola et al., 2014). Angwa, Manyame, Musengezi sub-basins have been selected since these are the major rivers in the area and greatly contribute to flooding (Bola et al., 2014).
3.1 Gauge based rainfall data
Rainfall for November 2015 to December 2016 with temporal resolution of 30 min was acquired from three automatic weather stations located at Chidodo, Masoka and Mushumbi. The 30 min data was aggregated to 1 h, 3 h and daily timestep. Before 2015, there was no sub-daily rainfall data available from rain gauges. The automatic rain gauges were installed in October 2015 and these provide sub daily temporal resolution rainfall data. One year of observations would not lead to convincing conclusions hence the need to lengthen the period of analysis using the “Hydrognomon” software (Kozanis et al., 2005). The daily time series for 2013 to October 2015 was disaggregated to lengthen the comparison time series.
3.2 Satellite rainfall download and processing
TRMM and CMORPH rainfall data were downloaded using ILWIS 3.7.2 software through the GeoNETCAST ISOD toolbox. The point to pixel method was used for comparison of gauge rainfall and satellite rainfall. A maplist was created and crossed to the rain gauge stations point map to extract satellite rainfall values.
The rain gauge stations point map was used to extract satellite rainfall values from the grid CMORPH and TRMM rainfall.
3.3 Performance evaluation of satellite products through standard statistics
CMORPH and TRMM Satellite rainfall for 2013 to 2015 were compared with rain gauge data by means of detection statistics and standard statistical analysis. The detection statistics and statistical analysis used are POD, RMSE, CC and Rbias using the following equations:
Where H = hit bias, M = miss bias, F = false bias, FAR = false alarm ratio, POD = probability of detection, CSI = critical success index, FBIAS = frequency bias, Ps = satellite rainfall estimates (mm day−1), Pms = mean values of SRE (mm day−1), Pr = rain gauge rainfall (mm day−1), Pmr = mean values of rain gauge rainfall (mm day−1), N = sample size in days.
3.4 Bias correction of satellite rainfall
For correcting the satellite rainfall, a correction factor (BFstb) was calculated using Eq. (8). The multiplicative bias factor corrects for the spatial and temporal aspects of the error in satellite rainfall (Bhatti et al., 2016; Habib et al., 2014; Gumindoga et al., 2016a).
Where G and S = daily gauge and satellite rainfall estimates, respectively (mm), i = gauge location, t = julian day number (day), l = length of a time window for bias calculation (days), n = the total number of gauges within the entire domain of the study, T = full duration of the study period.
3.5 HEC HMS model setup
3.5.1 Land surface parameterization
A Shuttle Radar Topography Mission (SRTM) Digital Elevation Model (DEM) at 90 m resolution was obtained from the following website: http://srtm.csi.cgiar.org/. The DEM was imported in ILWIS for DEM hydro processing. Catchment merging was conducted to derive the 3 sub-catchments. The catchment maps were exported from ILWIS as ESRI shapefiles together with the river shapefiles after which a basin model was created in HEC-HMS (Abushandi and Merkel, 2013; Gumindoga et al., 2016b; Narayan and Gautam, 2015). The deficit and constant loss method and the SCS unit Hydrograph Transformation methods were used for the component (Bhuiyan et al., 2017). The Muskingum method was used for reach routing.
3.5.2 Model calibration, validation and model efficiency assessment
The HEC HMS 3.5 model was manually calibrated for daily timestep simulation with Angwa and Musengezi catchments flow dataset for the period 1 October 2014 to 30 September 2015. The calibrated parameters were time lag and percentage impervious (Gumindoga et al., 2016b). Simulated runoff was compared with the measured runoff for Angwa and Musengezi catchments. The performance indicators used to assess the model differences between observed and simulated were the Nash-Sutcliffe efficiency (NSE) and Relative Volume Error (RVE). For validation of the model, one hydrological year; October 2015 to September 2016 was used. All the parameters obtained during model calibration were maintained but the hydro-meteorological series were changed.
3.5.3 Runoff simulation for different timesteps
The loss and transformation parameters for the calibrated daily timestep were transferred to 30 min, 1 h and 3 h timesteps. To check the performance for these timesteps; total volume, time of peak and peak discharge were compared to the standard daily time step gauge.
3.6 HECRAS flash flood modelling
The Angwa sub-catchment 30 m SRTM DEM was used to create a TIN in HEC-GeoRAS. Geometric data relating to centreline, cross section lines, river banks and flow path from ArcView was exported to HECRAS to generate water surface profiles and flood way boundaries. Discharge for different timesteps from HEC-HMS was used to evaluate the performance. For each discharge, standard deviation and the mean were calculated using the Gumbel method for 100, 50 and 25 year flood events. The measure of agreement was calculated using Cohen Kappa in SPSS package for the validation of the flood simulation.
4.1 Evaluation of satellite rainfall product
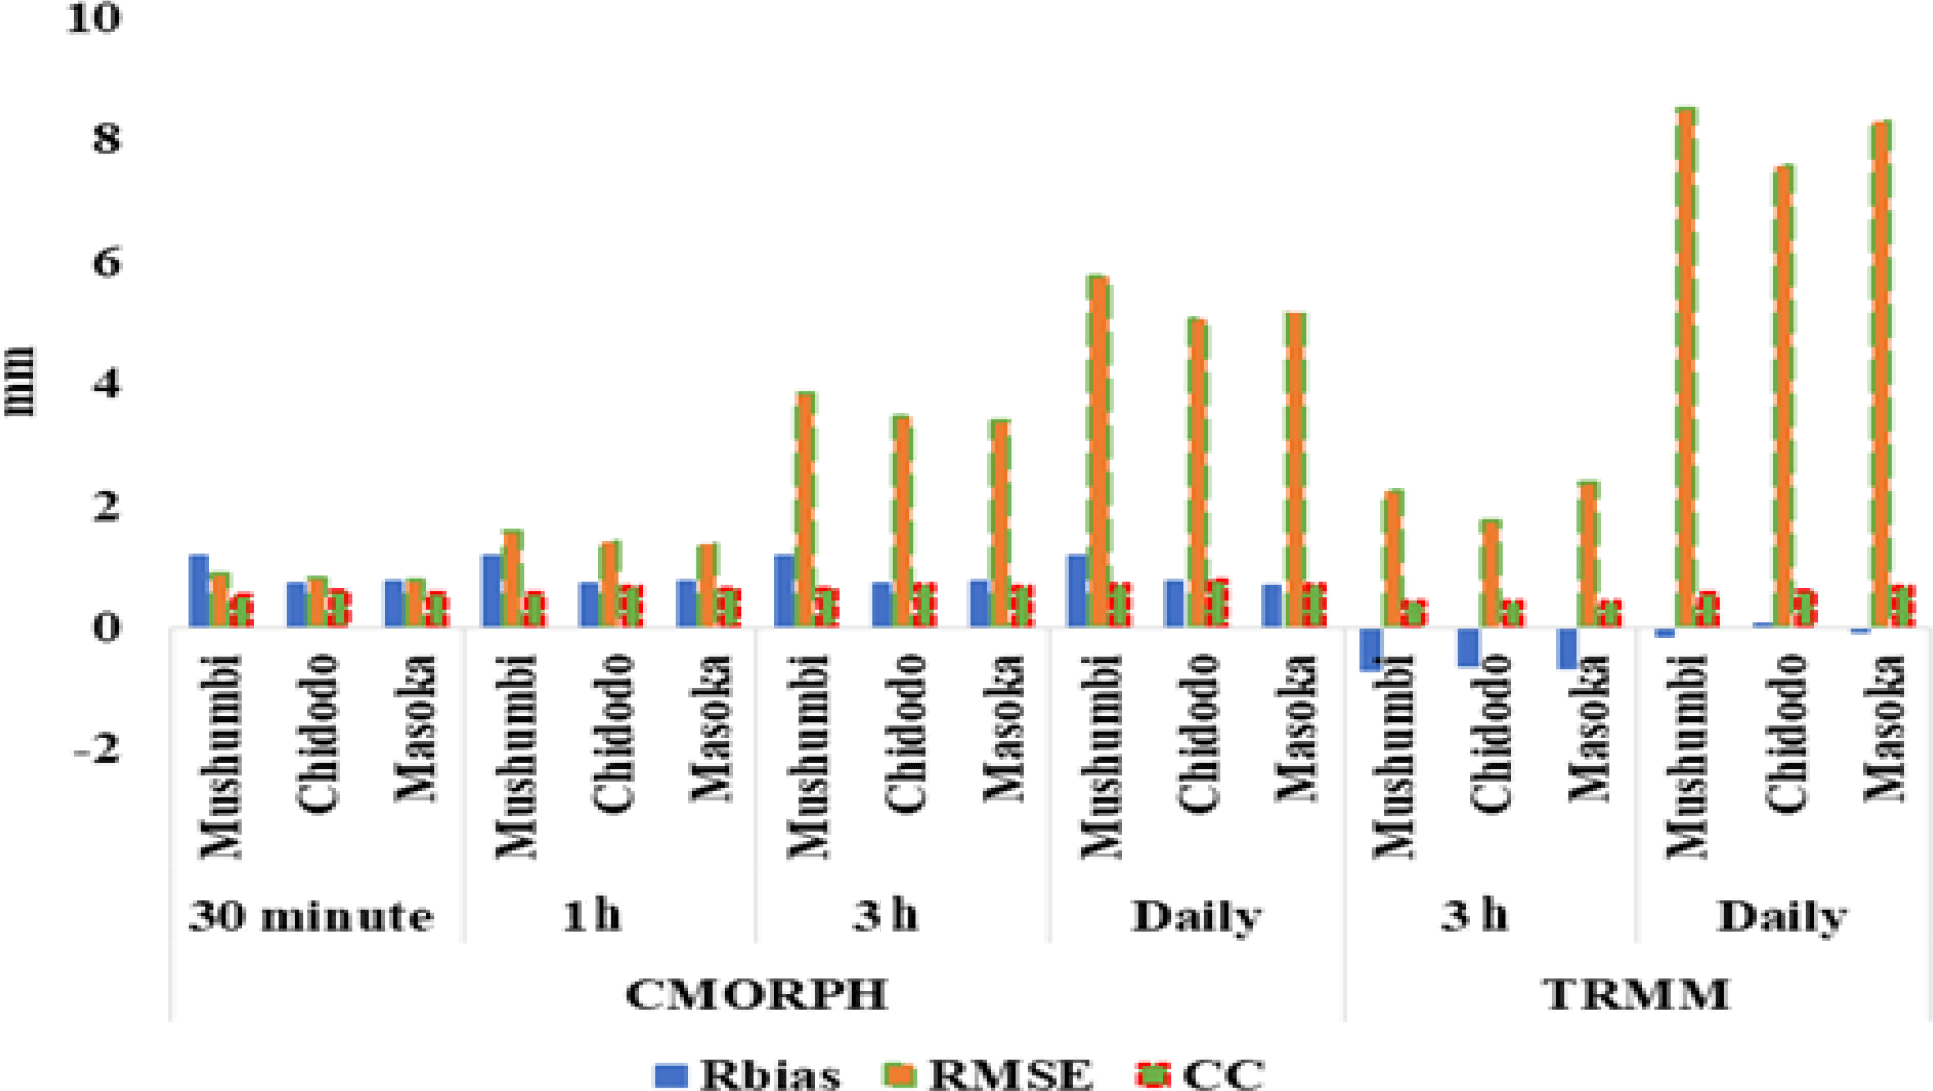
Figure 2 shows standard statistics error at different timesteps. The Correlation Coefficient (CC) for TRMM and CMORPH decreases with decreasing timestep. Shen et al. (2010) evaluated performance of TRMM and CMORPH in China at different timescales such as daily, 12, 6, 3 h and found out that CC increases with increase in timestep which is similar to the finding of this study. POD for all satellite products decreases with decrease in timestep such as from daily to 3 h. CMORPH decreases from 0.61 to 0.5 whilst TRMM from 0.59 to 0.31. FBI was smaller than one for TRMM satellite product meaning that it have a tendency of underestimating rainfall whilst CMORPH; FBI was 2.02 which shows a tendency of overestimation which is in agreement with results by Yang and Luo (2014) who found FBI of 4.6 and also a study in the Zambezi Basin by Cohen Liechti et al. (2012) who found FBI of 2.9 at daily timesteps.
4.2 Bias correction results
After bias correction, the RMSE reduced by 12 % and Rbias by 33 % on daily time step. This finding of reduction of RMSE after bias correction application tallies with the findings by Gumindoga et al. (2016a), who reduced RMSE by 11 % with similar bias correction on a daily timestep in the Zambezi River Basin. The effect of reducing RMSE after application of bias correction was also found by Bhatti et al. (2016) who decreased RMSE by 7 % on daily timestep in the Gilgel Abbey catchment.
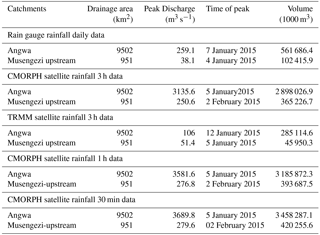
Table 1Characteristics of catchments acquired from the model basing on different timestep for both satellite rainfall products for October 2014 to September 2015.
4.3 HEC-HMS calibration and validation with rain gauge rainfall
The calibration results for Angwa and Musengezi upstream for the period of October 2014 to September 2015 are shown in Fig. 3. The Nash Sutcliffe (NSE) was 55 % and Relative Volume Error (RVE) was −9.4 % which is within acceptable range of −10 and 10 % (Janssen and Heuberger, 1995). The negative sign shows that the model underestimated runoff. This can be attributed to the assumption made that ignored the contribution of base flow in the calibration of the model. For Musengezi upstream, the NSE was 58 % which shows that the model reproduced the observed patterns fairly well. The relative volume error was −7.7 %. The RVE differs from Gumindoga et al. (2016b) in the same basin which was −1.54 %.
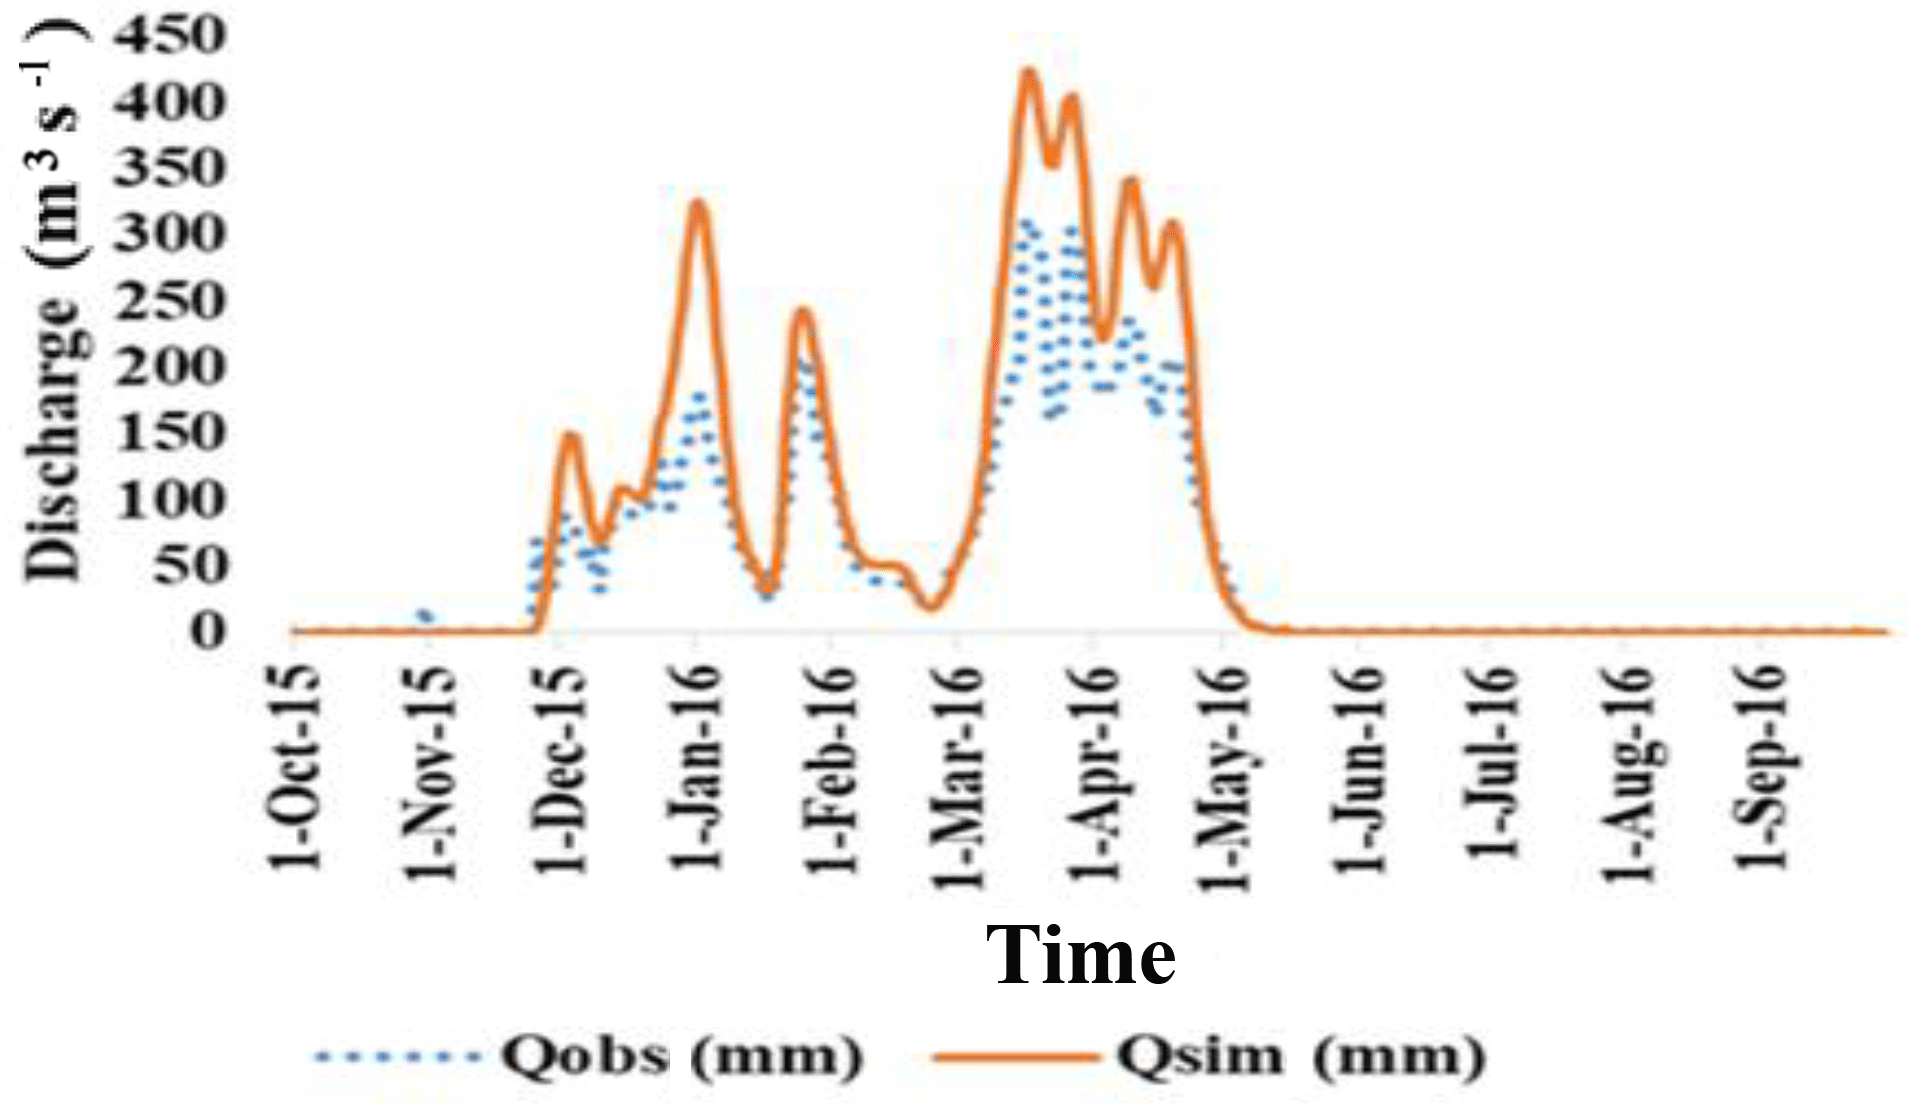
Model validation for the period of October 2015 to September 2016 was carried out successfully for Angwa River with a NSE of 61 % which is within the accepted range. However, the RVE obtained of 42 % is outside the acceptable range. Figure 4 shows the hydrograph for validation.
4.4 HEC-HMS model simulation with SREs at different timesteps
Table 1 was acquired as an output from the HEC-HMS model and it shows that peak discharge increases with decrease in timestep. This finding is consistent with results from Bruce Mcenroe (unpublished data, 2010) which showed that simulated runoff increases with a decrease in timesteps considered. This shows that coarser timesteps do not necessarily imply higher peaks. A finer timestep might record some of the maximum rainfall amounts that might actually be missed by a coarser timestep.
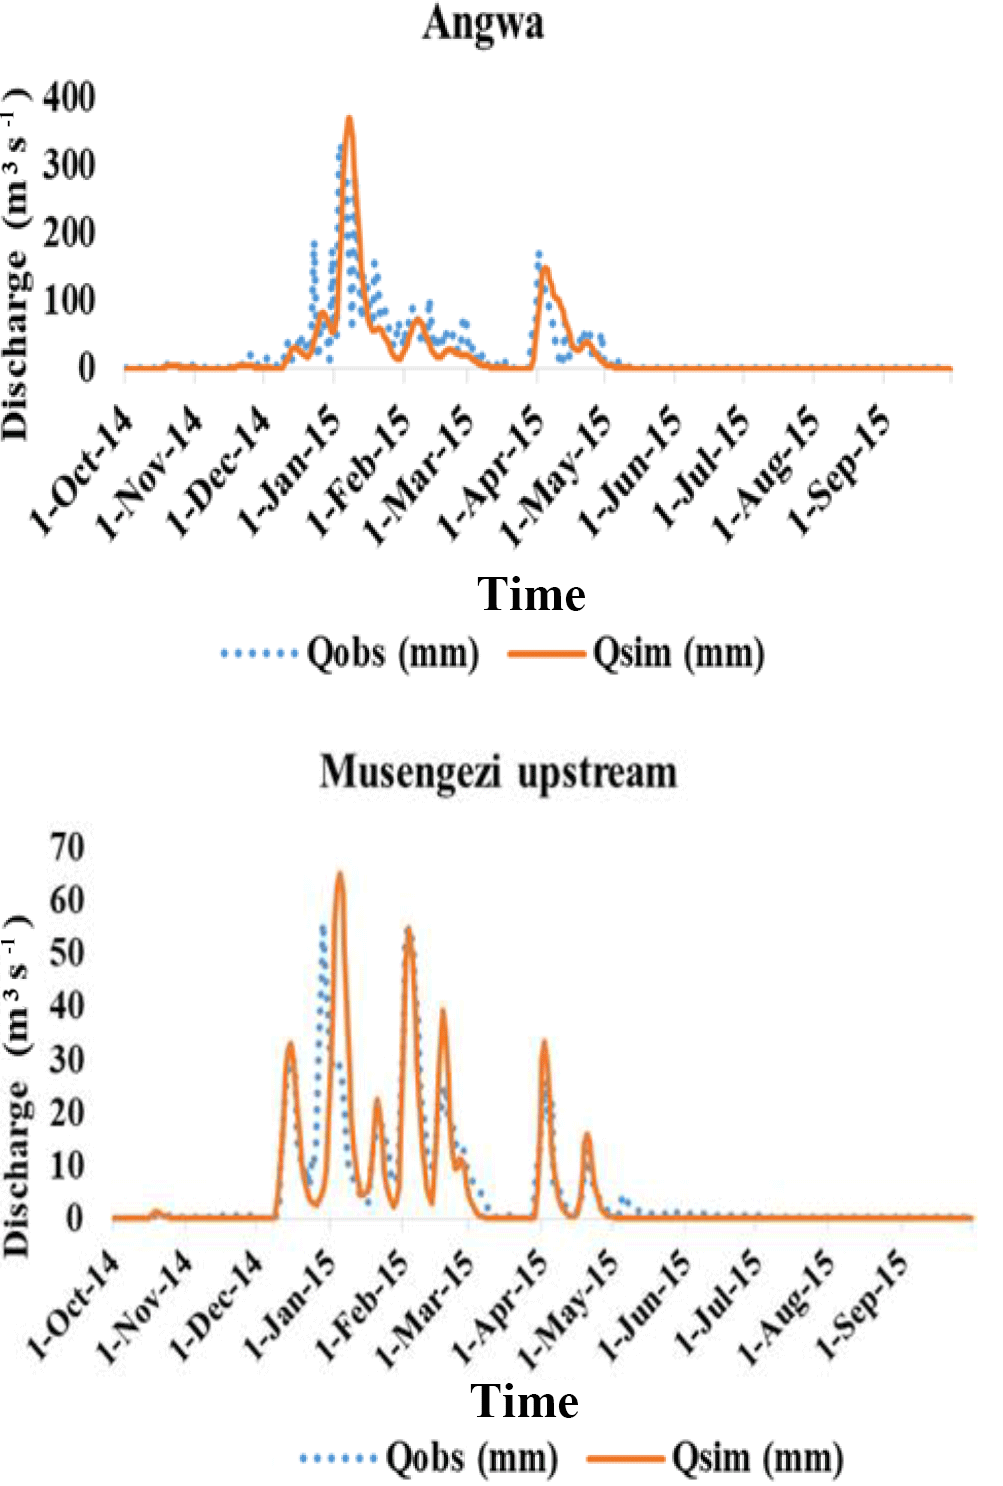
Figure 3Calibration results for Angwa and Musengezi rivers upstream based on daily timestep.
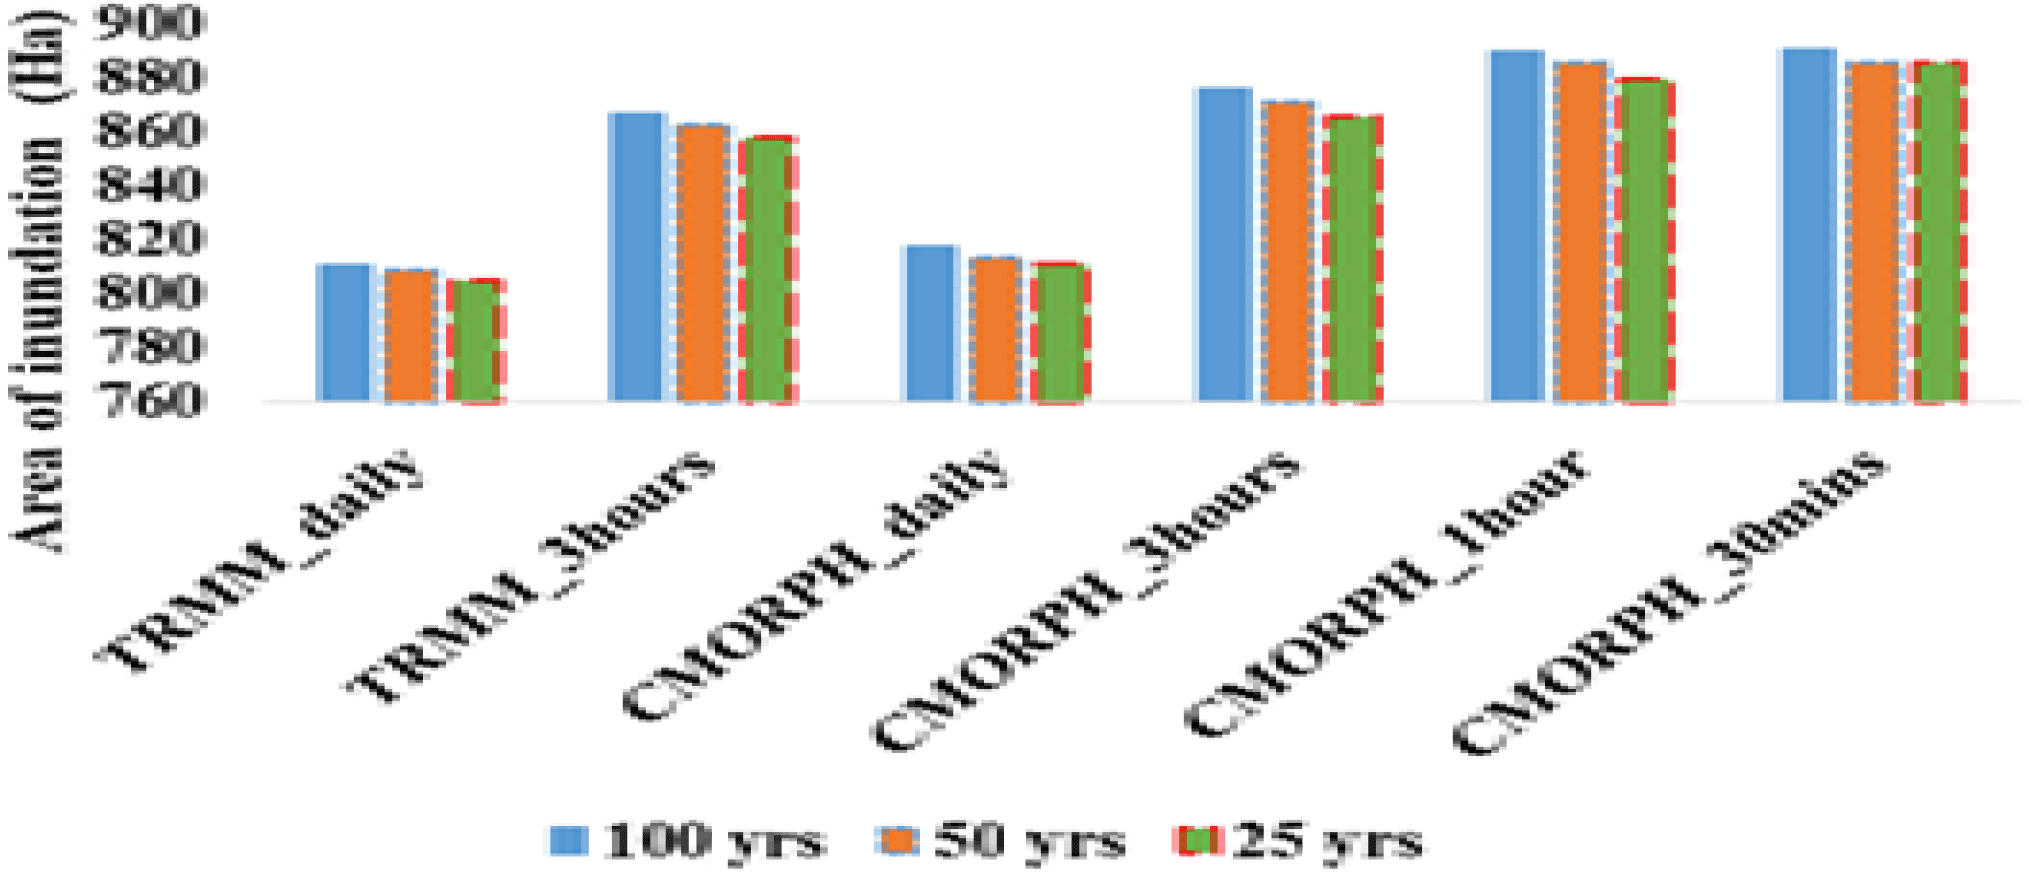
4.5 Application of bias corrected SREs into flash flood modelling
Figure 5 shows the area of inundation. For both satellites, flood extent for daily timestep was smaller than 3 h timestep. This confirms that flash floods, by their name, occur rapidly within a short period of time and immediately disappear such that daily timestep captures a lesser extent of flooded area. At a finer timestep such as 30 min and 1 h, CMORPH simulates the flash floods better than TRMM. The area of inundation by TRMM generated discharge is less than that of CMORPH generated discharge.
4.6 Validation of HECRAS flood simulation
The Cohen Kappa statistic shows that the ground control points were in agreement with the simulated flood plain by HECRAS. The coefficients were as follows: (P < 0.05) of 69, 67, 66.7, 54, 67 and 62 % for CMORPH 30 min, 1 h, 3 h, daily, TRMM 3 h and TRMM daily satellite precipitation respectively. Finer timesteps capture all floods since they are measured instantaneously whereas coarser timesteps present a mean over a period in question.
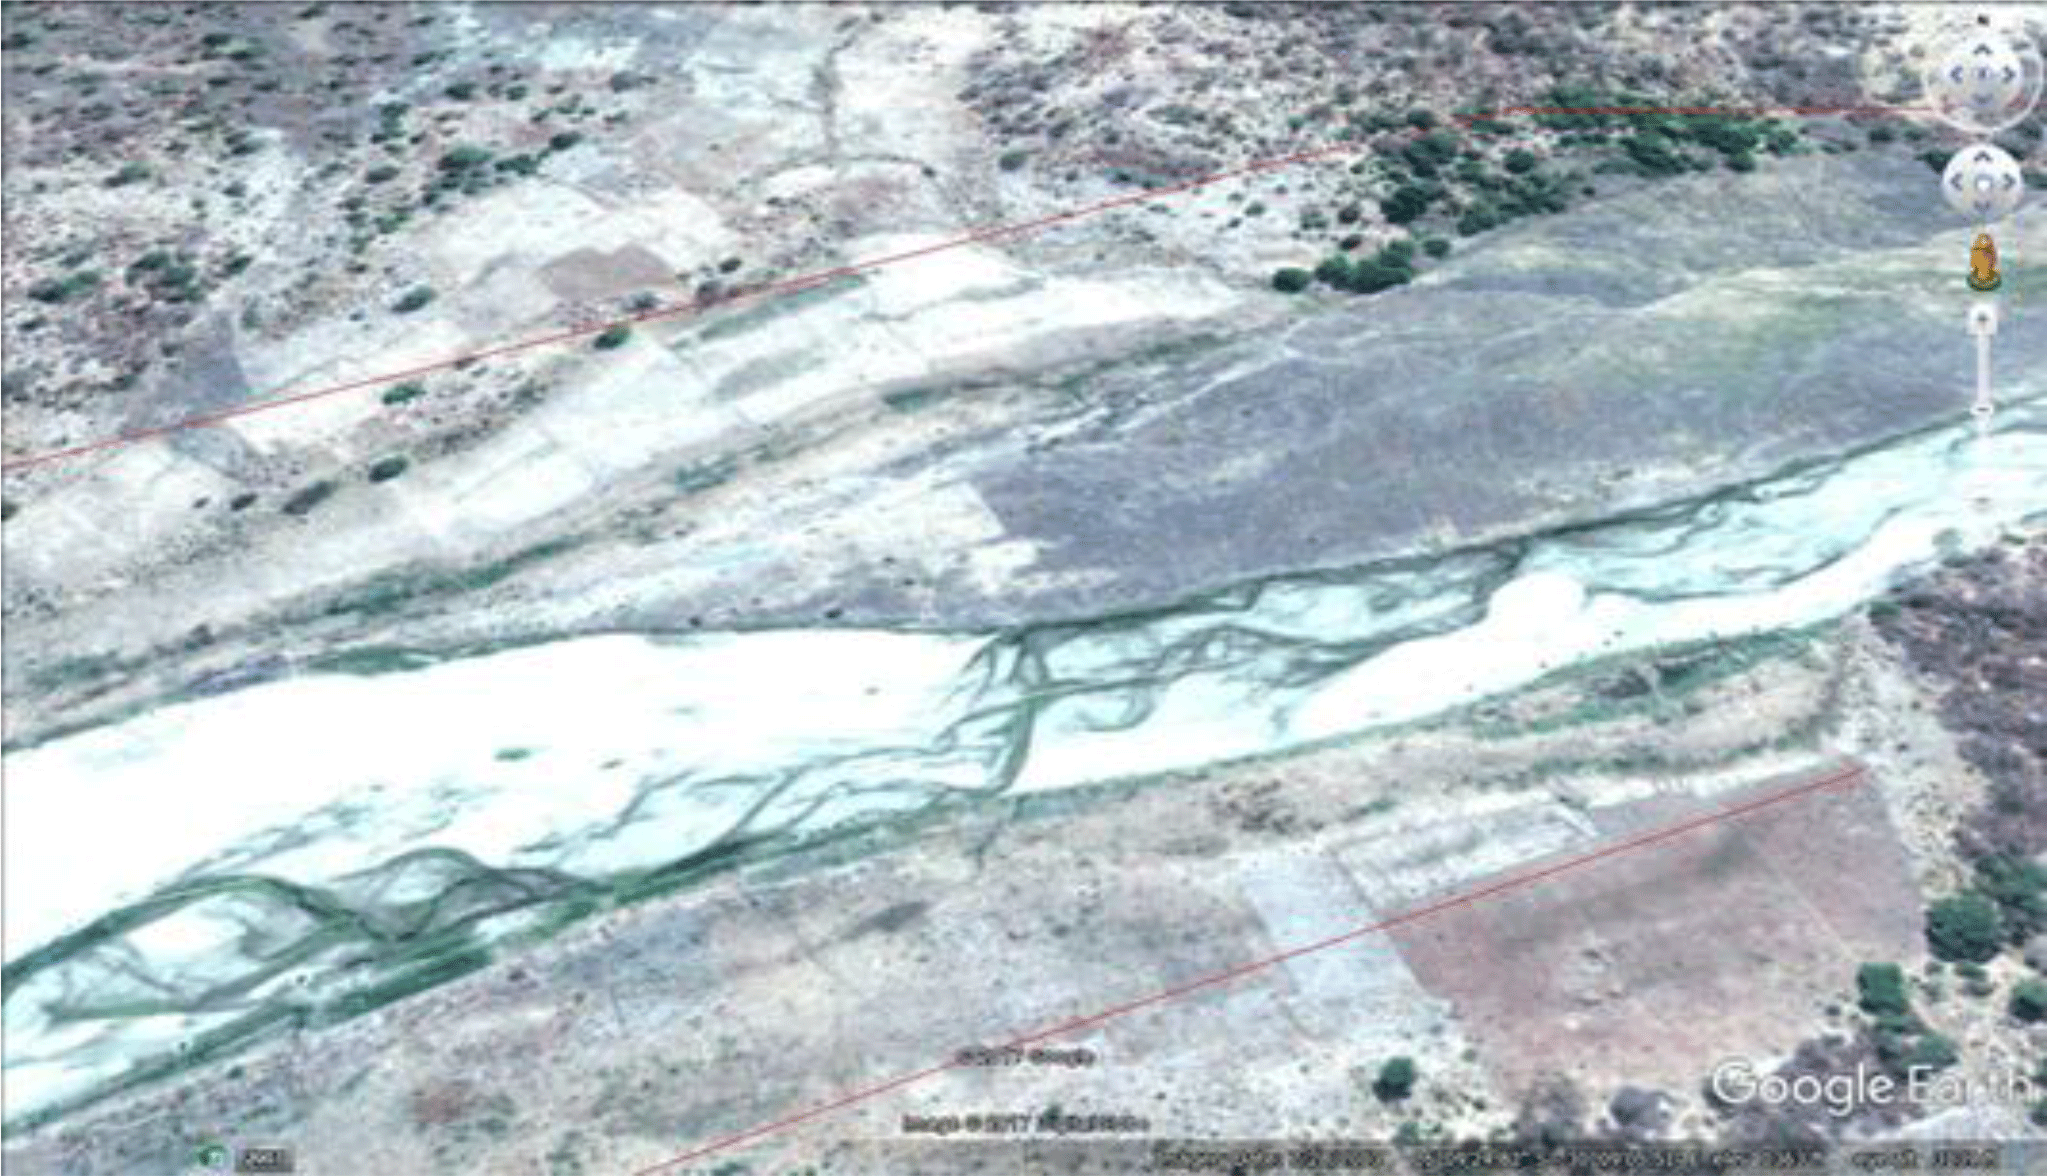
Figure 6 shows the best flood extent polygon at 30 min timestep and 100 year return period overlaid on google map. It can be seen that cultivating area is mostly at great risk when floods occur.
Both CMORPH and TRMM applications exhibit bias factors which were too large and, hence, warranted bias correction before application in hydrological and hydraulic modelling.
CMORPH also performed better than TRMM in terms of NSE and RVE when applied to the HEC-HMS model.
Since the flooded area was at finer timescales than for the aggregated daily timescales, it can also be concluded that floods occur rapidly and the chances of capturing them are higher when finer resolution of measurement are applied.
The data is accessible on request from the authors.
The authors declare that they have no conflict of interest.
This article is part of the special issue “Understanding spatio-temporal variability of water resources and the implications for IWRM in semi-arid eastern and southern Africa”. It is a result of the IAHS Scientific Assembly 2017, Port Elizabeth, South Africa, 10–14 July 2017.
WaterNet is highly acknowledged for supporting this research. The authors
greatly appreciate the Department of Civil Engineering for providing the
platform to carry out the research and helping to shape its successful
conclusion.
Edited by: Evison Kapangaziwiri
Reviewed by: Amidu Owolabi Ayeni and one anonymous referee
Abushandi, E. and Merkel, B.: Modelling Rainfall Runoff Relations Using HEC-HMS and IHACRES for a Single Rain Event in an Arid Region of Jordan, Water Resour. Manag., 27, 2391–2409, https://doi.org/10.1007/s11269-013-0293-4, 2013.
Bhatti, H. A., Rientjes, T., Haile, A. T., Habib, E., and Verhoef, W.: Evaluation of Bias Correction Method for, Sensors, 16, 10725–10748, https://doi.org/10.3390/s16060884, 2016.
Bhuiyan, H. A. K. M., Mcnairn, H., Powers, J., and Merzouki, A.: Application of HEC-HMS in a Cold Region Watershed and Use of RADARSAT-2 Soil Moisture in Initializing the Model, Hydrology, 4, 1–19, https://doi.org/10.3390/hydrology4010009, 2017.
Blacutt, L. A., Herdies, D. L., Gustavo, L., Gonçalves, G. De, Vila, D. A., and Andrade, M.: Precipitation comparison for the CFSR, MERRA, TRMM3B42 and Combined Scheme datasets in Bolivia, Atmos. Res., 163, 117–131, https://doi.org/10.1016/j.atmosres.2015.02.002, 2015.
Bola, G., Mabiza, C., Goldin, J., Kujinga, K., Nhapi, I., Makurira, H., and Mashauri, D.: Coping with droughts and floods: A Case study of Kanyemba, Mbire District, Zimbabwe, Phys. Chem. Earth, 67–69, 180–186, https://doi.org/10.1016/j.pce.2013.09.019, 2014.
Chen, X., Zhang, L., Gippel, C. J., Shan, L., Chen, S., and Yang, W.: Uncertainty of Flood Forecasting Based on Radar Rainfall Data Assimilation, Hindawi Publ. Corp., Adam House, London, UK, 2016.
Cohen Liechti, T., Matos, J. P., Boillat, J.-L., and Schleiss, A. J.: Comparison and evaluation of satellite derived precipitation products for hydrological modeling of the Zambezi River Basin, Hydrol. Earth Syst. Sci., 16, 489–500, https://doi.org/10.5194/hess-16-489-2012, 2012.
Gumindoga, W., Rientjes, T. H. M., Haile, A. T., Makurira, H., and Reggiani, P.: Bias correction schemes for CMORPH satellite rainfall estimates in the Zambezi River Basin, Hydrol. Earth Syst. Sci. Discuss., https://doi.org/10.5194/hess-2016-33, 2016a.
Gumindoga, W., Rwasoka, D. T., Nhapi, I., and Dube, T.: Ungauged runoff simulation in Upper Manyame Catchment, Zimbabwe: Application of the HEC-HMS model, Phys. Chem. Earth, 5, 1–12, https://doi.org/10.1016/j.pce.2016.05.002, 2016b.
Guo, H., Chen, S., Bao, A., Hu, J., and Yang, B.: Comprehensive Evaluation of High-Resolution Satellite-Based Precipitation Products over China, Atmosphere (Basel), 7, 1–9, https://doi.org/10.3390/atmos7010006, 2015.
Habib, E., Haile, A. T., Sazib, N., Zhang, Y., and Rientjes, T.: Effect of Bias Correction of Satellite-Rainfall Estimates on Runoff Simulations at the Source of the Upper Blue Nile, Remote Sens., 6688–6708, https://doi.org/10.3390/rs6076688, 2014.
Janssen, P. H. M. and Heuberger, P. S. C.: Calibration of process-oriented models, Ecol. Model., 83, 55–66, https://doi.org/10.1016/0304-3800(95)00084-9, 1995.
Kozanis, S., Christofides, A., Mamassis, N., and Efstratiadis, A. K.: Hydrognomon – A hydrological data management and processing software tool, Eur. Geosci. Union, 7, 04644, https://doi.org/10.13140/RG.2.2.34222.10561, 2005.
Liu, Z.: Evaluation of Precipitation Climatology Derived from TRMM Multi-Satellite Precipitation Analysis (TMPA) Monthly Product over Land with Two Gauge-Based Products, Climate, 3, 964–982, https://doi.org/10.3390/cli3040964, 2015.
Narayan, E. and Gautam, P.: Hydrological Modeling with HEC-HMS in Different Channel Sections in Case of Gandaki River Basin, Global Journals Inc, Wakefield, USA, 2015.
Ning, S., Wang, J., Jin, J., and Ishidaira, H.: Assessment of the Latest GPM-Era High-Resolution Satellite Precipitation Products by Comparison with Observation Gauge Data over the Chinese Mainland, Water, 41–42, https://doi.org/10.3390/w8110481, 2016.
Saber, M. and Yilmaz, K.: Bias Correction of Satellite-Based Rainfall Estimates for Modeling Flash Floods in Semi-Arid regions: Application to Karpuz River, Turkey, Nat. Hazards Earth Syst. Sci. Discuss., https://doi.org/10.5194/nhess-2016-339, 2016.
Shen, Y., Xiong, A., Wang, Y., and Xie, P.: Performance of high-resolution satellite precipitation products over China, J. Geophys. Res., 115, D02114, https://doi.org/10.1029/2009JD012097, 2010.
Yang, Y. and Luo, Y.: Evaluating the performance of remote sensing precipitation products CMORPH, PERSIANN, and TMPA, in the arid region of northwest China, Theor. Appl. Clim., 118, 429–445, https://doi.org/10.1007/s00704-013-1072-0, 2014.