the Creative Commons Attribution 4.0 License.
the Creative Commons Attribution 4.0 License.
 | 29 May 2018
Fuzzy and process modelling of contour ridge water dynamics
Alexander Mhizha
John Ndiritu
Contour ridges are an in-situ rainwater harvesting technology developed initially for soil erosion control but are currently also widely promoted for rainwater harvesting. The effectiveness of contour ridges depends on geophysical, hydro-climatic and socio economic factors that are highly varied in time and space. Furthermore, field-scale data on these factors are often unavailable. This together with the complexity of hydrological processes at field scale limits the application of classical distributed process modelling to highly-instrumented experimental fields. This paper presents a framework that combines fuzzy logic and process-based approach for modelling contour ridges for rainwater harvesting where detailed field data are not available. Water balance for a representative contour-ridged field incorporating the water flow processes across the boundaries is integrated with fuzzy logic to incorporate the uncertainties in estimating runoff. The model is tested using data collected during the 2009/2010 and 2010/2011 rainfall seasons from two contour-ridged fields in Zhulube located in the semi-arid parts of Zimbabwe. The model is found to replicate soil moisture in the root zone reasonably well (NSE = 0.55 to 0.66 and PBIAS = −1.3 to 6.1 %). The results show that combining fuzzy logic and process based approaches can adequately model soil moisture in a contour ridged-field and could help to assess the water dynamics in contour ridged fields.
- Article
(2557 KB) - Full-text XML
-
Supplement
(256 KB) - BibTeX
- EndNote


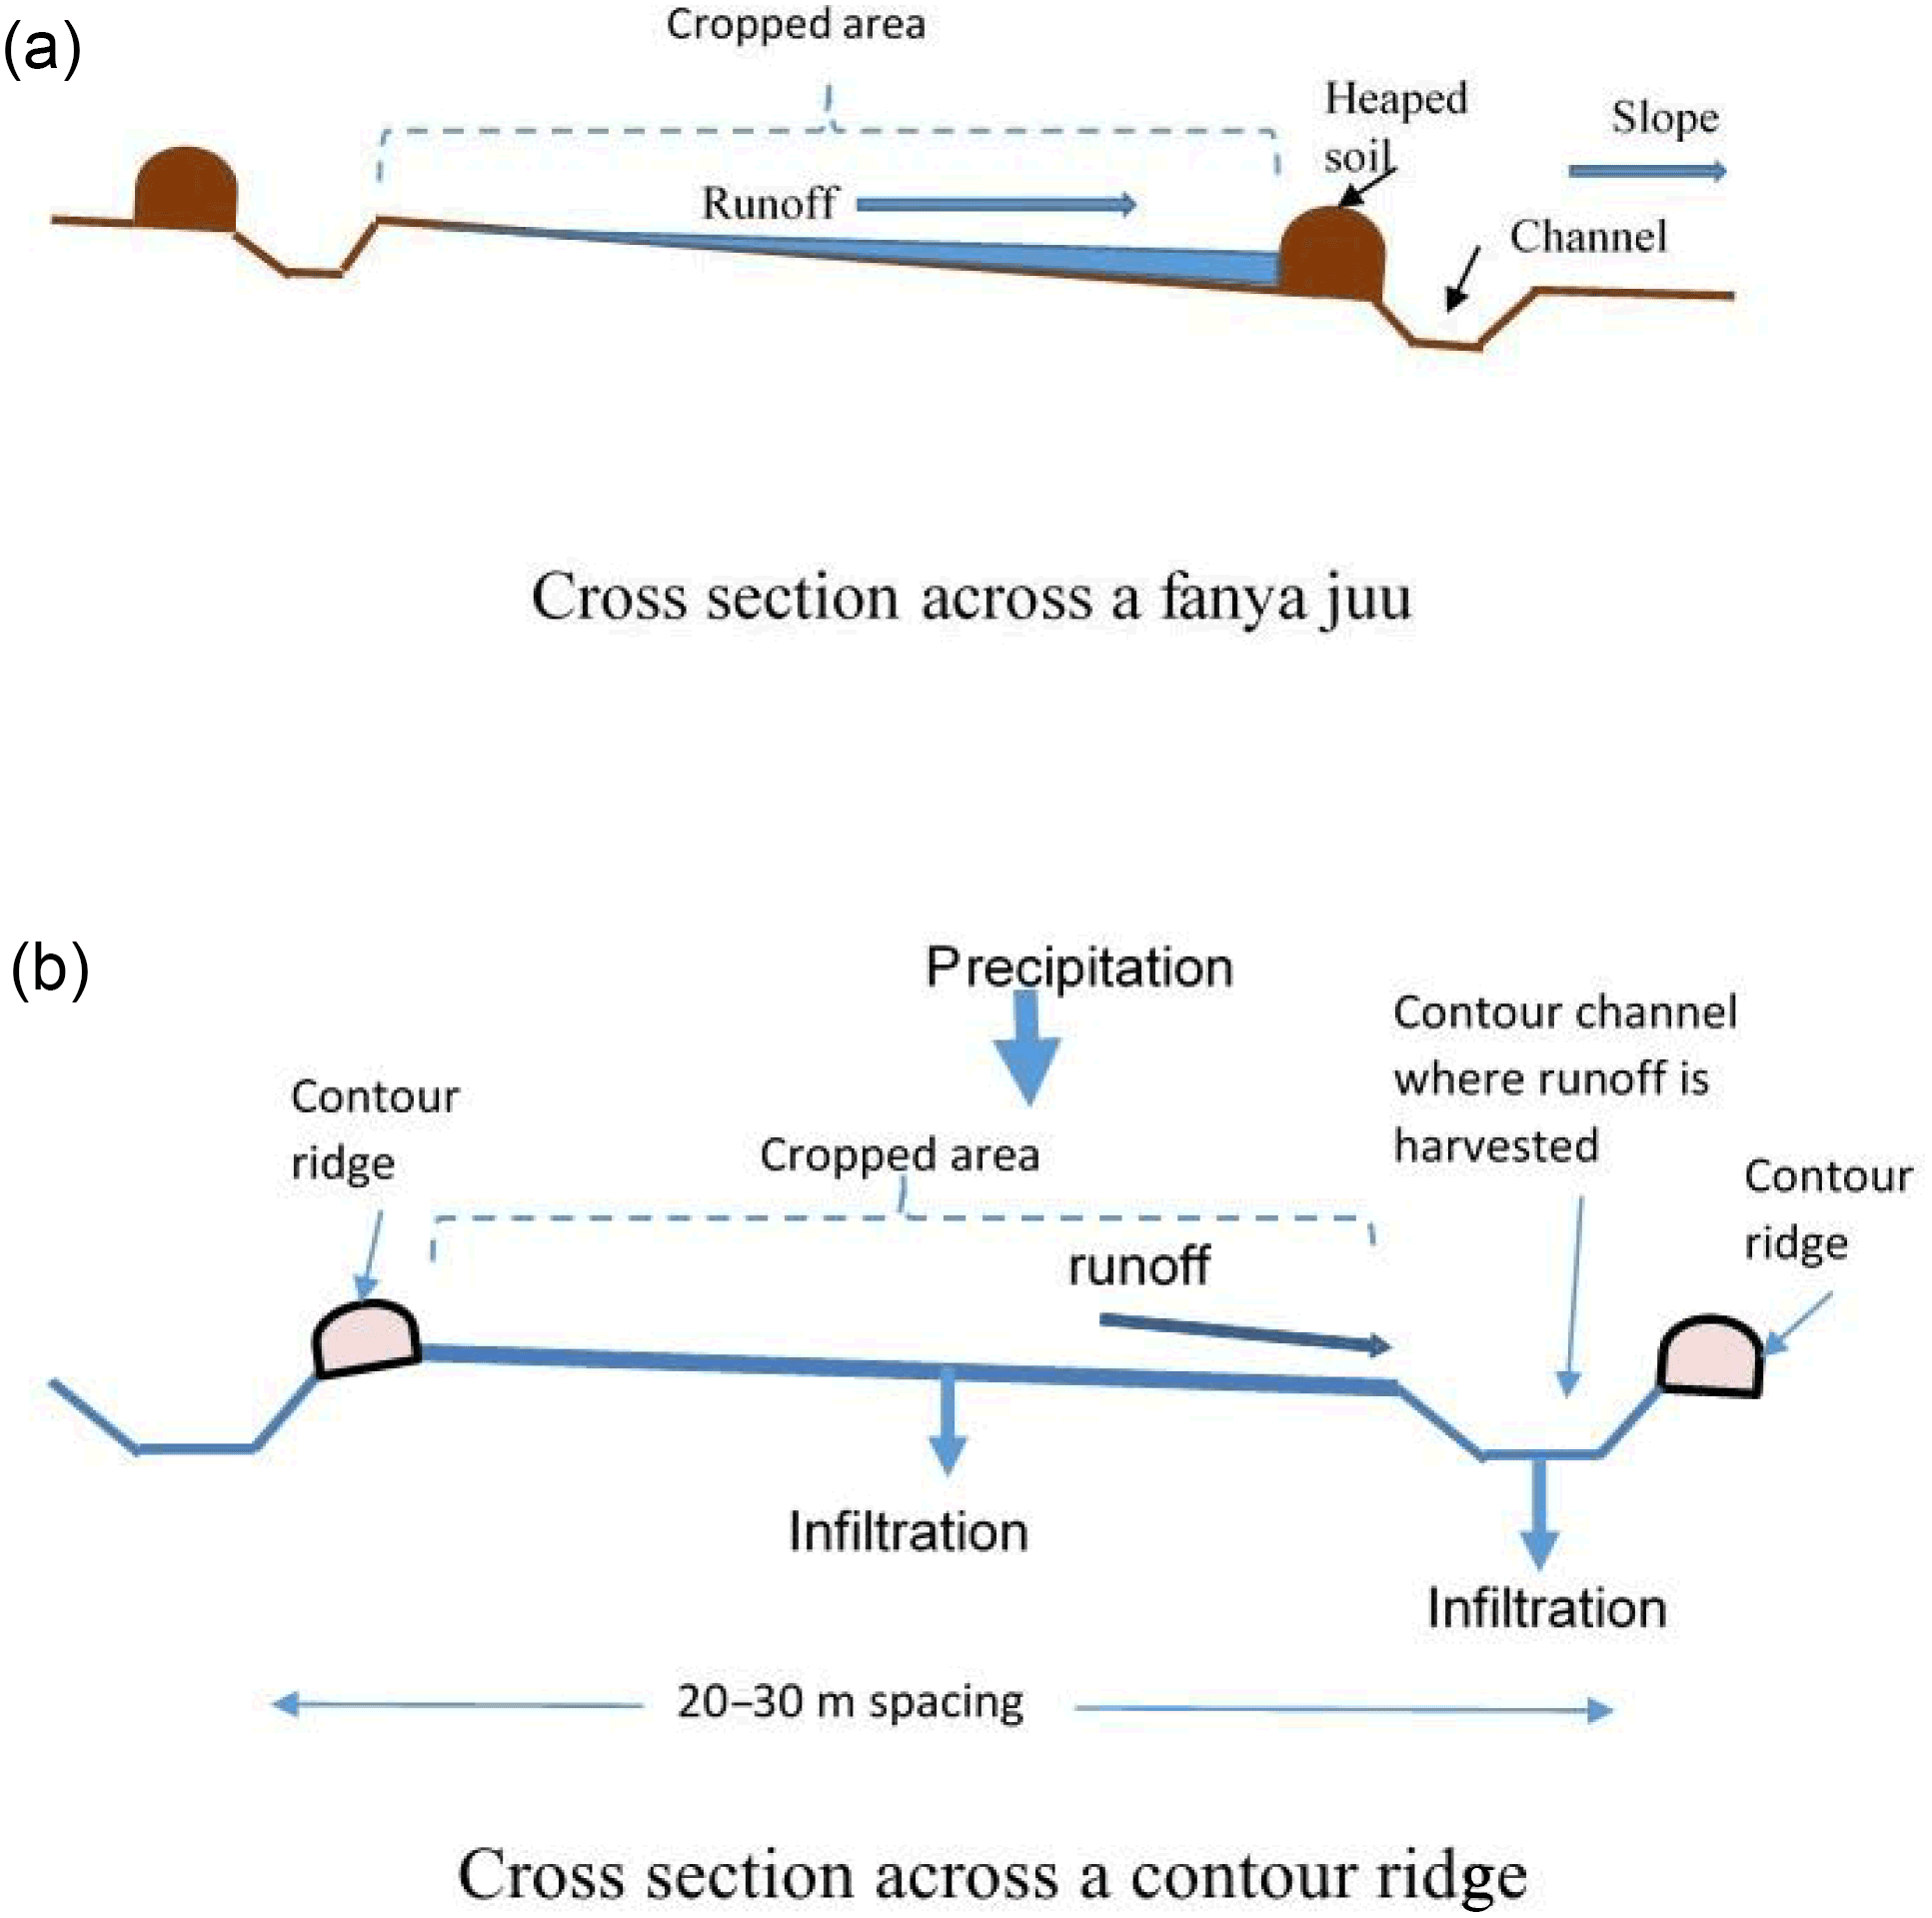
In-situ rainwater harvesting techniques are widely promoted in arid and semi-arid regions of the world to mitigate against the effects of dry spells that are frequently experienced in these areas. Some of the in-situ rainwater harvesting techniques that are implemented include planting basins which are found in many parts of sub Saharan Africa (Mupangwa et al., 2012), fanya juus in East African countries mainly in Tanzania and Kenya (Makurira et al., 2010) and contour ridges promoted in Tunisia, Ethiopia (Hengsdijk et al., 2005) and Zimbabwe (Mhizha and Ndiritu, 2013). A contour ridge is an excavated trench with the excavated soil heaped on the down slope side unlike in a fanya juu where the soil is heaped up slope (Fig. 1). The trench provides temporal storage for storm water drained from the field upslope while the ridge prevents the water from flowing downslope once the trench is full.
In Zimbabwe contour ridges were initially adopted and legally enforced for soil erosion control with designs adopted from the United States of America (Elwel, 1981). The initial design comprised of a graded contour ridge constructed along a slope of approximately 5 % to safely drain the water away from a cultivated field. The forced implementation and draining away of water in the dry semi-arid regions was not appreciated by farmers (Hargman, 1996) who later changed the design to dead level contours which are constructed at zero gradient to prevent the storm water from draining away and retain it in the field (Mupangwa et al., 2012). Studies by Mupangwa et al. (2012) showed that soil moisture improvements downslope of a dead level contour ridge were limited to a distance of about 4 m. Mhizha and Ndiritu (2013) further established that soil moisture improvement due to dead level contour ridges was significant in loam soil and not in sandy soil. These observations raise the need for modelling contour ridged fields to establish water dynamics due to contour ridges.
Modelling of contour ridges, fanya juus and other rainwater harvesting technologies has previously been done using existing models developed for crop water management or for groundwater movement. Hengsdijk et al. (2005) modelled the effect of stone contour ridges (bunds) on crop yield in Ethiopia using the WOFOST (World Food Studies) which is a dynamic crop growth simulation model. The model assumes that runoff reductions due to the stone bunds result in increased infiltration and that this water is stored in the root zone and becomes available to crops. The model does not provide for runoff estimation but rather runoff is obtained from site observations. This implies that uncertain estimates of runoff need to be used on sites where there is no runoff observation. Mwenge Kahinda et al. (2007) used the APSIM (Agricultural Production Systems SIMulator) a crop yield estimation model to model the effect of supplemental irrigation using water from rainwater harvesting systems of rock outcrops and contour ridges in semi-arid areas of Zimbabwe. The HYDRUS model which was developed for modelling groundwater movement was used by Ruidisch et al. (2013) to model water flow in a plastic mulched ridge cultivation system in South Korea. The HYDRUS model does not have provision for estimating runoff and is data intensive limiting its application to experimental sites and not to sites where data can be readily collected by farmers.
Rainwater harvesting modelling requires that results (or models developed with data) from experimental sites are transferred to non-experimental fields for practical application. Parched-Thirst (Young et al., 2002), a process based model was developed to solve such problems of transferability. Such models, whose availability is limited, have a structure that captures the main processes driving rainwater harvesting in order to remain meaningful. Parched-Thirst estimates runoff as infiltration excess using the Green Ampt equation and contour ridges are incorporated as depression storages. Parched-Thirst was successfully used by Magombeyi et al. (2012) to model crop yield from rainwater harvesting by planting basins known locally as Chololo pits. It is suited for this type of rainwater harvesting technology because the spacing between the ridges is small which makes the concept of modifying runoff generation by depression storages justifiable. The spacing of contour ridges that is around 20 m is large enough to warrant that runoff generated in the cropped area be estimated separately. Parched-Thirst does not explicitly estimate the runoff that flows into contour ridges. Soil parameters for the estimation of infiltration are determined using pedo-transfer functions where site data does not exist. This limits its application in analysing contour ridge water dynamics.
This paper presents a model that applies fuzzy logic to estimate runoff in the cropped area and process based approaches for water partitioning in different locations of a contour ridged field. The paper briefly describes the hydrological conceptual framework of a contour ridged field which informs the representative sub regions of a contour ridged field where water partitioning takes place. These sub regions were identified according to hydrological processes that are dominant in each sub region similar to the way sub regions of a representative elementary watershed are identified (Reggiani et al., 1998). The main processes that are dominant in rainwater harvesting by contour ridges are rainfall, interception, runoff, infiltration and unsaturated soil moisture flow.
2.1 Contour ridge design and data collection
The contour ridge layout used in the model was that of the experimental fields set up in Zhulube (Mhizha and Ndiritu, 2013) which were spaced at 20 m and constructed at zero gradient to prevent water from leaving the field. Data was obtained from a 3-year long field study of these experimental sites (Mhizha, 2017) and from a previous study in Masvingo (Mugabe et al., 2007). Both sites are located in in the semi-arid areas of Zimbabwe where average rainfall is 540 mm a−1. Data collected comprised of rainfall at daily time step, soil moisture at weekly time step and soil hydraulic parameters. The rainfall data was disaggregated into rainfall intensity at hourly time step using the method developed by Knoesen and Smithers (2009) which is a modification of the rainfall disaggregation model proposed by Boughton (2000). The soil hydraulic parameters collected and used in the modelling are field capacity, the wilting point and infiltration capacity of the soil.
2.2 Modelling water partitioning in a contour ridged field
Table 1Normalised cluster centre values after data clustering.
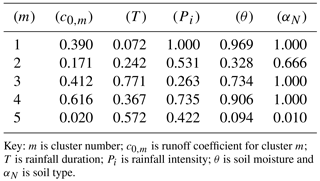
Key: m is cluster number; c0,m is runoff coefficient for cluster m; T is rainfall duration; Pi is rainfall intensity; θ is soil moisture and αN is soil type.
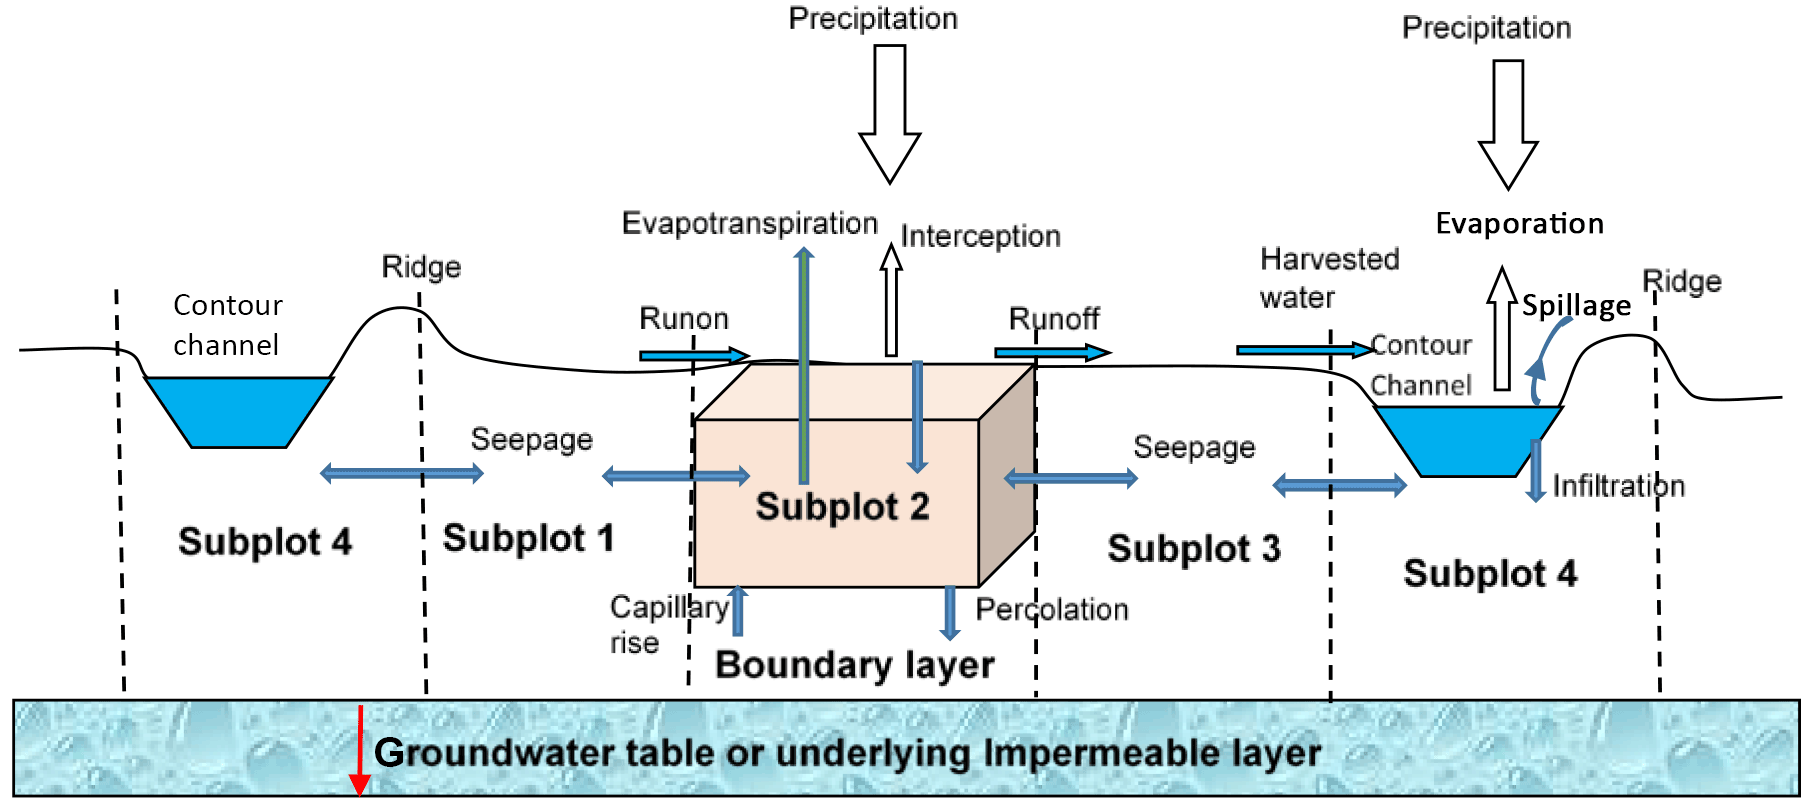
A contour ridged field comprising of the cropped area, two contour ridges and the root zone (Fig. 2) was considered to be a hydrological system where water partitioning takes place in different components of the system. Water partitioning in these three components of the system were considered for modelling of contour ridge water dynamics. The first water partitioning occurs when rainfall in the cropped area is turned into infiltration, interception and runoff. The runoff generated in the cropped area accumulates in the contour ridge channel where the second partitioning takes place. The accumulated runoff is turned into evaporation, infiltration and if the channel becomes full discharge from the system. The infiltrated water in both the cropped area and the channel add to the soil moisture in the root zone. Within the root zone the third water partitioning occurs. The soil moisture is turned into evapotranspiration (soil evaporation and transpiration), deep percolation and lateral flow to adjacent areas.
To model the water partitioning processes an approach similar to the representative elementary watershed concept (Regianni et al., 1998) was adopted. Each zone of the contour ridge hydrological system where water partitioning occurs was considered a hydrological subzone for which water balance analysis could be done. Water mass flows across the boundaries of each subzone were represented by the main hydrological processes taking place in the water mass balance equations of that subzone.
The model operates on a daily time step which is the time step that farmers can obtain rainfall and evaporation data for their areas. For each time step the model start by executing the rainfall partitioning in the cropped area. Once the model completes water partitioning in the cropped area water partitioning in the contour ridge channel begins. The last water partitioning in the model is carried out in the root zone.
2.2.1 Water balance for rainfall partitioning
Table 2Model consequent coefficients from shuffled evolution calibration.
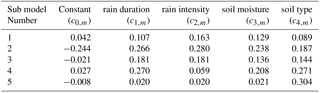
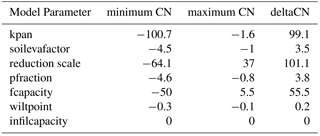
Table 3Comparison of the model sensitivity to selected parameters.
The inputs in the water balance equation for rainfall partitioning are rainfall, interception and runoff while infiltration is taken as the residual of the water balance equation. At a time step of one day the change in surface water storage for a cropped area is assumed to be zero thus leaving infiltration as the only unknown if interception and runoff can be independently estimated. Interception reduces the amount of rainfall that reaches the soil and become available to other hydrological processes of runoff and infiltration. The model estimates interception using a threshold-based approach and includes all evaporative demands that feed moisture back into the atmosphere (de Groen and Savenije, 2006). In this approach, when rainfall stops, interception storage is reduced by evaporation until there is no more storage or until the evaporative demand for the day is achieved (Makurira et al., 2010). Runoff is estimated using a fuzzy logic based method. This method uses a set of linear regression models where rainfall intensity, rainfall duration, soil moisture (for the previous day) and soil type are input data and runoff is the output. This method is described in more detail in Sect. 2.2. The cropped area is divided into subplots to allow accumulation of runoff downslope of a contour ridge. Thus effective precipitation at each subplot takes into account runoff from upslope subplots. This ensures that downslope subplots generate more runoff than upslope subplots. Finally the subplot upslope of the contour ridge channel discharges water into the channel thus making it input into the runoff partitioning subzone. Equation (1) describes the water balance for rainfall partitioning.
Where: Δς∕Δt is change in surface storage; eatm is exchange with atmosphere (precipitation and interception or evaporation); eada is net exchange of runoff with adjacent subplot surface area; ecrc is exchange with the contour ridge channel (runoff); and erz is exchange with the root zone (infiltration into the subplot).
2.2.2 Water balance for runoff partitioning
The inputs for runoff partitioning are rainfall as data for the site, runoff from the rainfall partitioning and evaporation. Infiltration in the contour ridge channel is determined from the infiltration capacity of the soil and water availability in the contour ridge channel. The water balance allows for spillage if the net increase in volume leads to a value exceeding the storage capacity of the contour ridge channel. Equation (2) describes the runoff partitioning water balance.
Where: is change in contour ridge channel storage; ecrz is exchange with channel root zone (infiltration); eatm is exchange with atmosphere (precipitation and evaporation); eca is exchange with cropped area (run-on into contour ridge channel); ead is exchange with adjacent area (spillage).
2.2.3 Water balance for soil moisture partitioning
Like in the rainfall partitioning the contour ridged field is divided into subzones for soil moisture partitioning and mass water balance is carried out separately in each subzone. Infiltration estimated from the rainfall partitioning and the runoff partitioning enters the root zone as input for the soil moisture partitioning zone.
Evapotranspiration includes both evaporation from soil and transpiration by the crops and is estimated by considering evaporation and transpiration processes separately in terms of the FAO-56 method as applied by Makurira et al. (2010) and Allen (2000). The evaporation component is estimated using equation 3 and includes a reduction scale parameter which needs to be calibrated (Makurira et al., 2010).
Where: Es is soil evaporation (mm day−1); Eo is pan evaporation for the day, ILA is the leaf area index; EI is evaporation from interception which has an effect of reducing evaporation demand in the atmosphere; ks is soil evaporation factor (equivalent to crop factor in cropped areas); kp is the pan evaporation factor and fms is moisture stress reduction factor given by Eq. (4).
Where: υsat is maximum soil moisture (which is soil moisture at saturation) in the root zone (mm) and b is a reduction scale (mm).
The vertical and lateral soil moisture fluxes are estimated using Eq. (5). The hydraulic conductivity and diffusivity (Ks and Fz in Eq. 5) vary hysterically with moisture. In order to cater for hysteresis in hydraulic conductivity Mahrt and Pan (1984) proposed a thin layer soil hydrology model in which the hydraulic conductivity of a layer of soil when drying would be based on the soil moisture of the lower layer and when wetting the hydraulic conductivity would be based on the soil moisture of the upper layer. This approach was adopted here.
Where: Φm,t is soil moisture flux (flow) into or out of subplot m at time t; is the soil moisture gradient given by Eq. (6) and Ks Fz is hydraulic conductivity and diffusivity of the soil.
Where: and are the soil moisture in subplot m and m+1 at end of time t and t−1, respectively and Δx is distance between the centre of subplots md and md+1.
The water transmission and storage processes were modelled and incorporated in the subsurface water balance. Mhizha (2017) provides more details of how this was done. Equation (7) describes the soil moisture zone water balance.
Where: Δθ∕Δt is change in soil moisture during the time step; θm,t is soil moisture in subzone m at time t (current time); is soil moisture in subzone m, at time t−1; eca is exchange with cropped area surface (infiltration); eatm is exchange with the atmosphere (evapotranspiration); eas is exchange with adjacent subzone (seepage); egw is exchange with groundwater system (percolation); emp is exchange with macropore spaces within the same subplot.
2.3 Fuzzy rainfall runoff modelling
This method makes use of several linear regression models for estimating runoff amounts as a function of rainfall intensity, rainfall duration, soil moisture and soil type. Application of linear regression models for estimating runoff at field scale is common for experimental sites (Li et al., 2004; Walker and Tsubo, 2003). To try and ensure a balanced influence of the independent variables on modelled runoff, all the data were normalized for the fuzzy modelling. Fuzzy modelling typically follows the IF-(antecedent part)–THEN-(consequence part) approach which is controlled by an inference system developed through the Mamdani or the Tagagi-Sugeno system (Katambara and Ndiritu, 2009). By applying the Tagagi-Sugeno fuzzy model development approach 5 multiple linear regression models of the form given in Eq. (8) were established. The linear modelling approach in Eq. (8) is in line with the regression models normally used to model runoff at field scale (Li et al., 2004; Walker and Tsubo, 2003). Each of these models have their focal point whose positions are given in Table 1. Fuzzification of data points was achieved through establishing the degree to which each data set belonged to any of the sub models. This together with the computation of the overall runoff coefficient from the partial submodel contributions (defuzzification) were done following the method described in Katambara and Ndiritu (2009) for a fuzzy inference system developed to model stream flow.
Where: qj,m is normalised runoff coefficient (mm) contributed by partial model m during rainfall event j; Pi,j is normalised rainfall intensity during rainfall event j (mm); Tj is normalised rainfall duration for rainfall event j (hours); θj is normalised root zone soil moisture during event j (mm); αNj is normalised soil parameter defining soil hydraulic conductivity for event j and c0,m, c1,m, c2,m, c3,m and c4,m are coefficients to input variables for cluster m.
2.4 Sensitivity analysis, model calibration and performance assessment
Table 4Model performance during calibration and verification stages.
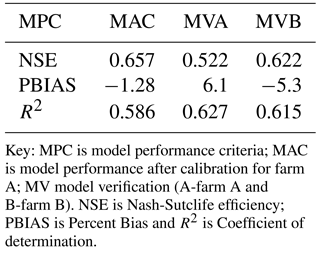
Key: MPC is model performance criteria; MAC is model performance after calibration for farm A; MV model verification (A-farm A and B-farm B). NSE is Nash-Sutclife efficiency; PBIAS is Percent Bias and R2 is Coefficient of determination.
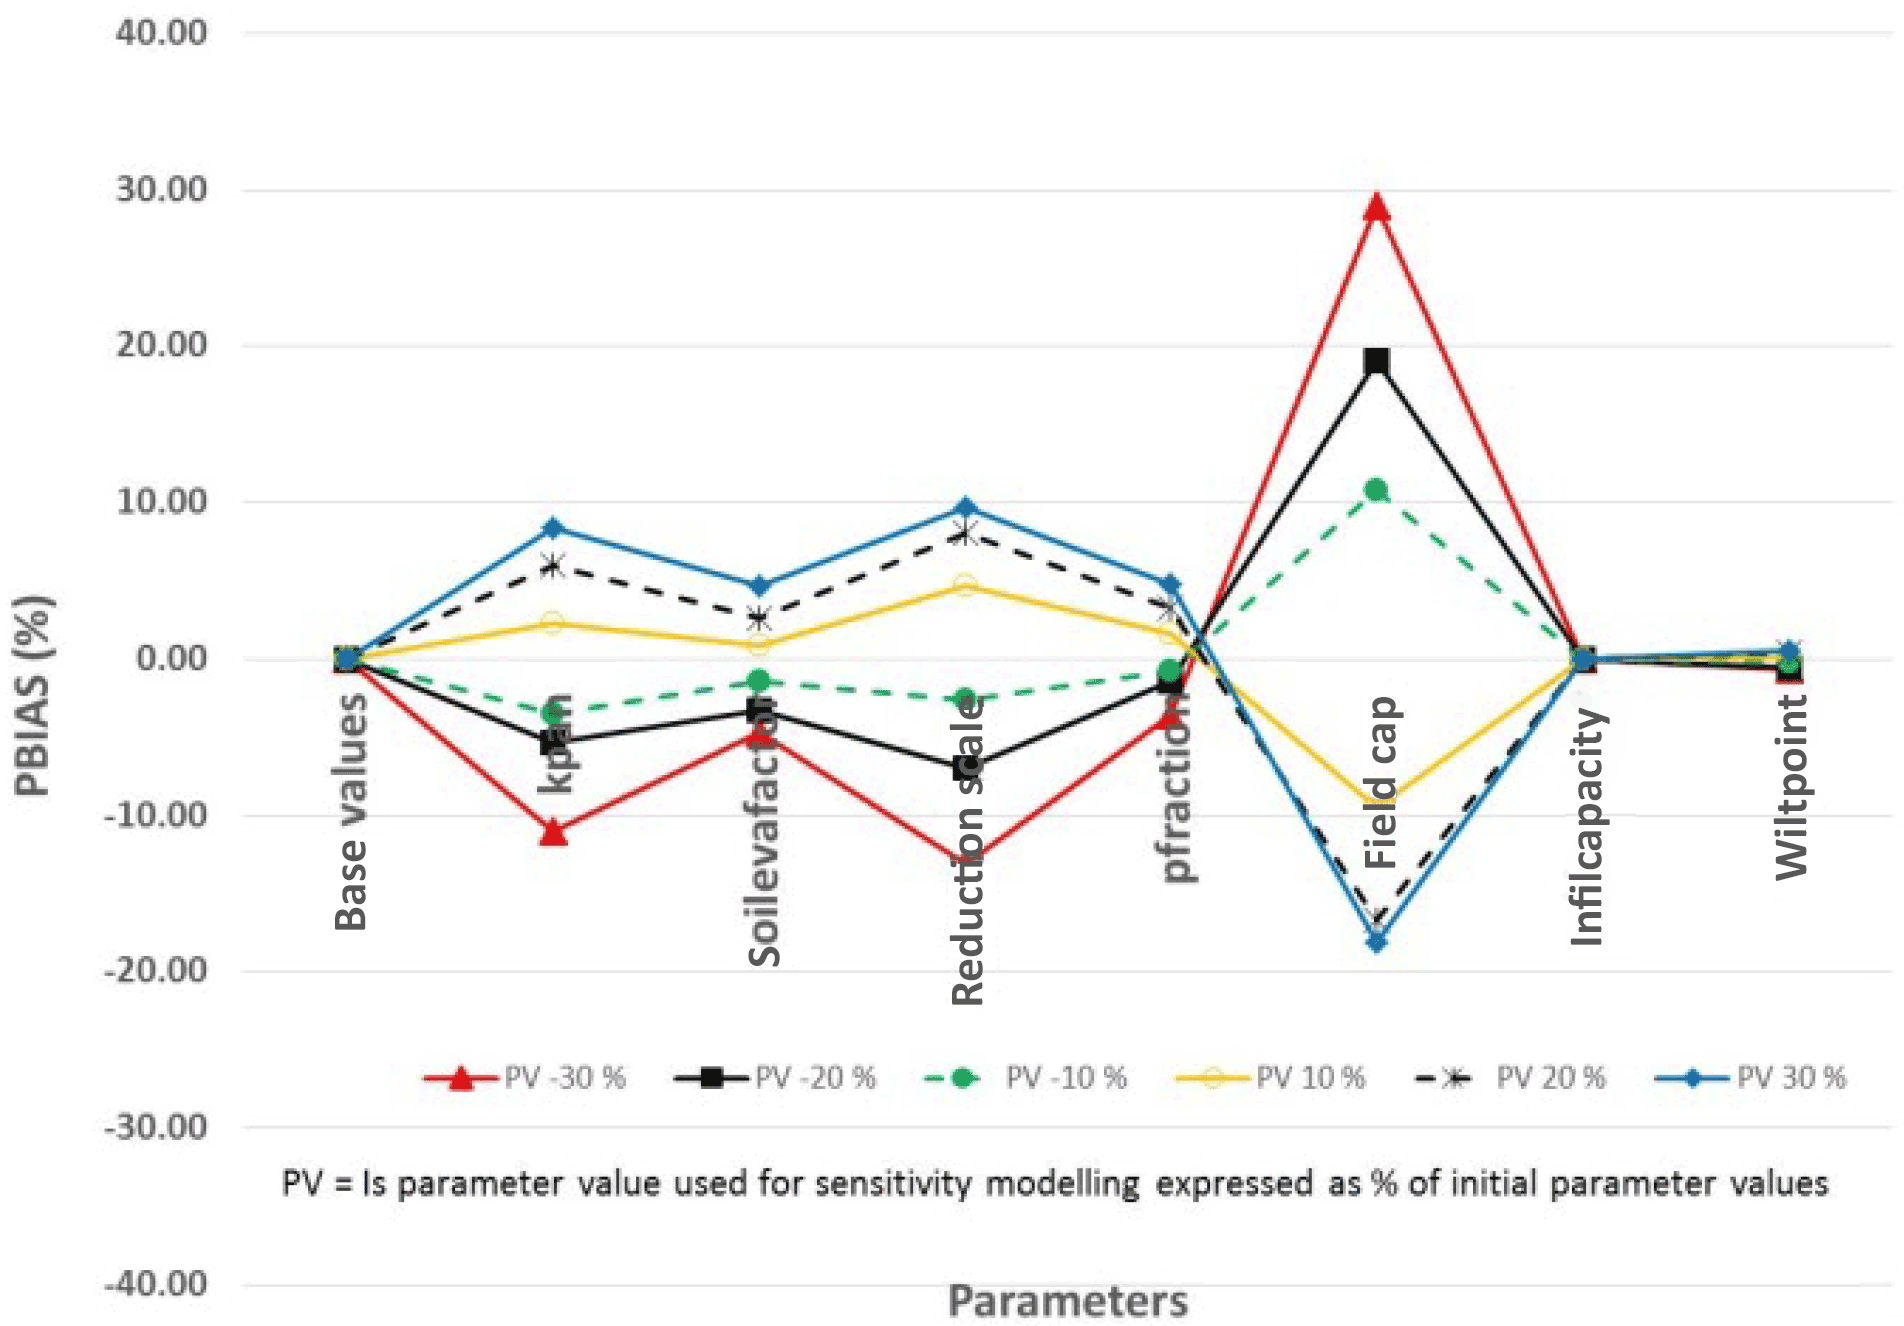
A sensitivity analysis was carried out to establish data and model parameters that affect model outputs. This involved modifying selected input parameters while holding all other parameters constant (Hoyos and Cavalcante, 2015; Kumar et al., 2014). The sensitivity of model output to the different parameters was compared using the condition number which expresses the rate of change of the dependent variable with respect to the rate of change in the independent variables (Hoyos and Cavalcante, 2015). The parameters that were assessed for sensitivity are shown in Table 3. The values were increased or reduced by 0 to 30 % of base value.
Model calibration for the fuzzy component applied the SCE-UA method (Duan et al., 1992) with the objective of minimizing the root mean square error between the simulated and observed runoff. The calibrated coefficients of each sub model are given in Table 2. The overall model calibration was based on the sensitivity analysis results after which the model was calibrated by adjusting the value of the sensitive parameter.
Performance of the overall model was assessed using the Nash-Sutcliffe efficiency (NSE) (Eq. 9), the Percent bias (PBIAS) determined by Eq. (10) and coefficient of determination (R2) (Eq. 11) as defined by Moriasi et al. (2007).
Where: Yi,obs and Yi,sim are the observed and simulated values for data point i and and are observed and simulated mean values for all the data points.
The data that was used for verification was for a rainfall season different from that which was used during model calibration. Data from field A for the season 2009/2010 were used for model calibration while that from field A and field B for the season 2010/2011 were used to show how the model would perform in an independent field not used to calibrate the model.

Figure 5 shows the PBIAS for eight parameters that were used in the sensitivity analysis. The results showed that the model is sensitive to the value of the field capacity, the reduction scale, pan evaporation data and soil evaporation. This was further confirmed by the condition number (CN) as shown in Table 3. The condition number was calculated by considering the change in simulated soil moisture when a parameter value is changed by the indicated percentage compared to the simulated value when all parameters maintain their base values as the dependent variable and the percentage change in parameter value as the independent variable (Hoyos and Cavalcante, 2015).
Except the reduction scale the other three (field capacity, pan evaporation and soil evaporation) values can be improved through more accurate field observations. Therefore the reduction scale was established to be the only parameter that required calibration. The reduction scale was also found to be the next most sensitive parameter after field capacity of the soil. Trial modelling runs also revealed that reduction scale was dependent on the prevailing soil moisture (Eq. 4) although Makurira et al. (2010) had previously used a constant reduction scale (Fig. 4). The value of the reduction scale after calibration was found to be equal to the prevailing soil moisture minus the soil moisture at wilting point. This shows that the reduction scale is not constant but a variable parameter that depends on soil moisture. This conforms to the units of the reduction scale as given in Eq. (4).
The uncertainty in the modelled soil moisture resulted largely from the uncertainty in field data (rainfall, evaporation and soil parameters) and the model structure. The structure of the model is such that runoff modelled by the fuzzy component of the model becomes input data to the process based component of the model. Zere et al. (2005) established a performance level of R2=0.49 for a maize plot and R2=0.59 for a bare plot using the PutRun model. In addition to the uncertainty arising from the modelled runoff soil moisture simulated in one time step is used as input data when modelling the next time step. These two factors affect the overall performance of the model.
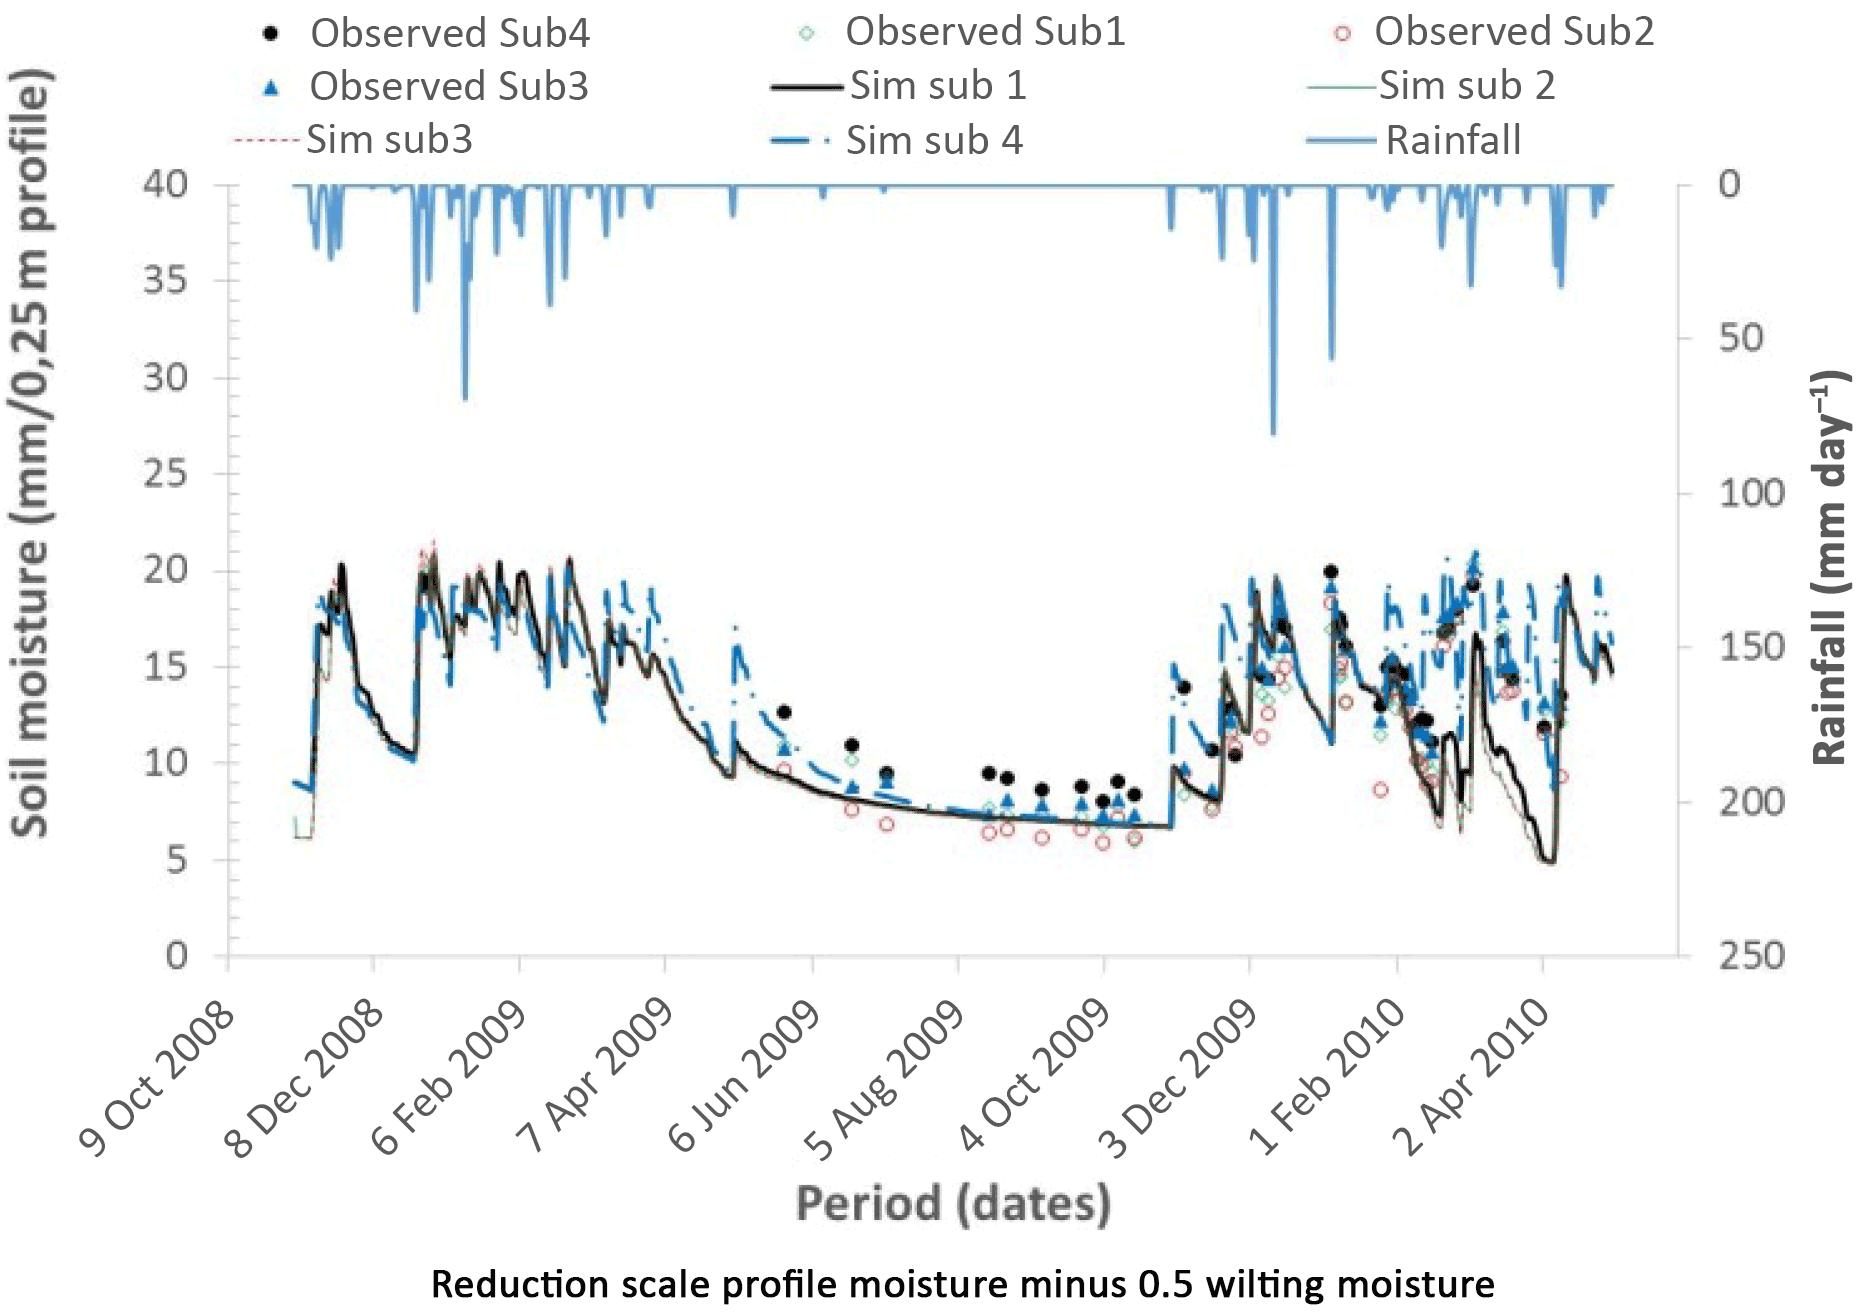
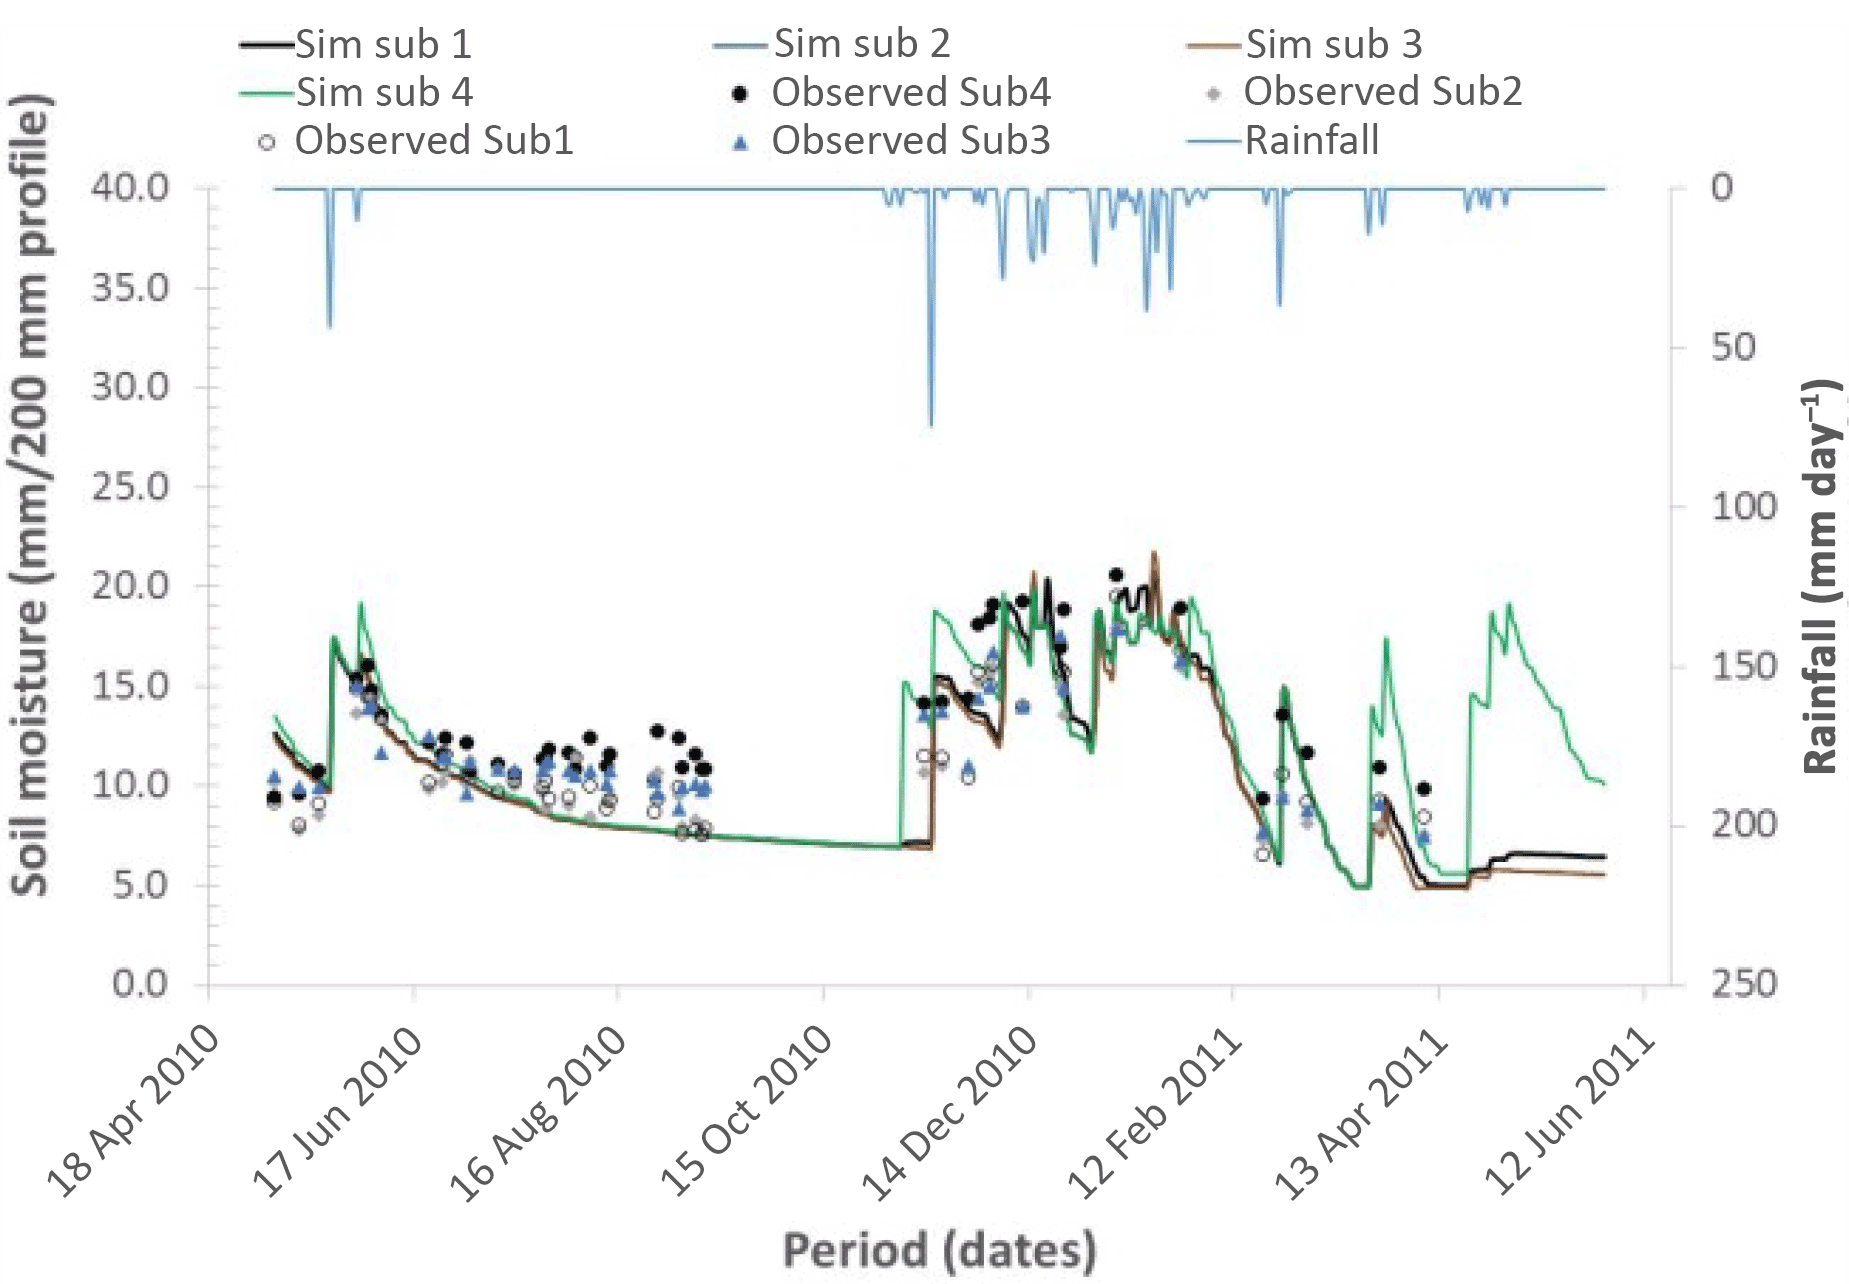
Results of the verification of model performance are shown in Figs. 5 and 6. The model performance (Table 4) with NSE value of 0.52 to 0.66 and PBias value of −1.3 % to 6.1 for soil moisture compare favourably with the results obtained by Ruidisch et al. (2013) who modelled ridge cultivation in South Korea using HYDRUS 2-D model on a similar soil (loam) and obtained a NSE value of 0.48 and PBIAS of 12 %. Again the R2 value of 0.59 to 0.63 for the modelled soil moisture indicates fairly good model performance considering that uncertainty in estimating runoff affects overall model output.
The strength of this modelling approach lies in the fact that it can be applied to a field where data on runoff does not exist. The runoff of such a field with limited data is estimated by taking into account the prevailing conditions on the field and relates them to the focal points of the fuzzy sub models developed from fields that had data. This is similar to the approach that is taken when modelling ungauged sites where model parameters from gauged basins are extrapolated to ungauged sites (Kapangaziwiri et al., 2009). This means that there is potential to apply this approach in data scarce situations.
A realistic modelling of contour ridged field water dynamics was achieved using fuzzy logic rainfall-runoff modelling and process based approaches of quantifying soil moisture fluxes. The model was tested using field data collected from a site in rural Zimbabwe. The model performed reasonably well in calibration with a Nash-Sutcliffe Efficiency of 0.657, overall percent bias of −1.28 % and a Coefficient of determination of 0.586. In verification the model performed equally well with Nash-Sutcliffe Efficiency of 0.522, overall percent bias of 6.1 % and a Coefficient of determination of 0.627 on the loam soil and Nash-Sutcliffe Efficiency of 0.622, overall percent bias of −5.3 % and a Coefficient of determination of 0.615 on the sandy soil. The applicability of this modelling to contour ridge design for rainwater harvesting needs to be assessed further. The modelling approach applied here could also be applicable to hydrological modelling in data-scarce situations.
The model code can be obtained from the University of Witwatersrand Library or from the authors. The underlying research data set is available in the Supplement.
The supplement related to this article is available online at: https://doi.org/10.5194/piahs-378-3-2018-supplement.
The authors declare that they have no conflict of interest.
This article is part of the special issue “Understanding spatio-temporal variability of water resources and the implications for IWRM in semi-arid eastern and southern Africa”. It is a result of the IAHS Scientific Assembly 2017, Port Elizabeth, South Africa, 10–14 July 2017.
The authors acknowledge and thank the following organizations and persons
for their assistance in this study: The Challenge Programme for Water and
Food and The University of Witwatersrand for providing financial support for
this study which was part of the PhD study for Alexander Mhizha. Francis Themba Mugabe
for providing data for the sites in Masvingo Province, Zimbabwe.
Lewis Ndlovu and Sithabile Ndlovu for assistance in field data collection in
Zhulube Catchment, Matebeleland South Province,
Zimbabwe.
Edited by: Hodson Makurira
Reviewed by: Raphael Tshimanga and one anonymous referee
Allen, R. G.: Using the FAO-56 dual crop coefficient method over an irrigated region as part of an evapotranspiration intercomparison study, J. Hydrol., 229, 27–41, 2000.
Boughton, W.: A model for disaggregating daily to hourly rainfalls for design flood estimation, Report 00/15, Cooperative Research Centre for Catchment Hydrology, Monash University, Clayton, Victoria, Australia, 2000.
de Groen M. M. and Savenije H. H. G.: A monthly interception equation based on the statistical characteristics of daily rainfall, Water Resour. Res., 42, W2417 to W2427, https://doi.org/10.1029/2006WR005013, 2006.
Duan, Q. Y., Sorooshian, S., and Gupta, V.: Effective and efficient global optimization for conceptual rainfall-runoff models, Water Resour. Res., 28, 1015–1031, 1992.
Elwell, H. A.: Contour Layout Design, Department of Conservation and Extension, Government Printers, Harare, Zimbabwe, 1981.
Hagmann, J.: Mechanical soil conservation with contour ridges: cure for, or cause of, rill erosion?, Land Degrad. Dev., 7, 145–160, 1996.
Hengsdijk, H., Meijerink, G. W., and Mosugu, M. E.: Modelling the effect of three soil and water conservation practices in Tigray, Ethiopia, Agr. Ecosyst. Environ., 105, 29–40, 2005.
Hoyos, E. M. and Cavalcante, A. L. B.: Sensitivity Analysis of One-Dimensional Infiltration Models, EJGA, 20, 4313–4324, 2015.
Kapangaziwiri, E., Hughes, D. A., and Wagener, T.: Towards the development of a consistent uncertainty framework for hydrological predictions in South Africa, New Approaches to Hydrological Prediction in Data-sparse Regions (Proc. of Symposium HS.2 at the Joint IAHS & IAH Convention, Hyderabad, India, September 2009), IAHS-AISH P., 333, 84–93, 2009.
Katambara, Z. and Ndiritu, J.: A fuzzy inference system for modelling streamflow: Case of Letaba River, South Africa, Phys. Chem. Earth, 34, 688–700, 2009.
Knoesen, D. and Smithers, J.: The development and assessment of a daily rainfall disaggregation model for South Africa, Hydrolog. Sci. J., 54, 217–233, doi:10.1623/hysj.54.2.217, 2009.
Kumar, R., Shankar, V., and Jat, M. K.: Sensitivity Analysis of Nonlinear Model Parameters in a Multilayer Root Zone, Journal of Hydrologic Engineering, ASCE, 19, 462–471, 2014.
Li, X.-Y., Xie, Z.-K., and Yan, X.-K.: Runoff characteristics of artificial catchment materials for rainwater harvesting in the semi-arid regions of China, Agr. Water Manage., 65, 211–224, 2004.
Magombeyi, M. S., Morardet, S., Taigbenu, A. E., and Cheron, C.: Food insecurity of smallholder farming systems in B72A catchment in the Olifants River Basin, South Africa, Afr. J. Agric. Res., 7, 278–297, 2012.
Mahrt, L. and Pan, H.: A two-layer model of soil hydrology, Bound.-Lay. Meteorol., 29, 1–20, 1984.
Makurira, H., Savenije, H. H. G., and Uhlenbrook, S.: Modelling field scale water partitioning using on-site observations in sub-Saharan rainfed agriculture, Hydrol. Earth Syst. Sci., 14, 627–638, https://doi.org/10.5194/hess-14-627-2010, 2010.
Mhizha, A.: Contour ridge modelling using fuzzy logic and process based approaches for improved rainwater harvesting, unpublished PhD Thesis, University of Witwatersrand, 2017.
Mhizha, A. and Ndiritu, J. G.: Assessing crop yield benefits from in-situ rainwater harvesting through contour ridges in Semi-Arid Zimbabwe, Physics and Chemistry of the Earth, Elsevier, 2013.
Moriasi, D. N., Arnold, J. G., Van Liew, M. W., Bingner, R. L., Harmel, R. D., and Veith, T. L.: Model evaluation guidelines for systematic quantification of accuracy in watershed simulations, Transactions of the ASABE, American Society of Agricultural and Biological Engineers ISSN 0001-2351, 50, 885–900, 2007.
Mugabe, F. T., Hodnett, M. G., and Senzanje, A.: Effect of temporal rainfall distribution and soil type on soil moisture and runoff generation in semi-arid Zimbabwe, Water Policy, 38, 1–16, 2007.
Mupangwa W., Twomlow S. J., and Walker S.: Dead level contours and infiltration pits for risk mitigation in smallholder cropping systems of southern Zimbabwe, Phys. Chem. Earth Pt A/B/C, 47, 166–172, 2012.
Mwenge Kahinda, J., Rockstrom, J., Taigbenu, A. E., and Dimes, J.: Rainwater harvesting to enhance water productivity of rainfed agriculture in the semi-arid Zimbabwe, Phys. Chem. Earth, 32, 1068–1073, 2007.
Reggiani, P., Sivapalan, M., and Hassanizadeh, S. M.: A unifying framework for watershed thermodynamics: balance equations for mass, momentum, energy and entropy, and the second law of thermodynamics, Adv. Water Resour., 22, 367–398, 1998.
Ruidisch, M., Kettering, J., Arnhold, S., and Huwe, B.: Modeling water flow in a plastic mulched ridge cultivation system on hillslopes affected by South Korean summer monsoon, Agr. Water Manage., 116, 204–217, 2013.
Walker, S. and Tsubo, M.: PutuRun: A simulator for rainfall-runoff-yield processes with in-field water harvesting, WRC Report No. K8/486, Water Research Commission Pretoria, 2003.
Young, M. D. B, Gowing, J. W., Wysecure, G. C. L., and Hatibu, N.: Patched-Thirst: Development and validation of a process-based model of rainwater harvesting, Agr. Water Manage., 55, 121–140, 2002.
Zere, T. B., van Huyssteen, C. W., and Hensley, M.: Estimation of runoff at Glen in the Free State Province of South Africa, Water SA, 31, available at: https://www.ajol.info/index.php/wsa/article/view/5116/12728 (last access: 14 March 2018), 2005.