the Creative Commons Attribution 4.0 License.
the Creative Commons Attribution 4.0 License.
 | 16 Apr 2018
Satellite images survey for the identification of the coastal sedimentary system changes and associated vulnerability along the western bay of the Gulf of Tunis (northern Africa)
Abderraouf Hzami
Oula Amrouni
Gheorghe Romanescu
Cristian Constantin Stoleriu
Alin Mihu-Pintilie
Abdeljaouad Saâdi
The aim of this study consists in testing the effectiveness of satellite data in order to monitoring shoreline and sedimentary features changes, especially the rapidly changing of Gulf of Tunis coast. The study area is located in the Gulf of Tunis western bay (Southern Mediterranean Sea) which is characterized by sandy beaches of Ghar Melah and Raoued (Medjerda Delta area). The aerial photographs and satellite imageries were used for mapping the evolution of shoreline. Diachronic data (satellite imagery, aerial photography and topographic maps) were used to monitor and to quantify, the evolution of the coastal areas. These thematic data were digitally overlaid and vectorised for highlighting the shoreline changes between 1936 and 2016, in order to map the rate of erosion and accretion along the shoreline. Results show that the accretion and degradation are related to the Medjerda: change of outlet in 1973 and impoundment of the Sidi Salem dam in 1982. We found that the general trend of the coastal geomorphic processes can be monitored with satellite imageries (such as Sentinel A2, Spots 4 and 5), due to its repetitive coverage along the time and their high quality concerning the spectral contrast between land and sea areas. Improved satellite imageries with high resolution should be a valuable tool for complementing traditional methods for mapping and assessing the sedimentary structures (such as shoreline, delta, marine bars), and monitoring especially the lowlands coastal areas (slightly eroded).
- Article
(10823 KB) - Full-text XML
- BibTeX
- EndNote


The general characteristics of coastal erosion worldwide are described in terms of geography by the types of erosion, the causes which starts the erosion processes, and the effects generated by erosion processes. A shoreline is defined as the linear interface between land and water areas (Dolan et al., 1980). Shoreline is an element with a high spatial variability which imposes a rapidly changing for coastal landforms (Mujabar and Chandrasekar, 2013). Hence the efficient methods are needed to handle the spatial and temporal variability of coastal shoreline using GIS techniques. Thieler et al. (2009) developed an extension for ArcGIS software which allows automatic measurements for shoreline changes. Many researches utilized remote sensing data to analyse coastal environments: Louati et al. (2014), Oyedotun (2014, 2017), Thinh and Hens (2017). Many studies in Tunisia have shown the effect of coastal degradation related to different natural and anthropogenic factors (Paskoff, 1988; Oueslati, 2004, 2010; Halouani et al., 2011, 2013; Saïdi et al., 2012, 2013; Louati and Zargoun, 2013; Louati et al., 2014).
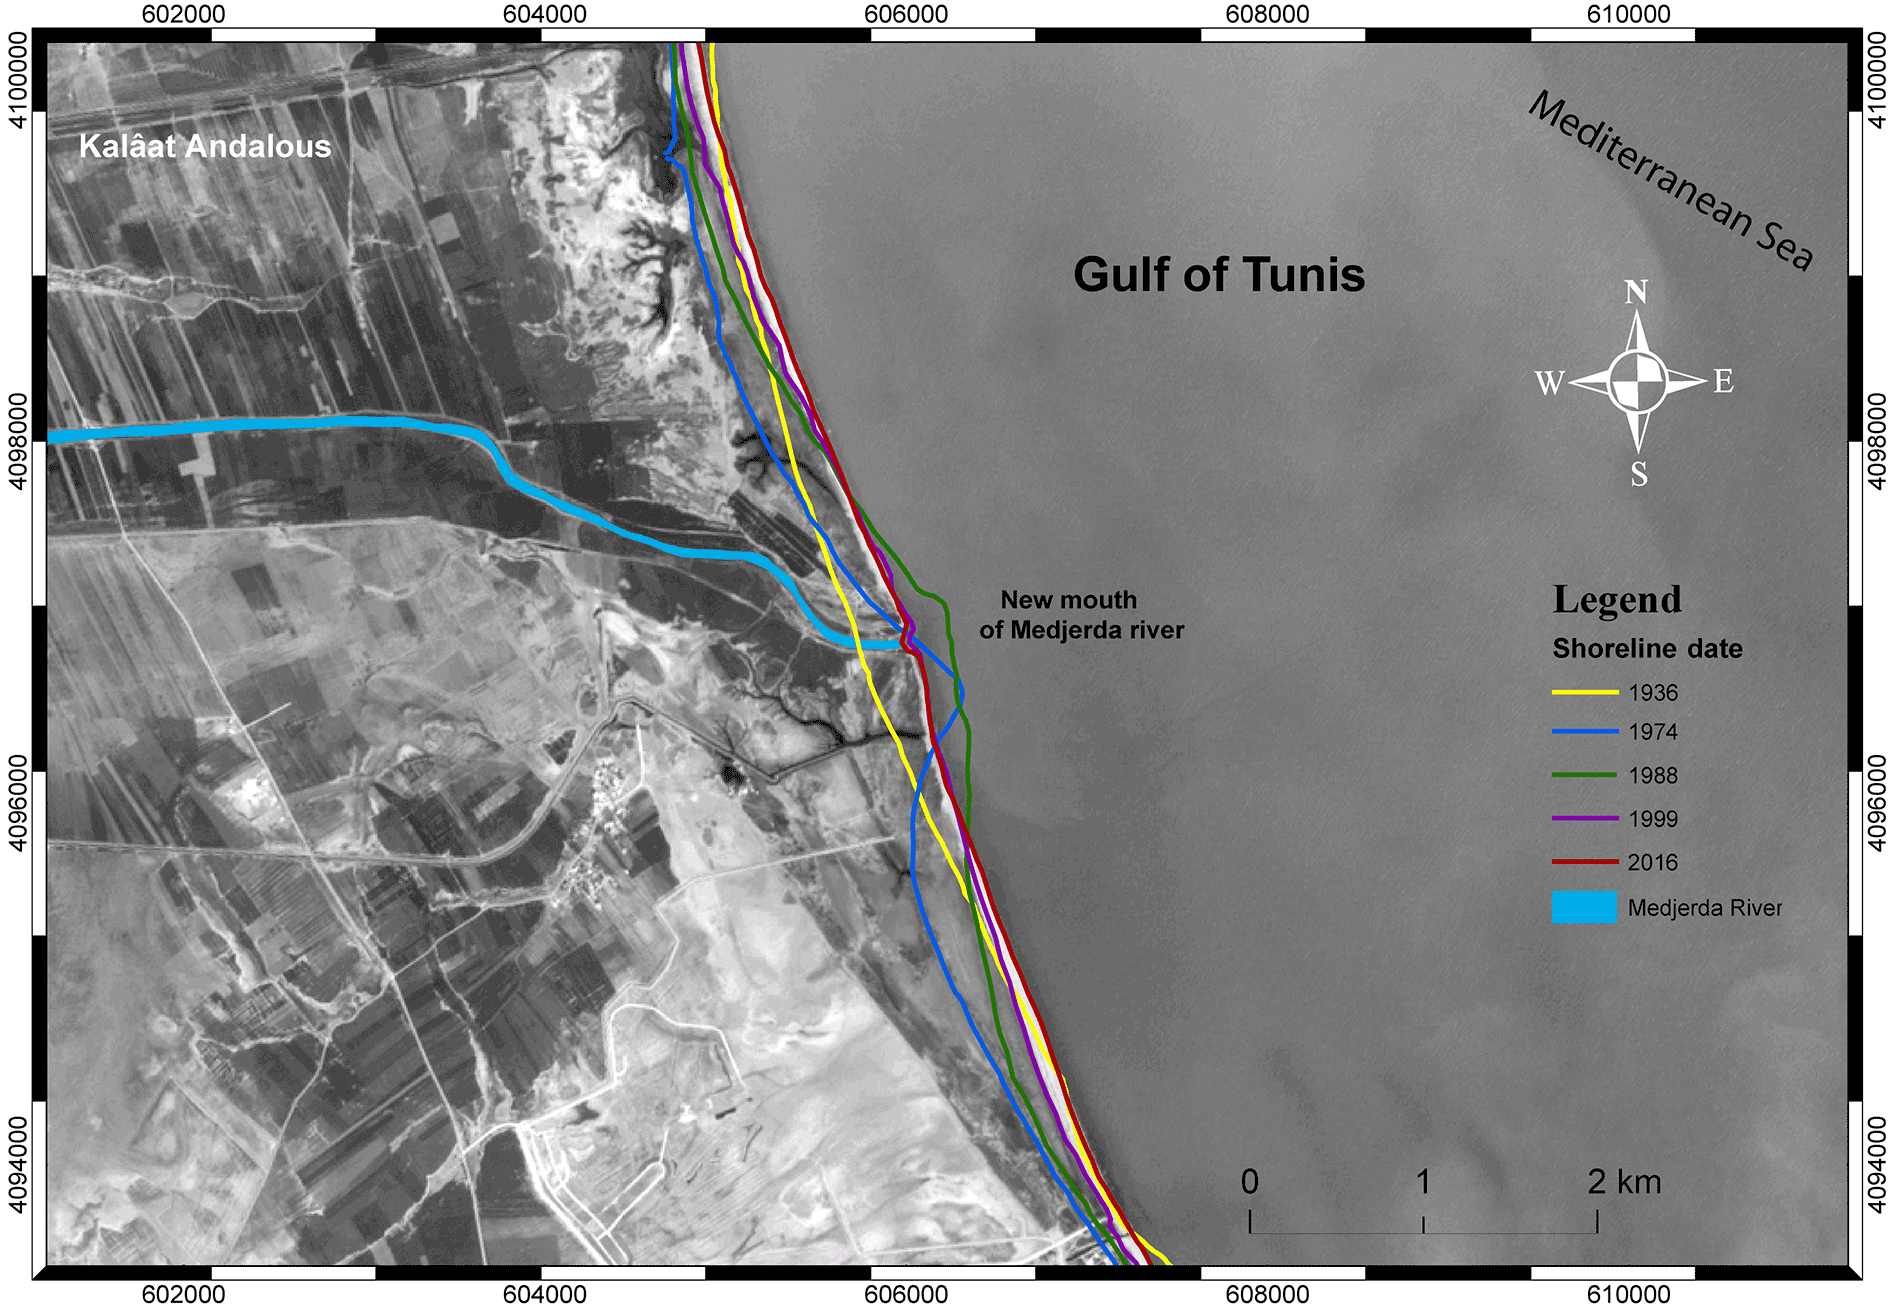
Gulf of Tunis is located in NE of Tunisia and is bordered to the east by Mediterranean Sea, between 37∘10′ N–10∘16′ E (Cape Farina) and 37∘55′ N–10∘18′ E (Cape Gammarth). The western bay of the Gulf of Tunis regular coastline consists in a series of lagoons disposed from north to south: such as Ghar Melah, Kalaât Andalous and Ariana. The coastline has a length of 40 km and is characterized by landforms such as coastlines, sandy features, sandy spit, river mouth deposit and dunes covered by forests.
Tidal range at the study area is low with amplitude of approximately 35 cm (Oueslati, 1993). Mean amplitude of semi-diurnal micro-tidal activities in the Gulf of Tunis measures 12–30 cm (El Arrim, 1996; Saïdi et al., 2012). The Western bay coastal system includes three main sedimentary systems with followed entities: Lagoons of Kalaât Andalous, delta of Medjerda and the coastal foredune of Raoued beach (Fig. 1). The hydrologic regime of the coastline is controlled by the Medjerda river which represents the most important river in Tunisia. During the last century, in the study area, the relative sea level has reached 11.5 mm year−1; part of this value, such as 1.5 mm year−1, has been attributed to eustacy (Pirazzoli, 1986). The spatial variability of sedimentary activities for the coastal system has a significant decline due to erosion processes: in the Medjerda Gammaret area between years 1887–1974, the coastline was registered a retreat rate of 0.12 to 1.11 m year−1, and a decline of 3.73 to 9 m year−1 between 1974 and 2000 (Saïdi et al., 2014).
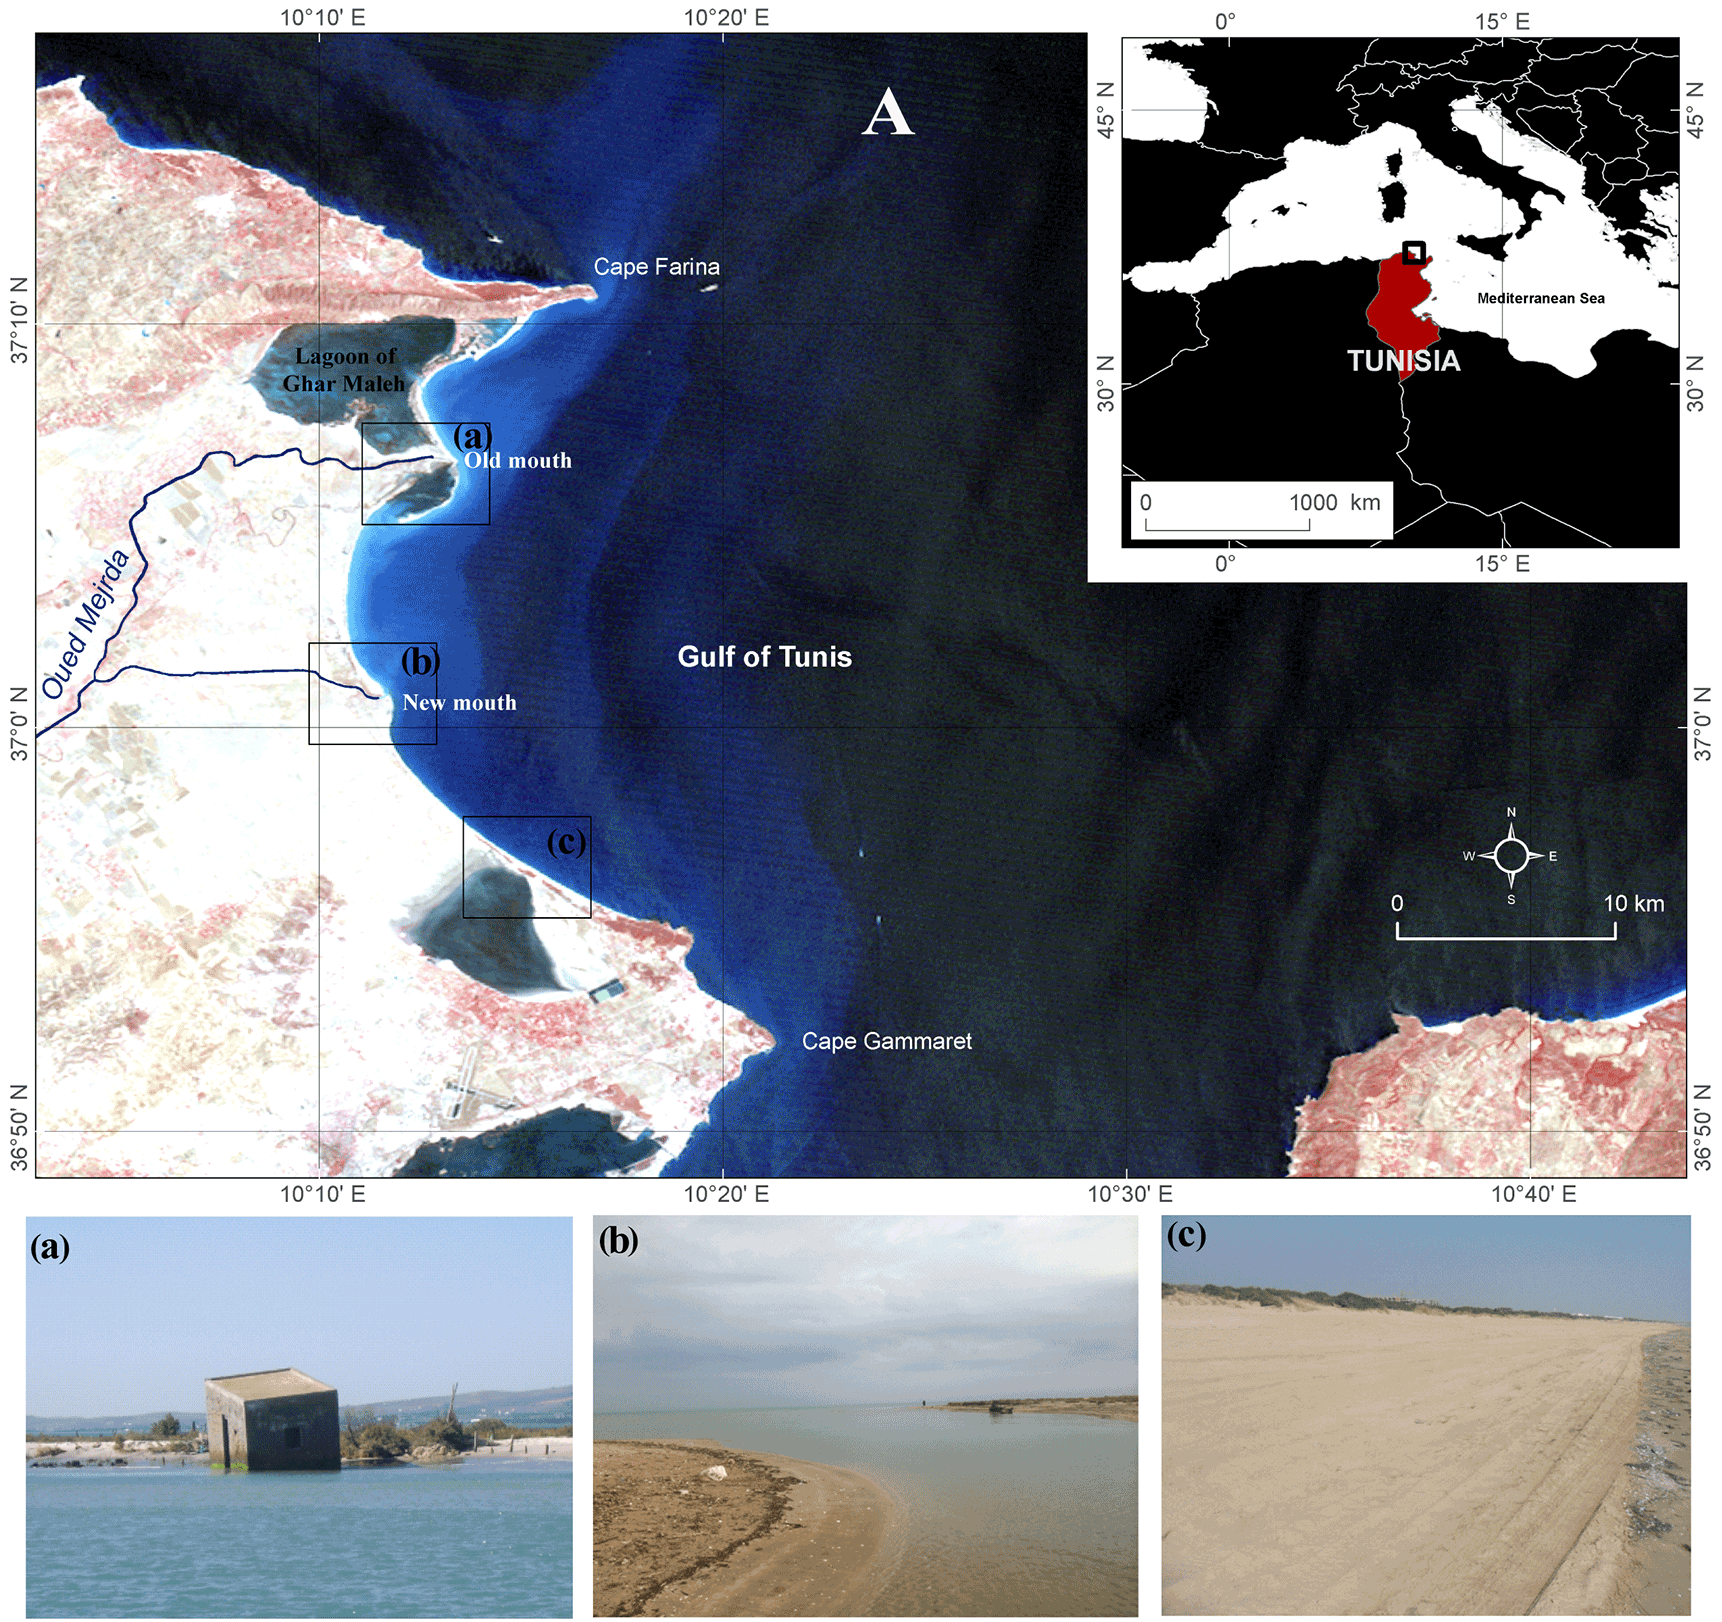
Figure 1(A) Location map of the study site: the bay of Gulf of Tunis (Bay western). (a) Spit of Kalaât Andalous, (b) New mouth of Medjerda river and (c) Raoued beach.
The Medjerda river (western bay) and Méliane river (eastern bay) supplies the most of continental supply for Gulf of Tunis coast. In this case, the impacts of climate change on the sedimentary dynamics of the catchment areas are subject to a very active research for a decade and which emphasise the reduction of fluvial fluxes of the river to the coastal environment of Gulf of Tunis (Arnell, 1999a, b; Oueslati, 2004; Saïdi et al., 2014).
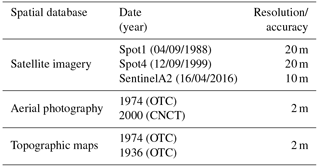
In this study, three cloudless satellite images were used (SPOT1, SPOT4, and Sentinel A2). The shooting time, satellite information, and image resolution of each image are summarized in Table 1. As same resolution data is not available for the desired period but the multi temporal capabilities allow tracking of changes over a long time (80 years).
Pretreatment of imageries consisted in radiometrically and geometrical correction in order to minimize weathering effects on radiometric values (Fig. 2). The satellite imageries (SPOT1, SPOT4, Sentine A2), topographic maps and aerial photographies used in this study were ortho-rectified. The datum of cartographic and satellite and aerial imageries is World Geodetic System (WGS84), and the projected system is Universal Transverse Mercator. Firstly, the atmospheric effect where corrected by providing the dark object subtraction model (Chavez Jr., 1996), to compensate differences in shooting conditions and to calibrate the sensors.

The photo interpretation methods were used in order to draw line features (in vector format) for delineating the coastlines for each year corresponding to products listed in Table 1. Synthetic maps were obtained using ArcGIS 10.2 software. The diachronic synthesis based on shapefiles that contains coastlines had needed to evaluate the coastal dynamics (Robin, 2002).
The all graphical data (vector format) were used to calculate the spatial shoreline evolution using statistics provided by Digital Shoreline Analysis System (DSAS) (Thieler et al., 2009) in order to highlighting the differences between coastline's positions. DSAS tool was used to create transversal transects over coastlines needed to analyse and calculate, in different points, the change rate at the specified time interval (Thieler and Danforth, 1994). For each transect, DSAS provides a calculation of erosion and accretion of shoreline (Bush and Young, 2009). Transects lines were generated automatically using DSAS with followed characteristics: lines with 1 km length placed at 200 m distance between them to study the changes that occurred along the delta of the Medjerda, and the western bay of the Gulf of Tunis (Fig. 3). Baselines can be placed ofshore or onshore of shorelines limit, however a baseline cannot be placed between shorelines. However in our study, the baseline was built offshore and parallel to the general trend of the coastline of gulf of Tunis. Transects will be cast perpendicular to this baseline (200 m spacing) and intersect the shorelines to establish measurement points (Himmelstoss, 2009).
Afterwards, all the shorelines specifically for each studied year were overlaid and spatially compared. During this stage can be emphasis the evolution of the coastline in the studied period. The quantitative and qualitative analysis is based on the statistics methods provided by DSAS, such as Net Shoreline Movement (NSM), End Point Rate (EPR) and Linear Regression (LRR).

Figure 3Shoreline extraction with transect and baseline using satellite imagery and maps in studied area.
The spatial error specific to georeferencing process for different products listed in Table 1 is estimated by the root mean square (RMS) and the maximum value is 2.33 m (Table 2). To calculate the margin of error of our photo-interpretation is based on the report from the USGS (2006) which expressed the calculation of the margin of error Eqs. (2), (3) and (4). However, we will not take into account the error of digitization for the development of the margin of error. In our graphics, we use a margin of error of ±0.15 m year−1. We take into account this type of error for a better comparison.

The temporal data comparison concerning the evolution of shoreline's positions using the statistic's variables, such as NSM and EPR, shows the importance of taking comparison of the temporal series of the evolution of the shoreline position using NSM and EPR statistical technics shows the importance of the different periods in this study.
Based on results it can be emphasis in the study area the presence of three dynamic zones:
- 1.
Kalaât Andalous spit;
- 2.
New mouth of Medjerda river;
- 3.
Raoued beach.
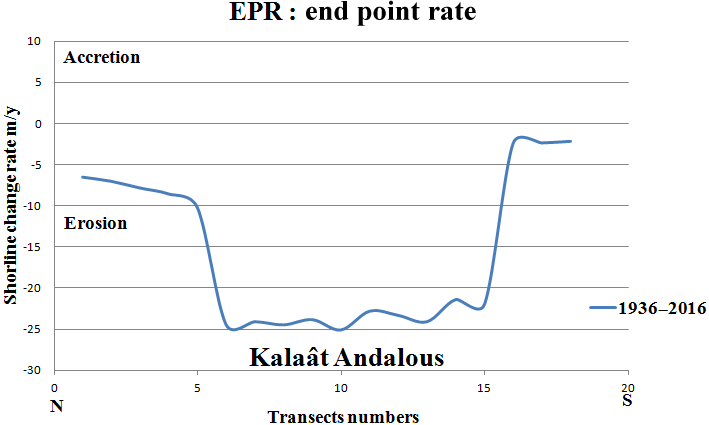
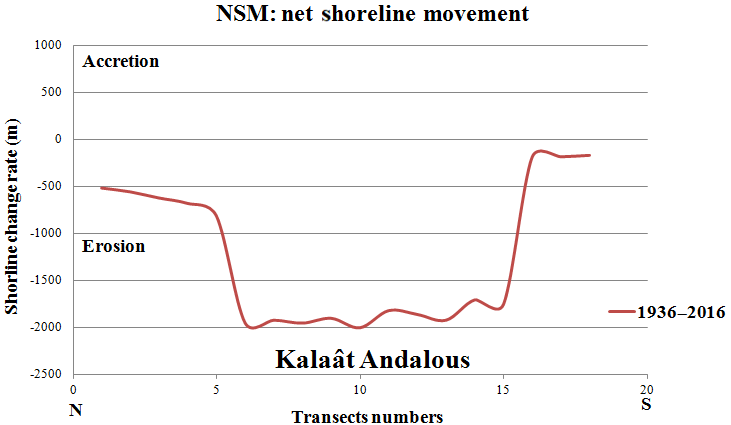
The analyzing of the shoreline changes during 1936 to 2016 can be highlighted that erosion is significant, especially at the Kalaât Andalous spit with a severe erosion of up to −25 ± 0.15 m year−1 (−2 km) (Figs. 4, 5 and 6). Similar observation is reported along this zone coast by Saïdi et al. (2014) and Louati et al. (2014) with maximum rates of retreat respectively −17 ± 2.4 and −20.7 ± 3 m year−1. The decreasing of sediment flow at the old mouth of Medjerda river is generated by deviation of the new channel by hydrotechnical works in 1973. These hydrotechincal works stimulates the waves to erode and to carry out offshore the fluvial sediments from the old delta. The sediments under the effect of the coastal drift disposed on SE/NW direction facilitates the construction of barrier bar i.e. the sand spit of Kalaât Andalous.
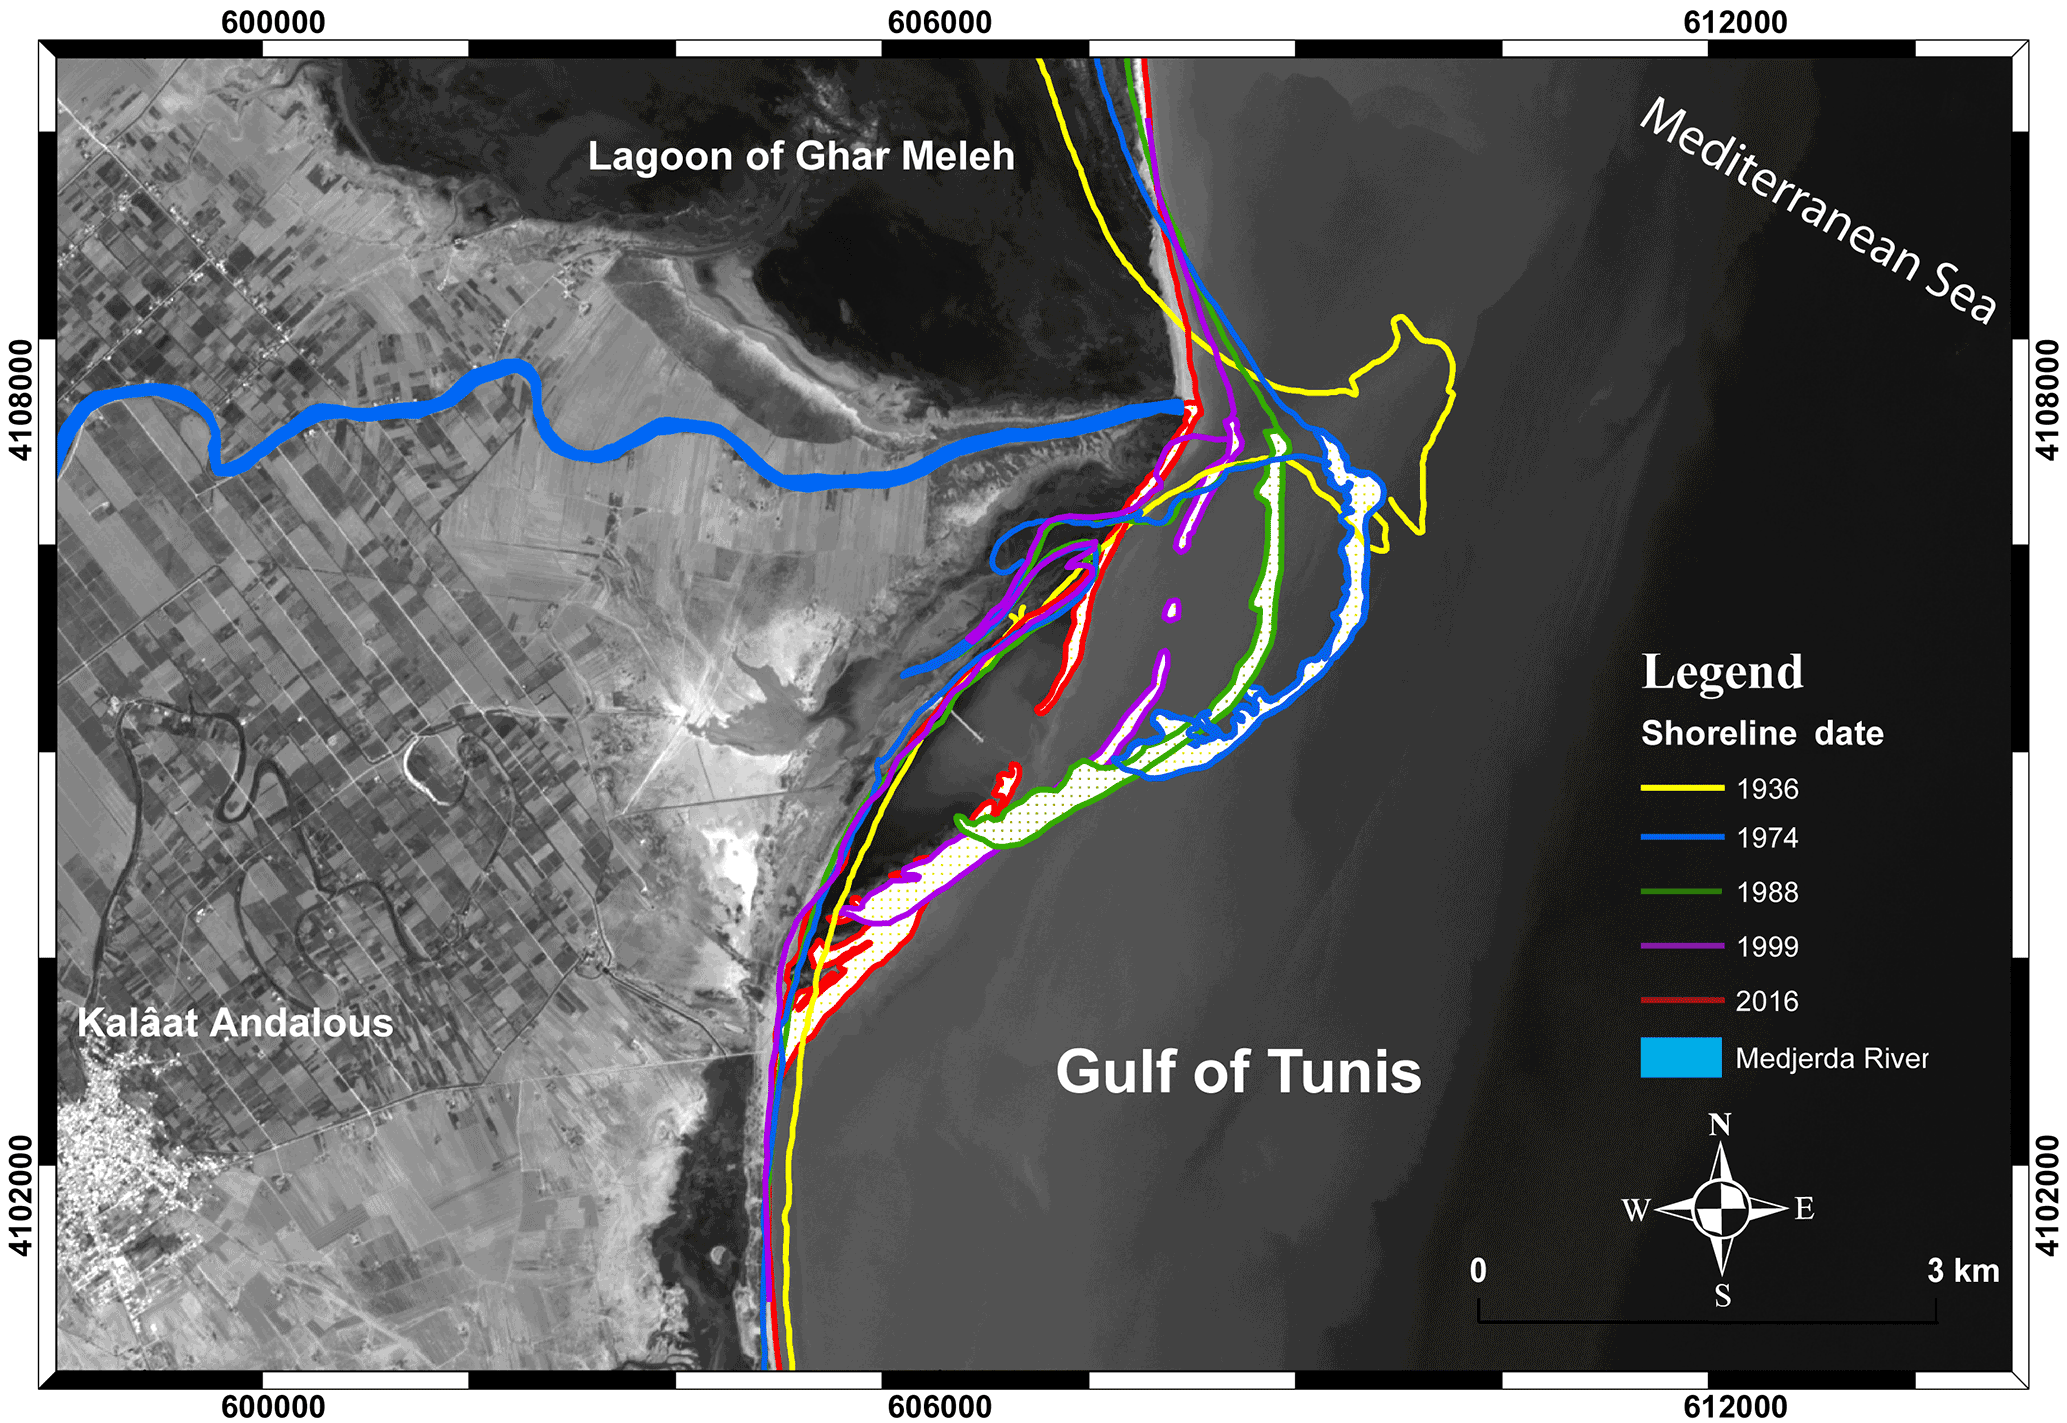
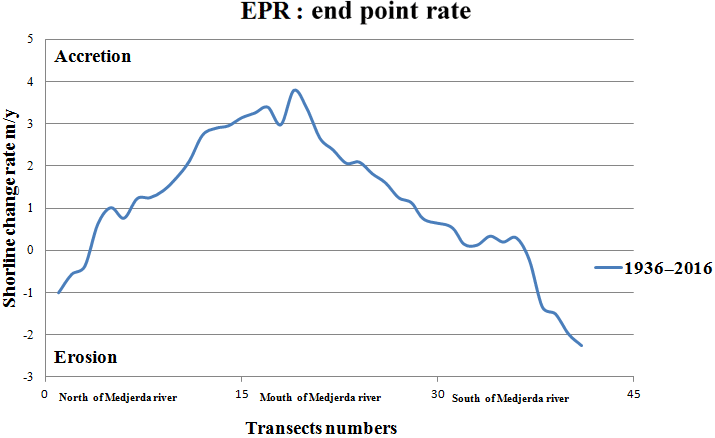
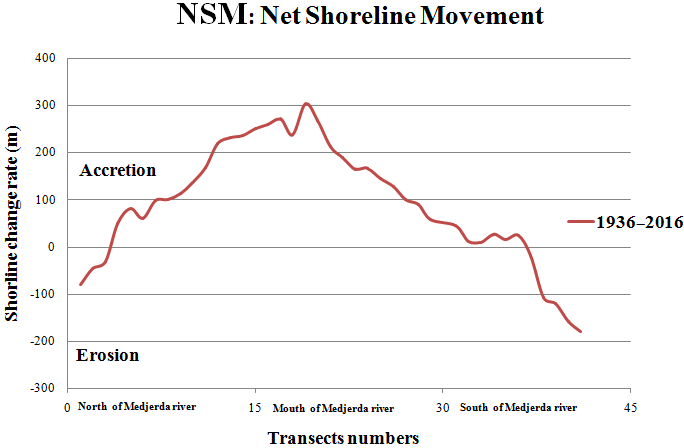
During this period (1936–2016), the accretion is always occurred in the new mouth with a maximum rate of 320 m (+4 ± 0.15 m year−1) (Figs. 7, 8 and 9). During the floods of March 1973, Medjerda river had resorted to a change of bed choosing the channel of Henchir Tobias as an outlet.
The river's spillway is no longer powered by the alluvial contribution of Medjerda river. The results are shrinking beaches and coastal erosion. This phenomenon is evident in the aerial photographs of 1962 (Paskoff, 1985). On the other hand, the rate of accretion of the littoral has been eroded, at the mouth with an average of −1.64 ± 0.15 m year−1. This rate of erosion located at the river's mouth is explained by building of dam construction (El Aroussia in 1957, Bou Heurtma in 1976 and Sidi Salem in 1982) across the new Medjerda river restricts the flow of terrigenous sediments at the level of new mouth of Medjerda river. The Sidi Salem is characterized by a volume capacity of 555 million m3, a surface of 4.3 ha, also being the largest dam in the Tunis. Dam retain the terrigenous sediment discharge to the sea.
Between 1974 and 1988, the speed of advance of the shoreline continued during this period, especially in the mouth area with a maximum of 290 m. El Arrim (1996) reveals that the speed of the shoreline continued at a slower pace which gains of almost 270 m between 1977 and 1987 (El Arrim, 1996 in Oueslati, 2004).
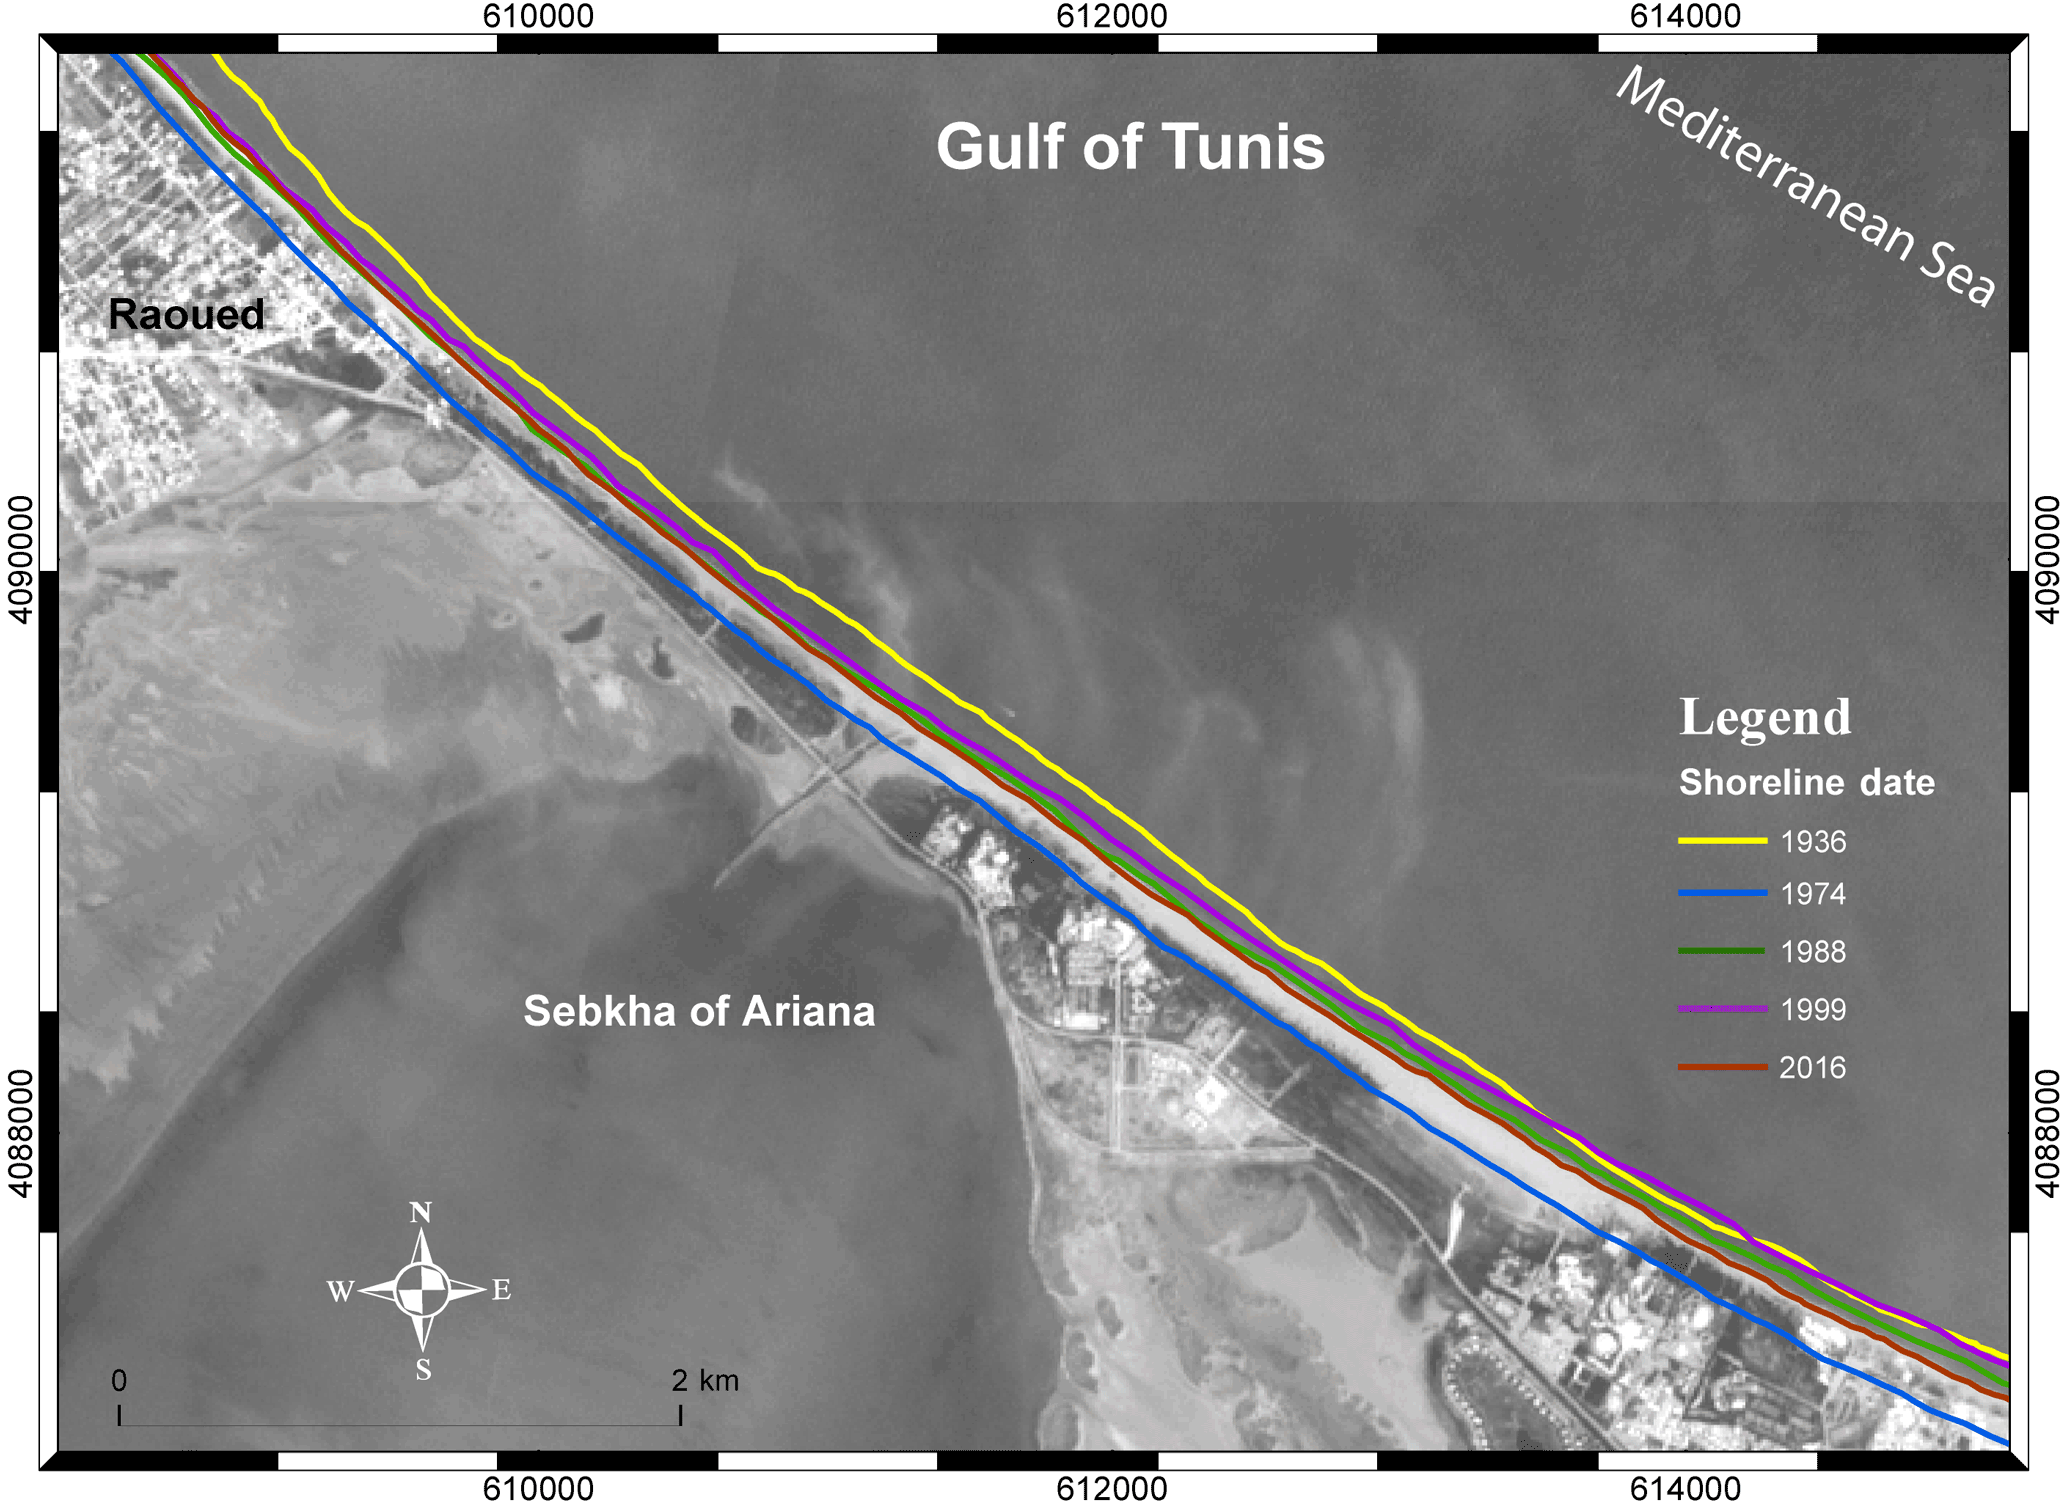
Raoued beach, situated at the south east of the Medjerda delta, is an exceptional case in terms of fragility and management. The status of this area is favored, especially in its western part, by a large alluvial contribution occured by the new mouth of Medjerda river supply.
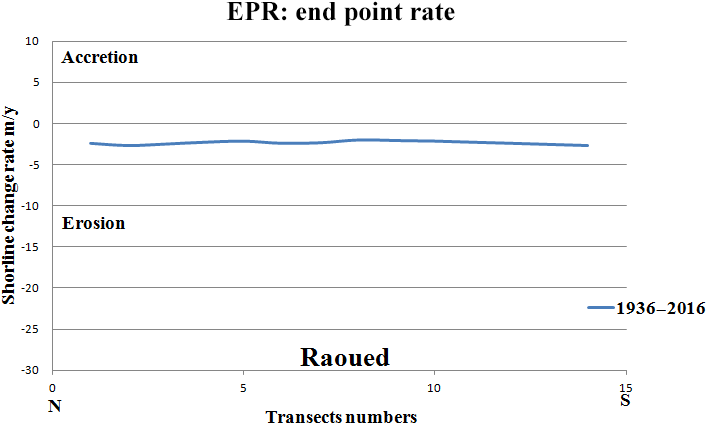
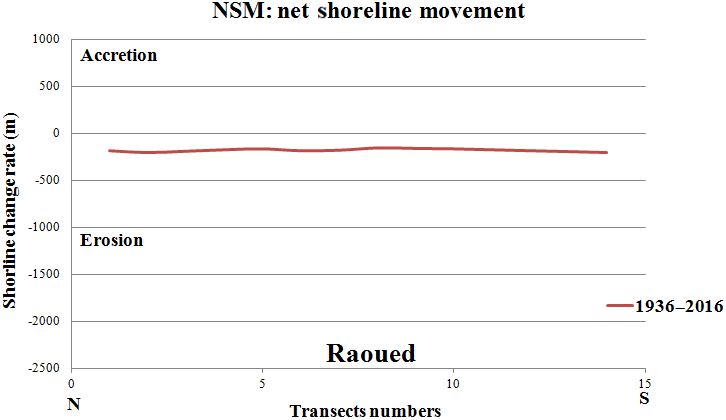
In this sector, we observe that the NSM is different for the two periods (1936–1974 and 1974–2016). Before 1974, this is a zone of erosion range with an average rate of −300 m (−8 ± 0.15 m year−1) (Figs. 10, 11 and 12). This erosion is due both to the effect of the longshore coastal drift from the SE to NW direction and this zone is highly erosional because of its exposure to the strong waves, winds and rip currents of the E to SE in summer, N to NE in winter. After 1974, this sector tends to be deposited, the values of erosion decreased significantly on all zone of Raoued (−2.3 ± 0.15 m year−1). This decrease in erosion rates is due to the deviation of Medjerda river in 1973. The natural river of Medjerda was abandoned, and the entire terrigenous flow now passes through an artificial canal of Henchir Tobias (2 km northern ward Raoued beach).
The main causes of erosion during this period are both related to natural and/or anthropogenic factors, especially by significant reduction of sediment supply caused by construction of numerous dams located in the catchment area of Medjerda river.
The LRR is determined by adjusting a least squares regression line at all the coastline points for a particular transect (Thieler et al., 2009). In the transect 116, the linear regression is the slope of the line with m year−1. This calculation provides the standard error of the slope with the confidence interval of 95 %. Confidence in the analytical results is validated also by comparing this study with other researchers (Oueslati, 2004; Saïdi et al., 2014 and Louati et al., 2014), which indicated a good correlation. In the present study, spatial resolution (20, 10 and 2 m) is acceptable compared to previous studies (Louati and Zargouni, 2009; Louati et al., 2014) in this area using Landsat scenes with a spatial resolution of 30 m, which this increases the error in coastal areas.

The assessment of erosion and accretion processes through the transect lines using DSAS tool, applied on western bay of the Gulf of Tunis, provide valuable statistics upon coastline dynamics in terms of positional changes and in identification of depositional and denudational areas. Based on this study it can be concluded that DSAS will be useful for long-term (1936–2016) qualitative monitoring of shoreline evolution pattern in case lack of field data sources. In the studied period most of the beach underwent erosion (−25 ± 0.15 m year−1 in Kalaât Andalous sandy spits) while some part of the beach follow accretion trend (+4 ± 0.15 m year−1 in new mouth of Medjerda river). The variation of the morphology in the recent Medjerda river mouth was significant as well. The observed patterns of erosion and accretion along the bay shorelines resulted from both natural and human impacts strongly managed by human activities start to be more sensitive and vulnerable to natural erosion processus. Most of the shoreline was exposed to natural erosion processes induced by waves, tides and periodic storm surge. This study extends the analysis period by three years compared to the study conducted by Louati et al. (2014).
Spot image: two images were provided by the laboratory of hydroscience Montpellier, in the project RYSCMED and were used in this work after the acceptance of the “ISIS” file.
Sentinel image: the Copernicus Open Access Hub (previously known as Sentinels Scientific Data Hub) provides complete, free and open access to Sentinel A2 (https://scihub.copernicus.eu/).
The authors declare that they have no conflict of interest.
This article is part of the special issue “Water quality and
sediment transport issues in surface water”. It is a result of the IAHS
Scientific Assembly 2017, Port Elizabeth, South Africa, 10–14 July 2017.
Edited by: Gil Mahe
Reviewed by: two anonymous referees
Arnell, N. W.: A simple water balance model for the simulation of streamflow over a large geographic domain, J. Hydrol., 217, 314–335, 1999a.
Arnell, N. W.: The effect of climate change on hydrological regimes in Europe: a continental perspective, Global Environ. Chang., 9, 5–23, 1999b.
Bush, D. M. and Young, R.: Coastal Features and Processes, in: Geological Monitoring, edityed by: Young, R. and Norby, L., Geological Society of America, Colorado, 47–67, 2009.
Chavez Jr., P. S.: Image-based atmospheric corrections. Revisited and improved, Photogramm. Eng. Rem. S., 62, 1025–1036, 1996.
Dolan, R., Hayden, B., May, P., and May, S.: The reliability of shoreline change measurements from aerial photographs, Shore and Beach, 48, 22–29, 1980.
El Arrim, A.: Etude d'impact de la dynamique sédimentaire et des aménagements sur la stabilité du littoral du golfe de Tunis, Thèse de Doctorat de Spécialité, Géologie, Faculté des Sciences de Tunis, p. 208, 1996.
Halouani, N., Fathallah, S., and Gueddari, M.: Beach and nearshore morphodynamic changes of the Tabarka coast, Northwest of Tunisia, Environmental Earth Sciences, 66, 1059–1069, 2011.
Halouani, N., Gueddari, M., and Frihy, O.: The Northwestern Mediterranean coast of Tunisia: wave processes, shoreline stability and management implications, Arabian Journal of Geosciences, 38, 1851–1860, 2013.
Himmelstoss, E. A.: DSAS 4.0 Installation Instructions and User Guide, in: 2009 Digital Shoreline Analysis System (DSAS) version 4.0 – An ArcGIS extension for calculating shoreline changes, edited by: Thieler, E. R., Himmelstoss, E. A., Zichichi, J. L., and Ergul, A., U.S. Geological Survey Open-File Report 2008-1278, 2009.
Louati, M. and Zargouni, F. : Modélisation topo-bathymétrique et transit sédimentaire. Exemple des plages sableuses de la baie de Tunis, Nord-Est de la Tunisie, Géomorphologie: relief, processus, environnement 3, 211–222, 2009.
Louati, M. and Zargoun, F.: Le littoral entre l'actuelle embouchure de l'oued Milianeet Soliman, Tunisie. Analyse de l'évolution du trait de côte par photo-interprétation et système d'information géographique, Géomorphologie: relief, processus, environnement, 19, 209–224, 2013.
Louati, M., Saïdi, H., and Zargouni, F.: Shoreline change assessment using remote sensing and GIS techniques: a case study of the Medjerda delta coast, Tunisia, Arabian Journal of Geosciences, 8, 4239–4255, https://doi.org/10.1007/s12517-014-1472-1, 2014.
Mujabar, P. S. and Chandrasekar, N.: Shoreline change analysis along the coast between Kanyakumari and Tuticorin of India using remote sensing and GIS, Arabian Journal of Geosciences, 6, 647–664, 2013.
Oueslati, A.: Les côtes de la Tunisie: géomorphologie et environnement et aptitudes à l'aménagement, Série 2, Publication de la Faculté des Sciences humaines et sociales de Tunis, Géographie, Université de Tunis I., 1993.
Oueslati, A.: Littoral et aménagement en Tunisie Orbis, Tunis, 534 pp., 2004.
Oueslati, A.: Plages et urbanisation en Tunisie: des avatars de l'expérience du xxe siècle aux incertitudes de l'avenir, Méditerranée, https://doi.org/10.4000/mediterranee, 115, 103–116, 2010.
Oyedotun, T. D. T.: Shoreline geometry: DSAS as a tool for historical trend analysis, in: Geomorphological Techniques, British Society for Geomorphology, UK, 12 pp., avalable at: http://geomorphology.org.uk/sites/default/files/geom_tech_chapters/3.2.2_ShorelineGeometry.pdf, last access: 11 November 2014.
Oyedotun, T. D. T.: Historical Shoreline Changes as Indication of Geomorphic Phases in St Ives and Padstow Bays of Southwest England, Environmental Processes, 4, 273–282, https://doi.org/10.1007/s40710-017-0213-3, 2017.
Pirazzoli, P. A.: Secular trends of relative sea level change indicated by tide gauge record, J. Coastal Res., S1, 1–26, 1986.
Paskoff, R.: Géographie de l'environnement: problèmes d'utilisation des ressources et d'adaptation aux contraintes des milieux naturels: exemples tunisiens, Université de Tunis, 227 pp., 1985.
Paskoff, R.: Tunisia, in: Artificial structures and shorelines, 1st Edn., edited by: Walker, H. J., Springer, Dordrecht, The GeoJournal Library, 10, 269–271, 1988.
Robin, M.: Remote sensing, from satellites to GIS. A comprehensive analysis of the process of creating an essential type of geographic information, Nathan University, 318 pp., 2002.
Saïdi, H., Souissi, R., and Zargouni, F.: Impact of shore-parallel breakwaters on the micotidal coast of Hammam-Lif (North-East of Tunisia), Arabian Journal of Geosciences, 5, 345–352, 2012.
Saïdi, H., Souissi, R., and Zargouni, F.: Grain size characteristics of superficial sediments of the Gulf of Tunis (NE Tunisia), Arabian Journal of Geosciences, 7, 3365–3387, https://doi.org/10.1007/s12517-013-1008-0, 2013.
Saïdi, H., Souissi, R., Louati, M., and Zargouni, F.: Morphologic changes and sedimentary budgets along a Mediterranean coastline with a sand spit: case of the littoral fringe Sidi Ali El Mekki-Gammarth (NE Tunisia), Rend. Fis. Acc. Lincei, 25, 393, https://doi.org/10.1007/s12210-014-0314-0, 2014.
Thieler, E. R. and Danforth, W. W.: Historical shoreline mapping (II): application of the Digital Shoreline Mapping and Analysis Systems (DSMS/DSAS) to shoreline change mapping in Puerto Rico, J. Coastal Res., 10, 600–620, 1994.
Thieler, E. R., Himmelstoss, E. A., Zichichi, J. L., and Ergul, A.: Digital Shoreline Analysis System (DSAS) version 4.0 – An ArcGIS extension for calculating shoreline change: U.S. Geological Survey Open-File Report 2008-1278, current version 4.3, available at: https://woodshole.er.usgs.gov/project-pages/DSAS/version4/ (last access: September 2017), 79 pp., 2009.
Thinh, N. and Hens, L.: A Digital Shoreline Analysis System (DSAS) applied on mangrove shoreline changes along the Giao Thuy Coastal area (Nam Dinh, Vietnam) during 2005–2014, Vietnam Journal of Earth Sciences, 39, 87–96, https://doi.org/10.15625/0866-7187/39/1/9231, 2017.