the Creative Commons Attribution 3.0 License.
the Creative Commons Attribution 3.0 License.
Water impacts and water-climate goal conflicts of local energy choices – notes from a Swedish perspective
Rebecka Ericsdotter Engström
Mark Howells
Georgia Destouni
To meet both the Paris Agreement on Climate Change and the UN Sustainable Development Goals (SDGs), nations, sectors, counties and cities need to move towards a sustainable energy system in the next couple of decades. Such energy system transformations will impact water resources to varying extents, depending on the transformation strategy and fuel choices. Sweden is considered to be one of the most advanced countries towards meeting the SDGs. This paper explores the geographical origin of and the current water use associated with the supply of energy in the 21 regional counties of Sweden. These energy-related uses of water represent indirect, but still relevant, impacts for water management and the related SDG on clean water and sanitation (SDG 6). These indirect water impacts are here quantified and compared to reported quantifications of direct local water use, as well as to reported greenhouse gas (GHG) emissions, as one example of other types of environmental impacts of local energy choices in each county. For each county, an accounting model is set up based on data for the local energy use in year 2010, and the specific geographical origins and water use associated with these locally used energy carriers (fuels, heat and electricity) are further estimated and mapped based on data reported in the literature and open databases. Results show that most of the water use associated with the local Swedish energy use occurs outside of Sweden. Counties with large shares of liquid biofuel exhibit the largest associated indirect water use in regions outside of Sweden. This indirect water use for energy supply does not unambiguously correlate with either the local direct water use or the local GHG emissions, although for the latter, there is a tendency towards an inverse relation. Overall, the results imply that actions for mitigation of climate change by local energy choices may significantly affect water resources elsewhere. Swedish counties are thus important examples of localities with large geographic zones of water influence due to their local energy choices, which may compromise water security and the possibility to meet water-related global goals in other world regions.
- Article
(945 KB) - Full-text XML
-
Supplement
(493 KB) - BibTeX
- EndNote


Increased emphasis on local action for global change in the sustainability discourse encourages efforts of sub-national authorities to prioritize sustainability (Theobald et al., 2015; Wamsler et al., 2014; Xue and Tobias, 2015, among others). International initiatives to promote local sustainability still tend to focus on local production-based resource uses and emissions (Covenant of Mayors, 2017). However, trade-related environmental impacts are now increasingly analysed through e.g. concepts of water footprint and life-cycle, and tracking of consumption-based (as opposed to more common production-based) greenhouse gas (GHG) emissions (Mekonnen and Hoekstra, 2010; Gerbens-Leenes et al., 2012; Tukker, 2000; Stokes and Horvath, 2010; Caro et al., 2017; Yang et al., 2015). Moreover, in the wake of the adoption of the UN Sustainable Development Goals (SDGs) in 2015, the need for integrated and cross-scale coordination of sustainability actions is increasingly acknowledged (Nilsson et al., 2016, among others).
Two SDGs with particularly strong interactions are those focused on water (SDG 6) and energy (SDG 7). Both resources are crucial for human survival and prosperity, and both need to be managed more sustainably in the coming decades in order for the world to meet the related SDGs (Griggs et al., 2017). Direct (at the energy utility) and indirect (throughout the whole energy supply chain) uses of water for electricity production have been shown to be significant, not only on local but also on, regional continental and global scale (Destouni et al., 2013; Jaramillo and Destouni, 2015). The water-energy nexus has also been increasingly studied in the past decade (among many others: Hamiche et al., 2016; Hussey and Pittock, 2012; Bazilian et al., 2011; Scott et al., 2011). The ability to accurately assess both direct-local and indirect-remote interactions of water and energy uses will only increase in importance as local actors move towards implementing the SDGs. The present study addresses this water-energy nexus on different scales.
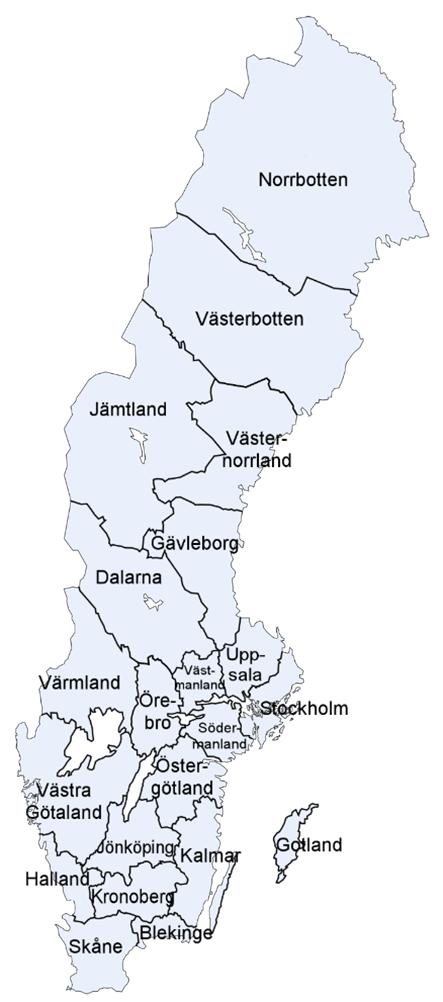
Specifically, we here quantify and analyse energy-related indirect-remote water use, i.e. the water-use required for extracting, processing, transforming and supplying energy for local use, using the 21 counties of Sweden as concrete case examples of such local energy use; Fig. 1 displays the 21 counties on the map of Sweden. In general, Sweden is considered to be the most advanced country towards meeting the SDGs (Sachs et al., 2016). As such, the present case study focus on and across different Swedish counties may provide some important insights on relatively advanced water-impact patterns associated with local energy choices towards long-term sustainability. The analysis is further broadened, to also consider the climate-related SGD (13), by relating the water-energy nexus results to the officially reported GHG emissions of each county.
The used data and obtained results of this study (direct water use, GHG emissions, and calculated energy-related indirect water use) are not overlapping in scope (the latter includes trade impacts, while the former two relate only to local activities). This scope inconsistency is intentional, in order to clarify the difference between data that are readily available for – and directly relate to the mandate of – county-level decision-makers (reported local direct water use and GHG emissions) and the indirect energy-related water impacts (indirect-remote water use for energy supply) that are calculated in this study and are significant for achievement of global sustainability.
In the following sections, the analytical approach and data sources are described, followed by presentation and discussion of results and main conclusions.
2.1 Analytical approach
In the present analysis, a simple accounting framework is employed to assess the water impacts of the energy choices of different Swedish counties. The following steps are taken for this purpose:
-
Step 1: a literature review of reported water-consumption estimates for energy production including: water footprints of biofuels; consumptive water-use of electricity generation (incl. hydropower) and; water use in fossil-fuel production processes (mining, refining and distribution) (the terms used here correspond to those used in the reviewed literature).
-
Step 2: multiplication of water factors, calibrated for Swedish energy-supply specificity after the general Step 1, with disaggregated energy end-use by sector and fuel-type for each of Sweden's 21 counties (accounting also for energy transmission losses – see Supplement for further methodological details).
-
Step 3: disaggregation of indirect water-use between national and international, in order to assess the energy-related water use occurring outside of Sweden (and as such outside the nation's sustainability-reporting boundaries).
-
Step 4: comparison of results with reported county-specific GHG emissions and direct water use.
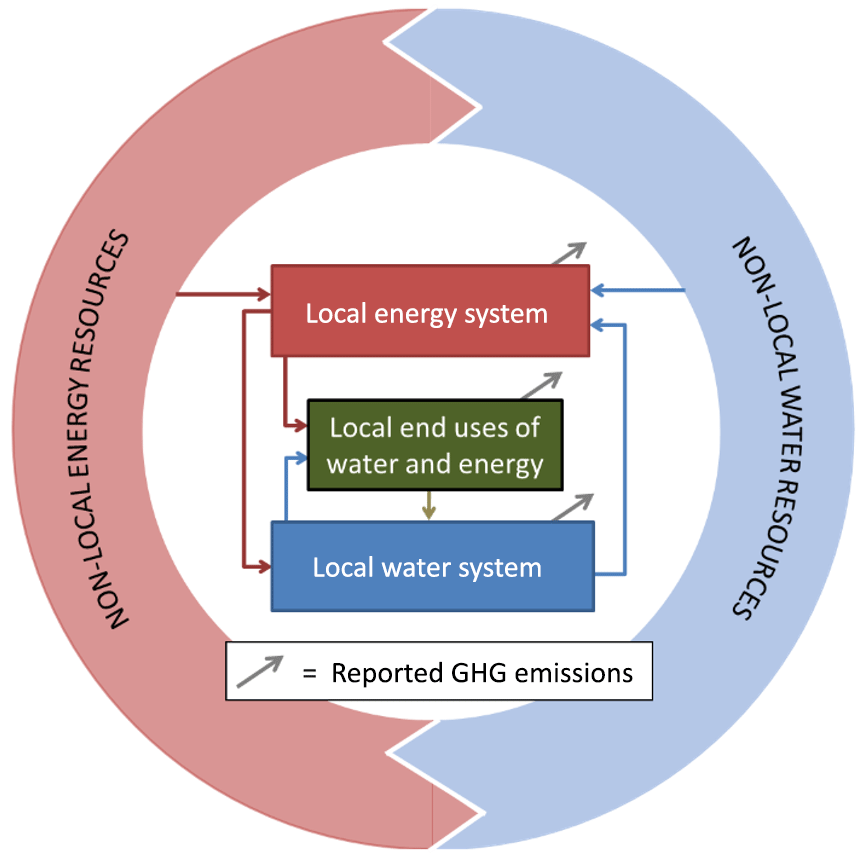
Only freshwater use is considered in this analysis, in terms of both direct and indirect water uses. Seawater, often used in e.g. cooling systems of nuclear power plants (Vattenfall, 2016), is excluded from the analysis since this water resource is not included in the water-related SDG (6) and also is not subject to similar availability constraints as the freshwater resource. A schematic of the system-of systems considered in this study is depicted in Fig. 2.
2.2 Data sources
Overall, official county-level data for the year 2010 is used in the present analysis, and water-use results for various energy choices are compared with official statistics on county-specific direct water use and GHG emissions for the same year. The GHG emission data are taken from the Swedish County Board Union's yearly report on airborne emissions (Nationella emissionsdatabasen, 2017). Direct water-use data are collected and published every 5th year by the Swedish Central Bureau of Statistics (SCB) and for this paper tables MI0902AB and 0000000V are used (SCB Statistikdatabasen, 2017). Available SCB data (table EN0203AE) are also used for county-specific energy use, disaggregated over fuel types (liquid fossil, solid renewables, electricity, district heat, etc.) and over user groups (residential buildings, industry, public sector, etc.) (SCB Statistikdatabasen, 2017).
Data on water use for energy supply
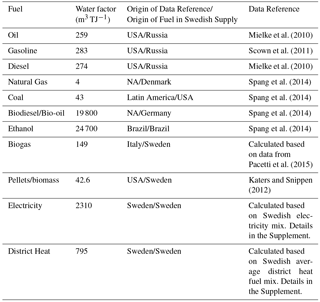
The water-energy nexus of fuel production and electricity and heat generation has been extensively studied in recent years (e.g. Bakken et al., 2013; EPRI, 2008; Holland et al., 2015; Macknick et al., 2012). Still, reported data vary greatly with geographical and technical conditions for the energy systems assessed, and also due to large variation in methods used to measure or indirectly analyse water use. The need to improve both data availability and data standards in this field has been stressed by, among others, Macknick et al. (2012). Awaiting more such efforts to been made, this study uses available data “at face value”, in the attempt to gain insights on patterns and orders of magnitude, while acknowledging the dependence of results on such greatly varying and uncertain data. For the present analysis, a database on published water factors (in units of water volume per energy-unit produced) is created based on the following studies and reports: Mielke et al. (2010); Pacetti et al. (2015); Gerbens-Leenes et al. (2008); Scown et al. (2011); Granit and Lindström (2010); Mekonnen et al. (2015); Fthenakis and Kim (2010); Katers et al. (2012); Rio Carrillo and Frei (2009); Spang et al. (2014); IEA (2012). Considering the geographical origins as well as the types of fuels (conventional or unconventional fossil fuels, first or second generation biofuels, etc.) used in Sweden, the data points that most closely resemble Swedish conditions are selected from this database for the present analysis. Table 1 summarizes the water factors chosen for the analysis.
Figures 3 and 4 display the calculated indirect water-use requirements for the energy supply in the 21 counties of Sweden, in absolute and per-capita terms, respectively. The size of circles in these graphs corresponds to the relative volume of energy-related indirect freshwater use, with the x axis representing reported county emissions of GHGs and the y axis representing county-specific direct local water-use.
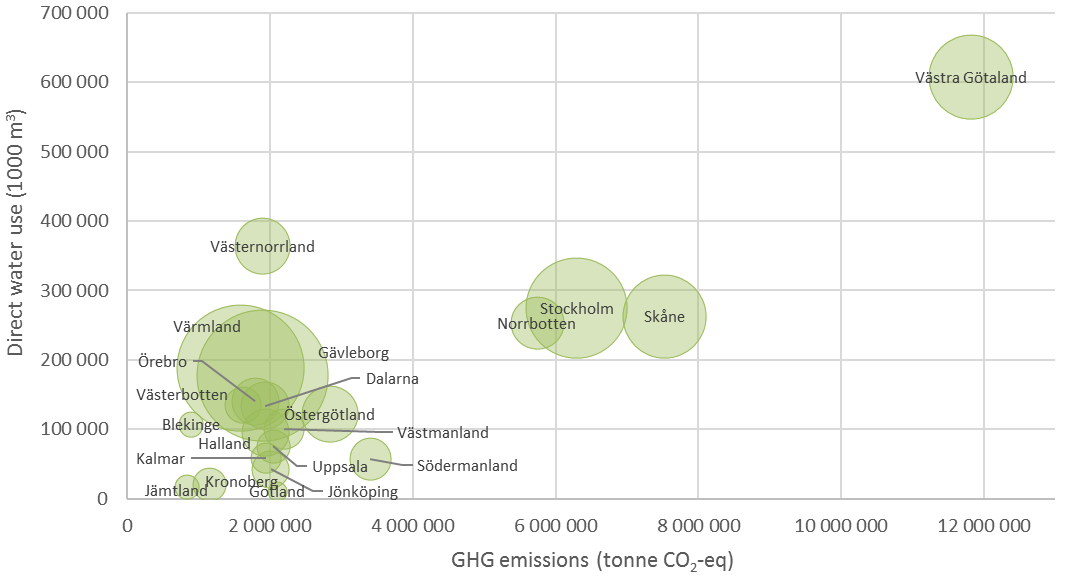
Figure 3Absolute GHG emissions (x axis), direct local water use (y axis) and indirect water use for energy supply (circle size) in the 21 counties of Sweden. Circle size corresponds to million cubic meters of water required to produce the energy supply in each county. For reference: Värmland = 480 million m3; Västra Götaland = 216 million m3; Blekinge = 19.6 million m3. Zoomed in chart in Supplement.

Figure 4Per-capita GHG emissions (x axis), per-capita direct local water use (y axis) and per-capita indirect water use for energy supply (circle size) in the 21 counties of Sweden. Circle size corresponds to per-capita cubic meters of water indirectly used to produce the energy supply in each county. For reference: Värmland = 1756 m3 cap−1; Gotland = 200 m3 cap−1; Blekinge = 128 m3 cap−1. Zoomed in chart in Supplement.
In terms of absolute values (Fig. 3), the most populous counties (Stockholm, Skåne and Västra Götaland) have the largest reported GHG emissions, as well as most of the largest reported direct water uses. However, also the county of Norrbotten (in terms of emissions) and that of Västernorrland (in terms of direct water use) display high absolute resource uses despite having much smaller populations. Västernorrland has the most water-intensive industry in Sweden, while Norrbotten is the county using the most coal of all Swedish counties in 2010, with thereby high associated GHG emission levels. These latter two counties stand out even more clearly in Fig. 4, where results are displayed in terms of per-capita units. In addition, the county with the smallest population, Gotland, stands out as the county with the highest per capita GHG emissions, due to significant fossil GHG emissions from the county's lime and cement industries (Region Gotland, 2016). However, the direct local water use in Gotland is limited, with this being a Swedish county that is particularly prone to water shortages and droughts.
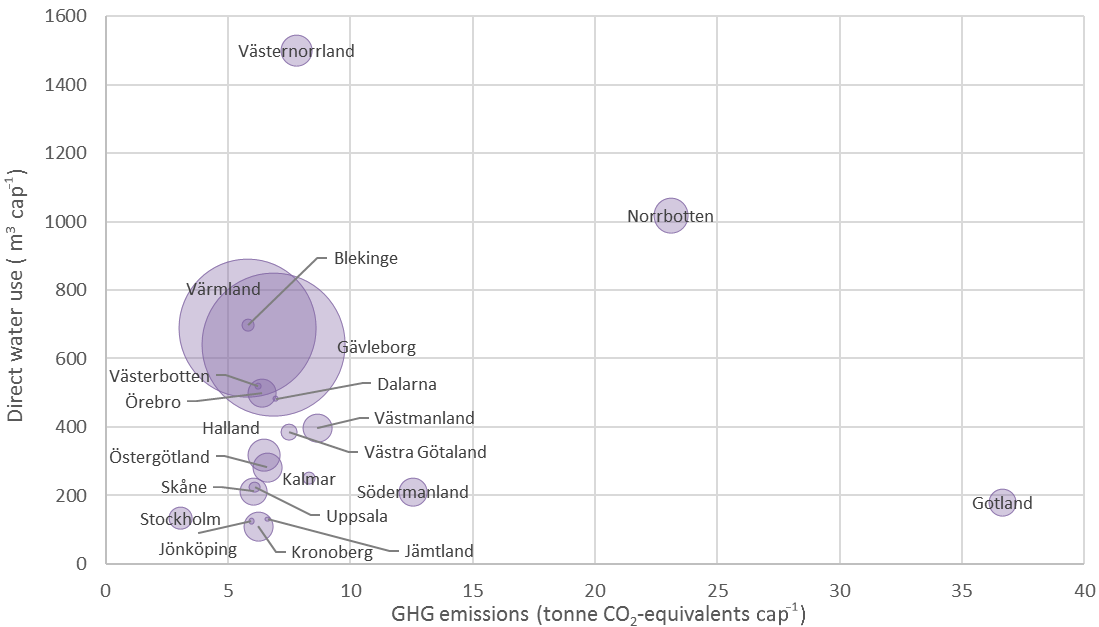
Figure 5“Imported” indirect water use outside of Sweden related to the population (per-capita units) and the energy use in the 21 counties of Sweden, compared to reported direct water use per capita (y axis) and GHG emissions per capita (x axis). Circle size corresponds to per capita cubic meters of water indirectly used outside the national borders to produce the energy supply in each county. Note: For reference: Värmland = 1581 m3 cap−1; Gotland = 62 m3 cap−1; Blekinge = 13 m3 cap−1. Zoomed in chart in Supplement.
Looking further at the results of indirect water use for energy supply (circle sizes in Figs. 3 and 4), the pattern differs from both that of reported GHG emissions and that of reported direct water use. Most notable here are the counties of Värmland and Gävleborg, with significantly larger energy-related indirect use of water than that of other Swedish counties. The reason is that the industries in Värmland and Gävleborg use large volumes of renewable liquid fuels (assumed to correspond to biodiesel or bio-oil in Table 1). As shown in Table 1, these fuels consume 70–90 times more water per unit of energy than corresponding liquid fossil fuels (and this is a modest water-use estimate compared to those of Gerbens-Leenes et al., 2009; IEA, 2012; among others).
Gotland's indirect per-capita use of water does not follow the pattern of its per-capita emissions of GHGs. As mentioned, this county has a relatively high share of fossil GHG emissions but uses almost no liquid biofuels. This choice makes the county's energy use relatively water efficient.
In Fig. 5, the national (Swedish) indirect water use (for fuel, electricity and heat production within Sweden) is removed from the results. This exacerbates the pattern seen in Fig. 4, exhibiting Gävleborg and Värmland as responsible for an even larger share of Sweden's indirect (imported) energy-related water use (Fig. 5). This is not surprising given the large water requirements of imported liquid biofuels (in the present study, no domestic liquid biofuels are considered available). It also emphasizes the large discrepancy that may prevail between the direct water use in local service-delivery systems and the non-local and indirect water use required for the local energy supply.
If direct water use were a good indicator of total water use (including indirect water from energy imports), the size of the circles in Figs. 3–5 should generally increase along the y axis, which is not the case. Similarly, and even though both water use and GHG emissions are tightly linked to the energy sector, the levels of GHG emissions are not correlated with the remote and indirect water use for the local energy supply (as circle sizes do not systematically increase (or decrease) along the x axis).
For further analysis of the joint water-use and GHG connections to energy, Fig. 6 displays all discussed water-use and emission results, as well as the total energy use in each county. Värmland and Västernorrland are then found to have similar profiles of per-capita energy use and per-capita GHG emissions (boxed part of Fig. 6). However, their indirect per-capita water uses for energy are far apart. In Värmland, the chosen low-carbon energy use consists to large degree of liquid biofuels, while the per-capita energy use of Västernorrland includes primarily electricity and biomass – two fuels that consume much less water than imported liquid biofuels. These different choices explain some of the discrepancy seen in Fig. 6 for indirect water-use per capita. However, in this context, it is again worth noting that the used data on energy-related GHG emissions and the calculated data on indirect water use have different scopes of measure. The former (GHG data) include local emission sources, including burning of fuels in vehicles and in electricity- and heat-production utilities, etc., locally as well as local non-combustion/energy related emissions from agriculture, waste facilities and similar. The latter (data on water use for energy supply) consider only the energy sector and the energy use in each county, including the full energy supply chain, both local and non-local. Although we can largely explain the patterns of GHG emissions and of indirect water use by investigating the specific mix of fuels used in a county, there is no unambiguous pattern of e.g. low (high) emissions corresponding to high (low) indirect water use. With that said, if Värmland's industries had chosen to use fossil fuels instead of biofuels, one would expect higher GHG emission levels in the county and lower indirect water use associated with the county's energy supply.
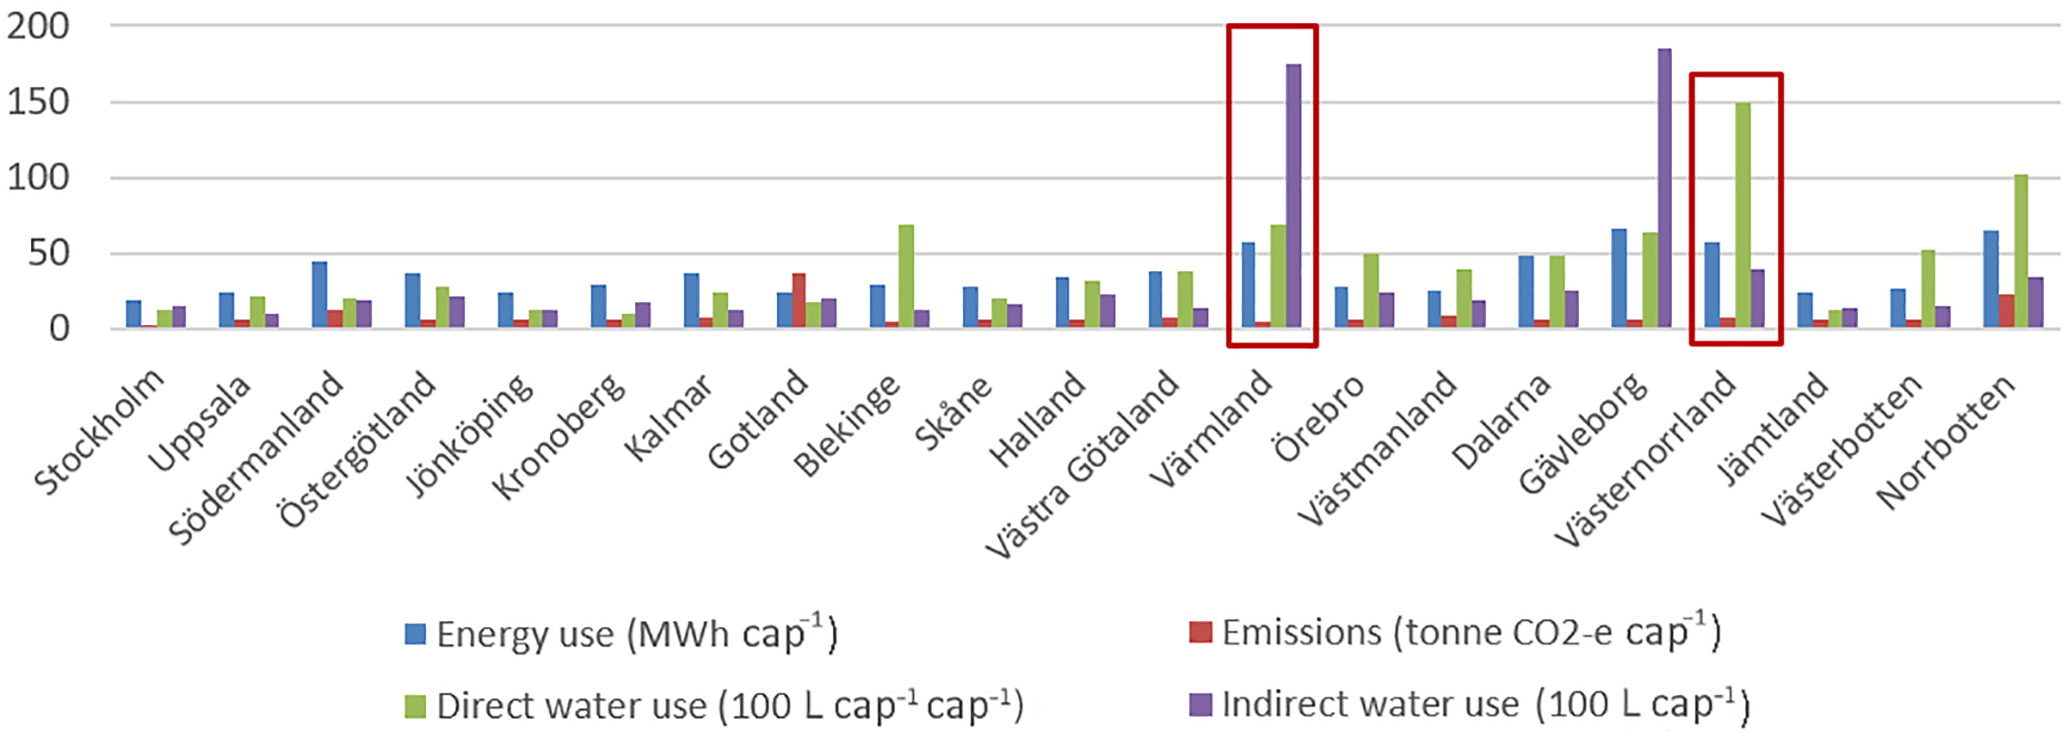
Figure 6Summary of per-capita county results for: direct energy use; GHG emissions; direct water use; and energy-related indirect water use. Red boxes highlights 2 counties with very similar energy use and emissions profiles, but large differences in both direct water use and indirect – energy related – water use.
Finally, looking at the combination of direct water use and GHG emissions reported, Figs. 4 and 5 show that Blekinge has similar x/y-coordinates (per-capita direct water use and emissions, respectively) as Värmland. However, their indirect water uses for energy supply (circle size) are very different. As such, neither direct water use nor GHG emissions, or the combination of these, provides any clear clue to the indirect water use of a county. Specific case-by-case analysis of the considered energy fuels – and ideally a more focused analysis of the specific origin of these fuels – is needed to assess this type of externalized water impacts with greater certainty. Nevertheless, the present analysis supports existing work on water-energy resource interdependencies (Hussey and Pittock, 2012, among others) and the suggested importance of SDG interactions by Nilsson et al. (2016). The studied external (remote) water impacts of local energy strategies are significant, but difficult to trace with great precision and certainty from only local-level resource-use and emissions data.
As noted in the data section, limitations in both availability and comparability of data on water use in energy supply chains are significant. Although careful selection of water factors has been made for this analysis (Table 1), the uncertainties and temporal and spatial variations of reported energy-related water uses are large. As a consequence, the results presented here should be interpreted and used conservatively. This work primarily aims to highlight the un-intuitive (sometimes counter-intuitive) relations between direct and indirect environmental impacts of local energy choices, and the potentially large differences in indirect resource impacts (in our study focused on water) of regions with seemingly comparable local emissions profiles and direct resource uses.
Focusing on the water-energy nexus, this paper has identified quite different patterns of reported direct water use, GHG emissions and indirect water use for local energy use among Sweden's 21 counties. Direct water use is typically driven by population size and the presence of water-intensive industries. In contrast, energy-related indirect water use is primarily impacted by the choice of fuels used in the county – with liquid biofuels requiring orders of magnitude larger volumes of water than all other fuels used in the analysed energy systems.
Similar to the indirect water use studied in this paper, GHG emissions are tightly coupled to the energy sector. However, on a fuel-by-fuel basis, the water-use and GHG interactions with energy differ significantly. Conventional fossil fuels, with their high CO2 emissions, are orders of magnitude less water-intensive than the carbon-neutral biofuels.
As climate-change action plans are developed and adopted by an increasing number of sub-national authorities (to meet the Paris Agreement as well as the climate-related SDG 13), the goal conflict implied by a largely (even though not fully) inverse relation between GHG emissions and indirect water use should be acknowledged and further investigated. As no clear general relation could be determined in the present analysis of energy-related GHG emissions, indirect-remote water use and direct-local water use, further investigation of such relations are needed for different local-regional cases. Such further analysis is not least needed in Sweden, if the country is to remain a front-runner in reaching the highly integrated SDGs, with the freshwater SGD (6), the energy SDG (7) and the climate SDG (13) considered as equally important sustainability targets.
Finally, accounting for this type of cross-scale interactions in the monitoring of progress towards reaching the SDGs could potentially alter assessments of how different nation states or sub-national regions are performing, and should be considered when indicators for monitoring progress towards the SDGs are further developed.
Data sources are cited throughout the text and come from:
-
water use for energy: published literature (as referenced in Table 1 and Table S1)
-
energy use and water use per county: the Swedish Central Bureau of Statistics, SCB (Statistiska Centralbyrån), data tables: EN0203AE (energy use), MI0902AB (water use) and 0000000V (water use). Data for year 2010
-
GHG emissions per county: RUS, Nationella Emissionsdatabasen. Data for year 2010
The supplement related to this article is available online at: https://doi.org/10.5194/piahs-376-25-2018-supplement.
The authors declare that they have no conflict of interest.
This article is part of the special issue “Water security and
the food–water–energy nexus: drivers, responses and feedbacks at local to
global scales”. It is a result of the IAHS Scientific Assembly 2017, Port
Elizabeth, South Africa, 10–14 July 2017.
Edited by: Barry Croke
Reviewed by: James
Cullis and two anonymous referees
Bakken, T. H., Killingtveit, Å., Engeland, K., Alfredsen, K., and Harby, A.: Water consumption from hydropower plants – review of published estimates and an assessment of the concept, Hydrol. Earth Syst. Sci., 17, 3983–4000, https://doi.org/10.5194/hess-17-3983-2013, 2013.
Bazilian, M., Rogner, H., Howells, M., Hermann, S., Arent, D., Gielen, D., Steduto, P., Mueller, A., Komor, P., Tol, R., and Yumkella, K.: Considering the Energy, Water and Food Nexus: Towards an Integrated Modelling Approach, Energ. Policy, 39, 7896–7906, https://doi.org/10.1016/j.enpol.2011.09.039, 2011.
Caro, D., Pulselli, F. M., Borghesi, S., and Bastianoni, S.: Mapping the International Flows of GHG Emissions within a More Feasible Consumption-Based Framework, J. Clean. Prod., 147, 142–151, https://doi.org/10.1016/j.jclepro.2017.01.106, 2017.
Covenant of Mayors: http://www.covenantofmayors.eu/index_en.html, last access: 28 March 2017.
Destouni, G., Jaramillo, F., and Prieto, C.: Hydroclimatic Shifts Driven by Human Water Use for Food and Energy Production, Nature Climate Change, 3, 213–217, https://doi.org/10.1038/nclimate1719, 2013.
EPRI: Water Use for Electric Generation, Palo Alto, CA, 1014026, available at: https://www.epri.com/#/pages/product/1014026/ (last access: 29 May 2017), 2008.
Fthenakis, V. and Kim, H. C.: Life-Cycle Uses of Water in U.S. Electricity Generation, Renewable and Sustainable Energy Reviews, 14, 2039–2048, https://doi.org/10.1016/j.rser.2010.03.008, 2010.
Gerbens-Leenes, P. W., Hoekstra, A. Y., and van der Meer, Th. H.: Water Footprint of Bio-Energy and Other Primary Energy Carriers, Value of water research report series 29. UNESCO-IHE Institute for Water Education, available at: https://ris.utwente.nl/ws/portalfiles/portal/5148108 (last access: 10 October 2017), 2008.
Gerbens-Leenes, P. W., Hoekstra, A. Y., and van der Meer, Th. H.: The Water Footprint of Bioenergy, Proceedings of the National Academy of Sciences, 106, 10219–10223, https://doi.org/10.1073/pnas.0812619106, 2009.
Gerbens-Leenes, P. W., Van Lienden, A. R., Hoekstra, A. Y., and Van der Meer, Th. H.: Biofuel Scenarios in a Water Perspective: The Global Blue and Green Water Footprint of Road Transport in 2030, Global Environmental Change, 22, 764–775, https://doi.org/10.1016/j.gloenvcha.2012.04.001, 2012.
Granit, J. and Lindström, A.: Constraints and Opportunities in Meeting the Increasing Use of Water for Energy Production, in: Proceedings of the ESF Strategic Workshop on Accounting for Water Scarcity and Pollution in the Rules of International Trade, Value of Water Research Report Series. Amsterdam: UNESCO-IHE Institute for Water Education, 54, 85–98, 2010.
Griggs, D., Nilsson, M., Stevance, A., and McCollum, D.: A Guide to SDG Interactions: From Science to Implementation, Report, Paris, France: International Council for Science (ICSU), http://www.icsu.org/cms/2017/05/SDGs-Guide-to-Interactions.pdf, 2017.
Hamiche, A. M., Boudghene Stambouli, A., and Flazi, S.: A Review of the Water-Energy Nexus, Renew. Sust. Energ. Rev., 65, 319–331, https://doi.org/10.1016/j.rser.2016.07.020, 2016.
Holland, R. A., Scott, K. A., Flörke, M., Brown, G., Ewers, R. M., Farmer, E., Kapos, V., Muggeridge, A., Scharlemann, J. P. W., Taylor, G., Barrett, J., and Eigenbrod, F.: Global Impacts of Energy Demand on the Freshwater Resources of Nations, P. Natl. Acad. Sci., 112, E6707–E6716, https://doi.org/10.1073/pnas.1507701112, 2015.
Hussey, K. and Pittock, J.: The Energy–Water Nexus: Managing the Links between Energy and Water for a Sustainable Future, Ecol. Soc., 17, 31, https://doi.org/10.5751/ES-04641-170131, 2012.
IEA: World Energy Outlook 2012, Paris, OECD Publishing, https://doi.org/10.1787/weo-2012-en, 2012.
Jaramillo, F. and Destouni, G.: Local Flow Regulation and Irrigation Raise Global Human Water Consumption and Footprint, Science, 350, 1248–1251, https://doi.org/10.1126/science.aad1010, 2015.
Katers, J. F. and Snippen, A.: Life-cycle Inventory of Wood Pellets Manufacturing in Wisconsin, Final Report, Environmental and Economic Research and Development Program of the Public Service Commission of Wisconsin & the Statewide Energy Efficiency and Renewables Administration, available at: https://www.focusonenergy.com/sites/default/files/research/katerswoodpelletmfg_report.pdf, (last access: 30 September 2017), March 2011.
Macknick, J., Sattler, S., Averyt, K., Clemmer, S., and Rogers, J.: The Water Implications of Generating Electricity: Water Use across the United States Based on Different Electricity Pathways through 2050, Environ. Res. Lett., 7, 045803, https://doi.org/10.1088/1748-9326/7/4/045803, 2012.
Mekonnen, M. M. and Hoekstra, A. Y.: The green, blue and grey water footprint of animals and animal products. (Value of water research report 48; No. 48), Delft, the Netherlands: Unesco-IHE Institute for Water Education, http://doc.utwente.nl/76912, 2010.
Mekonnen, M. M., Gerbens-Leenes, P. W., and Hoekstra, A. Y.: The Consumptive Water Footprint of Electricity and Heat: A Global Assessment, Environmental Science: Water Research & Technology, 1, 285–297, https://doi.org/10.1039/c5ew00026b, 2015.
Mielke, E., Anadon, L. D., and Narayanamurti, V.: Water Consumption of Energy Resource Extraction, Processing, and Conversion, Belfer Center for Science and International Affairs, http://live.belfercenter.org/files/ETIP-DP-2010-15-final-2.pdf (last access: 13 October 2017), 2010.
Nationella emissionsdatabasen: RUS, Nationella Emissionsdatabasen, http://www.airviro.smhi.se/cgi-bin/RUS/apub.html_rusreport.cgi, last access: 29 May 2017.
Nilsson, M., Griggs, D., and Visbeck, M.: Policy: Map the Interactions between Sustainable Development Goals, Nature News, 534, 320, https://doi.org/10.1038/534320a, 2016.
Pacetti, T., Lombardi, L., and Federici, G.: Water–energy Nexus: A Case of Biogas Production from Energy Crops Evaluated by Water Footprint and Life Cycle Assessment (LCA) Methods, J. Clean. Prod., 101, 278–291, https://doi.org/10.1016/j.jclepro.2015.03.084, 2015.
Region Gotland: Gotland i Siffror 2016, Gotland i Siffror, Visby, Region Gotland, available at: http://gotland.se/statistik (last access: 29 May 2017), 2016.
Rio Carrillo, A. M. and Frei, C.: Water: A Key Resource in Energy Production, Energ. Policy, 37, 4303–4312, https://doi.org/10.1016/j.enpol.2009.05.074, 2009.
Sachs, J., Schmidt-Traub, G., Kroll, C., Durand-Delacre, D., and Teksoz, K.: SDG Index & Dashboards – Global Report, New York, Bertelsmann Stiftung and Sustainable Development Solutions Network (SDSN), available at: https://issuu.com/unsdsn/docs/sdg_index_dashboard_full (last access: 29 May 2017), 2016.
SCB Statistikdatabasen: SCB Statistikdatabasen [Electronic resource] Statistical database, available at: http://www.scb.se/Statistikdatabasen, last access: 29 May 2017.
Scott, C. A., Pierce, S. A., Pasqualetti, M. J., Jones, A. L., Montz, B. E., and Hoover, J. H.: Policy and Institutional Dimensions of the Water–energy Nexus, Energ. Policy, Sustainability of biofuels, 39, 6622–6630, https://doi.org/10.1016/j.enpol.2011.08.013, 2011.
Scown, C. D., Horvath, A., and McKone, T. E.: Water Footprint of U.S. Transportation Fuels, Environ. Sci. Technol., 45, 2541–2553, https://doi.org/10.1021/es102633h, 2011.
Spang, E. S., Moomaw, W. R., Gallagher, K. S., Kirshen, P. H., and Marks, D. H.: The Water Consumption of Energy Production: An International Comparison, Environ. Res. Lett., 9, 105002, https://doi.org/10.1088/1748-9326/9/10/105002, 2014.
Stokes, J. and Horvath, A.: Life-Cycle Assessment of Urban Water Provision: Tool and Case Study in California, J. Infrastruct. Syst., 17, 15–24, https://doi.org/10.1061/(ASCE)IS.1943-555X.0000036, 2010.
Theobald, E. J., Ettinger, A. K., Burgess, H. K., DeBey, L. B., Schmidt, N. R., Froehlich, H. E., Wagner, C., HilleRisLambers, J., Tewksbury, J., Harsch, M. A., and Parrish, J. K.: Global Change and Local Solutions: Tapping the Unrealized Potential of Citizen Science for Biodiversity Research, Biol. Conserv., 181, 236–244, https://doi.org/10.1016/j.biocon.2014.10.021, 2015.
Tukker, A.: Life Cycle Assessment as a Tool in Environmental Impact Assessment, Environ. Impact Assess., 20, 435–456, https://doi.org/10.1016/S0195-9255(99)00045-1, 2000.
Vattenfall, A. B.: Certified Environmental Product Declaration EPD® of Electricity from Vattenfall Nordic Nuclear Power Plants, Certified Environmental Product Declaration EPD® S-P-00923. UNCPC Code 17, Group 171, available at: http://www.environdec.com/en/Detail/epd923 (last access: 10 October 2017), 2016.
Wamsler, C., Luederitz, C., and Brink, E.: Local Levers for Change: Mainstreaming Ecosystem-Based Adaptation into Municipal Planning to Foster Sustainability Transitions, Global Environ. Chang., 29, 189–201, https://doi.org/10.1016/j.gloenvcha.2014.09.008, 2014.
Xue, B. and Tobias, M.: Sustainability in China: Bridging Global Knowledge with Local Action, Sustainability, 7, 3714–3720, https://doi.org/10.3390/su7043714, 2015.
Yang, Z., Dong, W., Wei, T., Fu, Y., Cui, X., Moore, J., and Chou, J.: Constructing Long-Term (1948–2011) Consumption-Based Emissions Inventories, J. Clean. Prod., 103, 793–800, https://doi.org/10.1016/j.jclepro.2014.03.053, 2015.