
the Creative Commons Attribution 4.0 License.
the Creative Commons Attribution 4.0 License.
 | 14 Jul 2026
Modeling the maximum annual flow in South-East Senegal using the GEV distribution
Melvine R. H. Codjo
Audace A. V. Dossou-Olory
Aliou Diop
Understanding extreme floods is crucial for water resource management and risk prevention in West Africa. However, the statistical modelling of maximum annual flows in south-East Senegal is still largely unexplored. The present study addresses this gap by analyzing and modelling the maximum annual flow using the generalized extreme value (GEV) distribution. Several statistical methods were compared to fit the model, including maximum likelihood estimation (MLE), probability-weighted moments (PWM), elementary percentiles (EP), and quantile least squares (QLS). The comparative performance of these methods is evaluated using the Average Standardized Absolute Error (ASAE) criterion, as well as probability and quantile plots. The results indicate that the probability-weighted moments method provides the best fit. Goodness-of-fit tests confirm that the Gumbel distribution, a special case of the GEV, is more appropriate for representing maximum annual flows in the study area. The 100-year return level of the maximum annual flow is estimated at 1751.242 m3 s−1, indicating that such a flow is likely to occur on average once every 100 years. This study highlights the value of extreme value models for flood analysis in regions with high hydro-climatic variability. The results provide useful insights for understanding hydrological risks in southeastern Senegal and can support future work in hydrological modeling and water resource management planning.
- Article
(714 KB) - Full-text XML
- BibTeX
- EndNote


The increasing frequency and intensity of extreme precipitation events is a well-documented phenomenon, often attributed to climate change (Westra et al., 2013). These extreme weather events can cause disasters such as floods or landslides, endangering human lives and infrastructures (Bates et al., 2008). Anticipating them is therefore essential for sustainable risk planning and management, particularly for the design of critical infrastructures such as flood protection dams (Douglas and Barros, 2003; Kouassi et al., 2019). In this context, the generalized extreme value (GEV) distribution, introduced by Jenkinson (1955), has proven to be an effective method for modeling these rare events (Martins and Stedinger, 2000). Thanks to its three parameters, it offers great flexibility in modeling distribution tails, thus allowing for the efficient capture of extreme events (Kouassi et al., 2019). This method is commonly used to model annual maxima of precipitation, flood flows, and other extreme hydrometeorological phenomena (Seidou et al., 2021). However, its application remains largely unexplored in West Africa, where the challenges posed by extreme rainfall may differ from those in other regions (Faye et al., 2021). Senegal, in particular, is severely affected by climate change, which represents a significant threat to vital sectors such as agriculture and water resources, both essential to the country's economy and development goals (Sakli, 2016). However, these studies have certain limitations. For example, some approaches rely on rainfall-runoff models to reconstruct time series of average flows, which provides a valuable basis for hydrological knowledge (Bodian et al., 2012), but does not specifically target extreme events or estimate associated return periods. Similarly, other studies document rainfall extremes in the Sahel using climate indices, with an emphasis on understanding climate mechanisms (Sanogo, 2022), but without producing indicators directly applicable to operational risk management. Furthermore, although the GEV distribution has already been used to estimate return periods of extreme rainfall (Touré et al., 2022), few studies offer a systematic comparison of several parameter estimation methods, even though this choice can significantly influence the estimated return levels and, consequently, risk management decisions. It is in this context that the present study is situated, aiming to model the mean annual maximum discharge of hydrometric stations in southeastern Senegal using the GEV distribution and employing different parameter estimation techniques, such as maximum likelihood estimation (MLE) and probability-weighted moments (PWM), elementary percentiles (EP) and least squares quantiles (QLS). The originality of this work lies in the rigorous comparison of parameter estimation methods. The study also emphasizes the estimation of return periods and levels, from a perspective directly geared towards climate risk planning and management. Thus, the specific objectives are to:
-
Characterize the trends of extreme rainfall and maximum flows in Southeast Senegal.
-
Estimate and analyze the return periods and levels associated with maximum flow rates.
-
Provide quantitative results that can be directly used to support decision-making, particularly in the areas of flood prevention and hydrometeorological risk management.
2.1 Study Area
This study focuses on a region of West Africa, specifically southeastern Senegal. Several factors motivated the choice of Senegal as the study area. Senegal frequently experiences heavy rainfall, causing urban flooding and significant human and material damage (Sarr et al., 2015). These extreme climatic conditions have a considerable impact on mental health, physical well-being, and the economy, particularly with regard to agriculture, infrastructure, and trade (Sakli, 2016). Senegal's climate, characterized by flood cycles, provides a relevant framework for applying extreme value models, specifically the generalized extreme value (GEV) distribution, in the analysis of annual maximum flows. However, despite the existence of a relatively dense national network of meteorological stations, the analysis was restricted to a subset of stations in southeastern Senegal due to the availability, temporal continuity, and quality of hydrometeorological data for the period 1971–2010. This selection ensures the statistical robustness of the estimates while limiting biases related to gaps or inconsistencies in the data series. The selected stations cover climatic contexts within this area (Fig. 1). The Dakka-Saïdou region exhibits significant changes in rainfall patterns, with downward trends for certain types of rainfall events. Bakel, Gourbassi, and Kidira, located in eastern Senegal, experience a hot, dry climate characterized by low and irregular rainfall (Faye, 2017). Conversely, Oualia, in southern Senegal, benefits from a relatively wetter climate, with more abundant rainfall during the rainy season. This climatic diversity in the study area remains consistent with the study's objective, which is the analysis and modeling of maximum flows in southeastern Senegal.
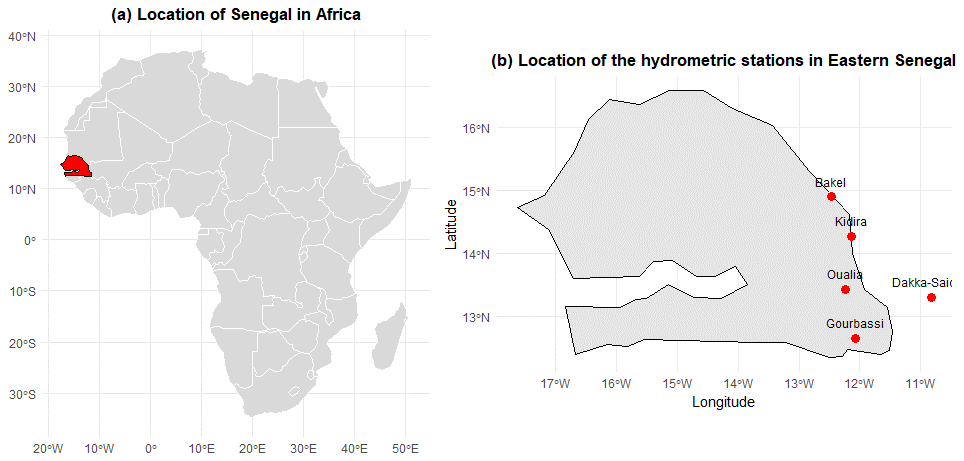
Figure 1Location of the study area.
2.2 Data Collection
This study is based on time series data covering the period from 1971 to 2010 from various weather stations in southeastern Senegal. Two types of data were collected from Senegal's national meteorological services and correspond to field observations from the 1971–2010 period due to their completeness and quality such as: (i) annual rainfall, used only for the descriptive analysis of the hydro-climatic context, and (ii) the maximum annual flow, which constitutes the extreme variable analyzed within the framework of the modeling by the generalized distribution of extreme values.
2.3 Data Analysis
2.3.1 Rainfall trends in Senegal between 1971 and 2010
The assessment of maximum flow and rainfall in Southeast Senegal, more specifically in the different stations, will be carried out using time series analysis methods, with the aim of understanding their evolution over time (Ashoori et al., 2017).
2.3.2 Verification of assumptions for the application of the stationary GEV
Before fitting the GEV distribution, it is essential to ensure that the data series meet the assumptions required by the stationary approach. To this end, several statistical tests were applied to evaluate the validity of the assumptions of homogeneity, stationarity, and independence of observations from the data in order to verify the conditions necessary for using the stationary GEV model (Yousfi, 2016). The stationarity of the series was examined using the Kwiatkowski-Phillips-Schmidt-Shin (KPSS) test (Kagalwala, 2022; Mahé, 2006), and the independence of the observations using the Ljung-Box test (Onyeka-Ubaka and Ogundeji, 2021).
2.3.3 Performance of different estimation methods (ASAE criterion)
The performance evaluation of the different estimation methods MLE, PWM, EP, and QLS will be carried out using the Average Standardised Absolute Error (ASAE) criterion, as well as quantile-quantile plots (QQ plots) and probability plots (PP plots). The validity of the chosen method will then be verified based on these results. The Average Standardised Absolute Error (ASAE) is defined as follows (Chikobvu and Chifurira, 2015):
Where:
-
n: sample size which is 40 observations,
-
xi:n: ith order statistic, observed value after ascending ordering of the sample
-
: ith theoretical quantile estimated from the adjusted GEV distribution,
-
x1:n: Minimum order statistics,
-
xn:n: Maximum order statistic.
2.3.4 Shape parameter testing and goodness-of-fit tests
The choice of the appropriate distribution (Weibull, Fréchet and Gumbel) is validated using a hypothesis test on the shape parameter γ.
The null hypothesis corresponds to a Gumbel distribution.
H0: γ=0 Corresponds to a Gumbel distribution.
The alternative hypothesis H1: γ≠0 Corresponds to a Weibull or Fréchet distribution.
The modified likelihood ratio test LR* proposed by Hosking (1984) is used.
Goodness-of-fit tests will then be carried out using the Anderson-Darling and Kolmogorov-Smirnov tests as a confirmatory measure (Martins and Stedinger, 2000).
2.3.5 Estimation of levels and return period
Once the GEV distribution is validated, the return levels associated with different return periods are estimated. The return period T represents the average time between two occurrences of an event of the same intensity (Chikobvu and Chifurira, 2015). It is essential for understanding the frequency of extreme events such as heavy rainfall. It represents
And the cumulative distribution function of the GEV.
With: , the estimated position parameter, the estimated scale parameter and the estimated shape parameter.
The return level xP is the amount of flow associated with a return period. Thus, xP estimating the return period of a quantile is equivalent to estimating the order of that quantile.
Then,
3.1 Evolution of rainfall in Senegal between 1971 and 2010
3.1.1 Maximum flow rate
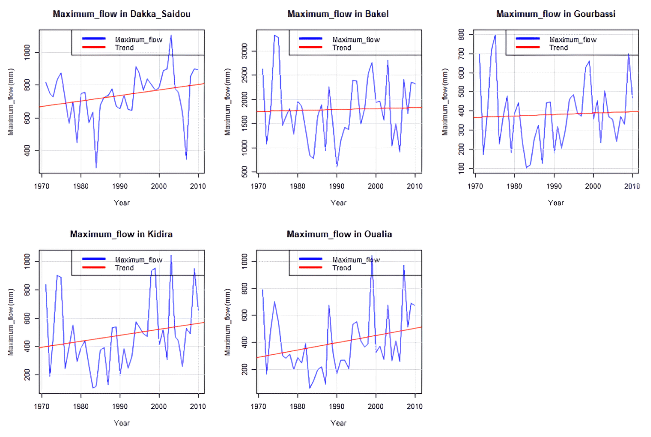
Analysis of maximum flow rates at the five stations reveals significant fluctuations (see Fig. 2). At Dakka-Saïdou, the minimum of maximum flow rate reached 100 mm in 1985, followed by a peak of 1100 mm in 2003, then a drop to less than 400 mm in 2007 and a rise to 897 mm in 2010. At Kidira and Oualia, despite recorded increases, notable decreases were also observed, while at Bakel and Gourbassi, the trends remained stable but downward. These decreases in maximum flow rates coincide with episodes of severe drought that affected the Sahel during the 1970s and 1980s. Indeed, as highlighted in Onyeka-Ubaka and Ogundeji (2021), this period is characterized by persistent major rainfall deficits, leading to a significant reduction in surface runoff and river flows. Thus, the low maximum flow values observed during these periods are not due to measurement anomalies but rather reflect the direct hydrological impact of the major historical droughts that have affected the Senegal River basin. Application of the modified Mann-Kendall test to the maximum flow series shows that the Dakka-Saidou station exhibits a significant upward trend (t=188, p=0.029). The other stations, particularly Kidira and Oualia, show a slightly significant upward trend (t=140, p=0.105). These results confirm that the variations observed in the flow series are consistent with regional climatic trends and highlight the need to consider the effects of historical droughts in hydrological analysis.
3.1.2 Precipitation
Analysis of rainfall at the five stations reveals significant fluctuations (see Fig. 3), with an upward trend at Dakka-Saïdou (from 650.66 mm in 1971 to 785 mm in 2010), a similar increase at Bakel (from 721 mm in 1972 to 843.85 mm in 2010), and at Oualia (from 687 mm in 1972 to 797 mm in 2010). The Mann-Kendall test shows that the trends remain slightly significant at Dakka-Saïdou (p=0.083), Bakel (p=0.061), and Oualia (p=0.116), indicating a moderate increase in maximum rainfall. These variations reflect regional climate change likely to influence the hydrological regime of these stations.
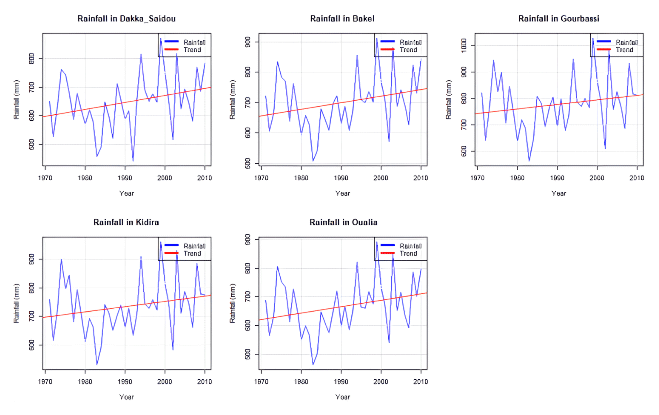
Figure 3Analysis of rainfall trends (precipitation) in the five stations of South-East Senegal.
3.1.3 Standard normal homogeneity test for the five rainfall stations
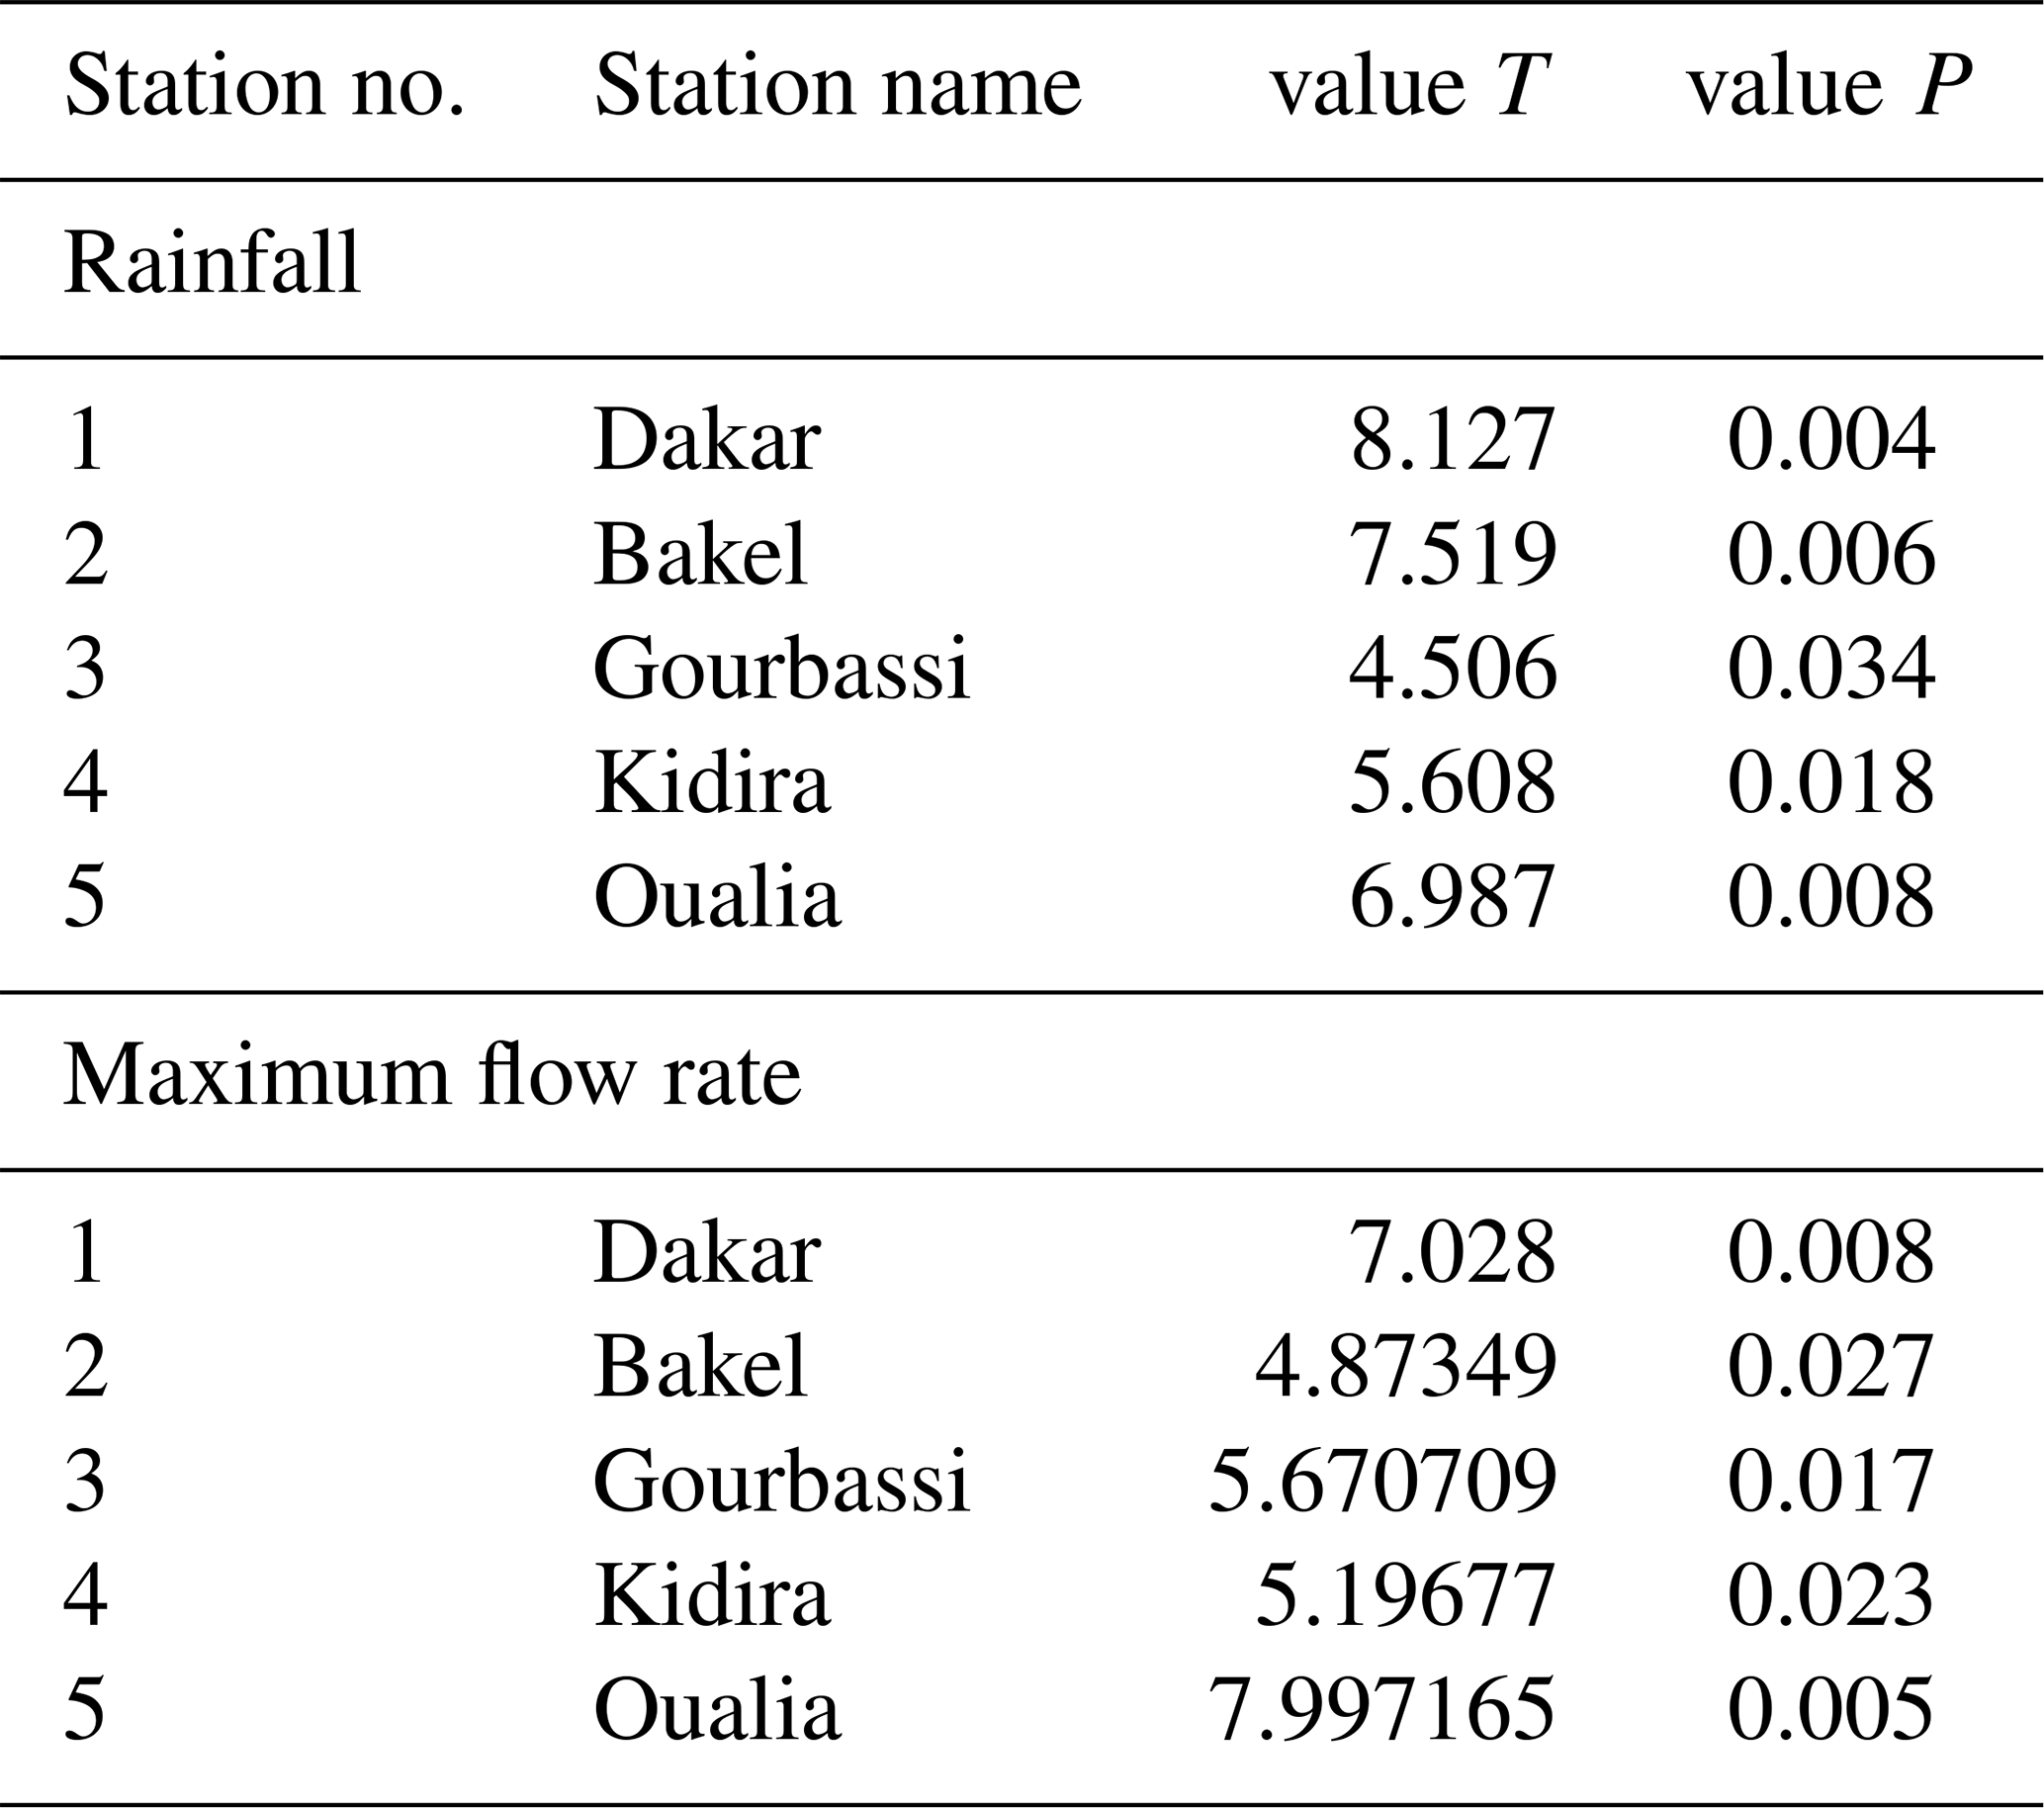
The results of the test of homogeneity of precipitation and maximum flow at the stations of Dakka-Saïdou, Bakel, Gourbassi, Kidira and Oualia (Table 1) reveal p values of less than 5 %, indicating significant temporal differences in precipitation and maximum flow at each station.
Table 1Result of the standard normal homogeneity test for the five rainfall stations.
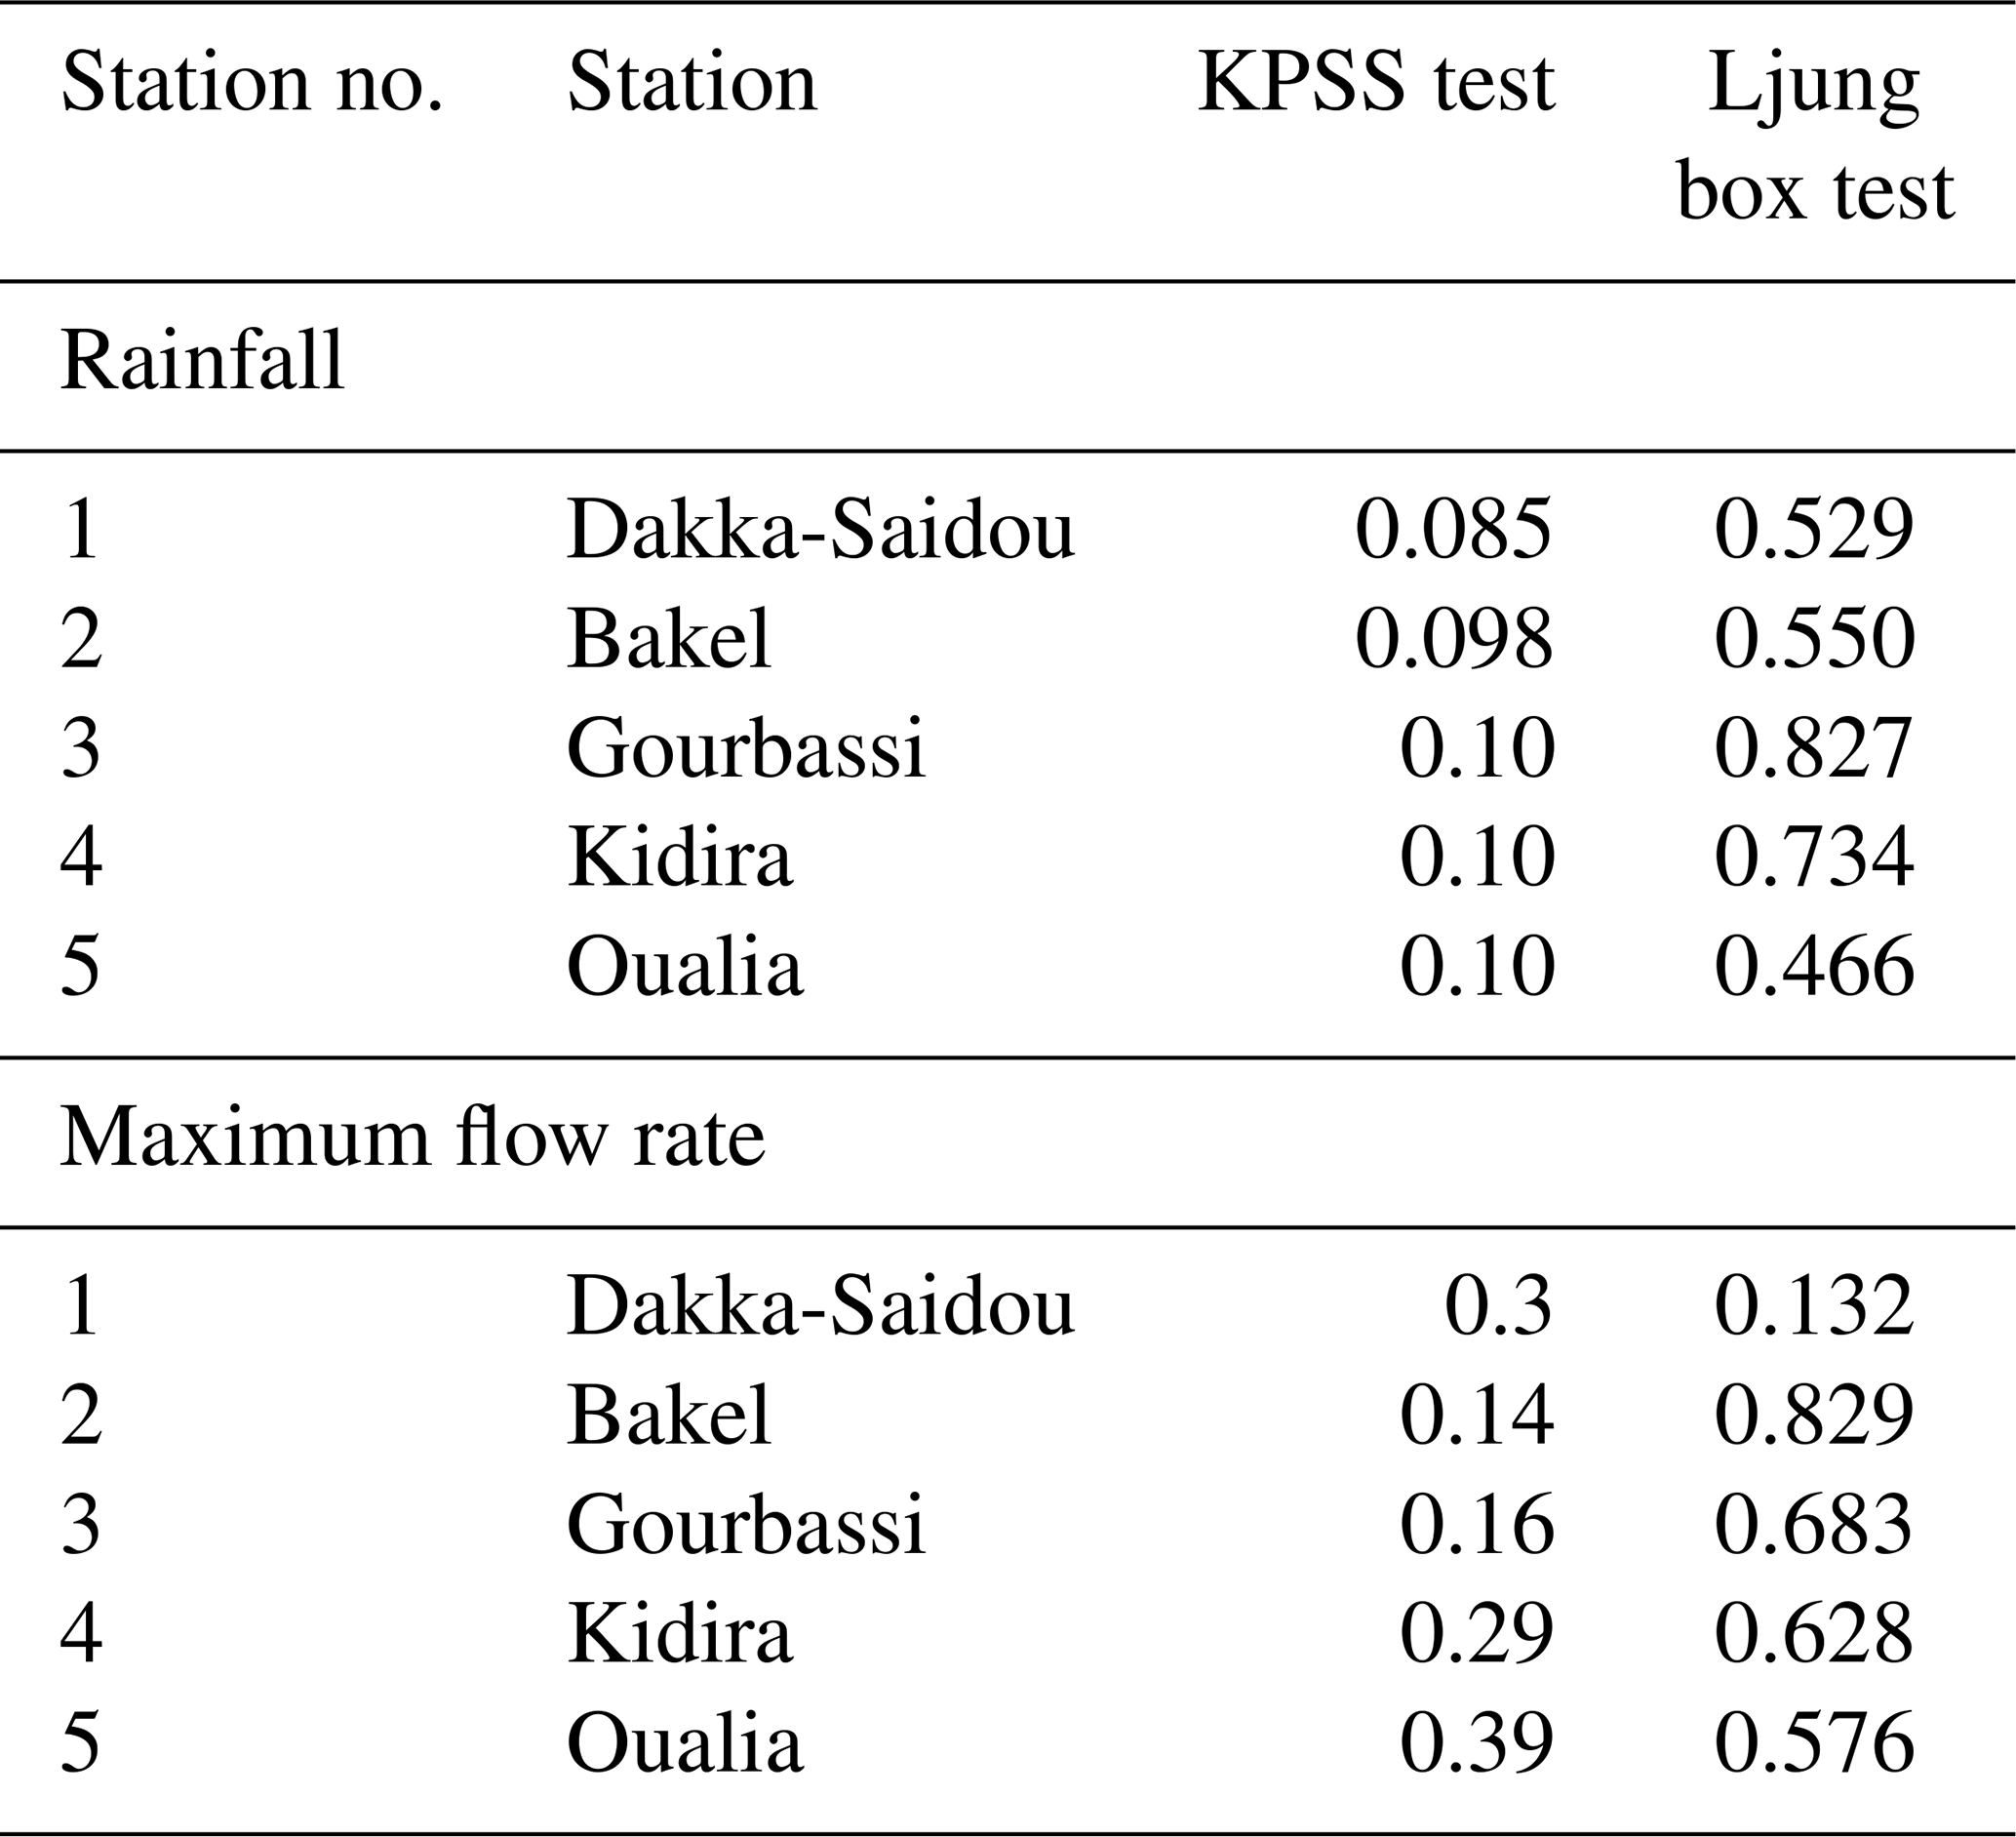
3.1.4 Stationarity and independence test of data (see Table 2)
The KPSS test results show that all flow and precipitation series are stationary with a p-value greater than 5 %. Furthermore, the Ljung-box test shows that independence is generally verified across the stations, with a p-value greater than 5 %.
3.2 Comparative analysis of different estimation methods
3.2.1 Analysis performed on average annual maximum flow data
We calculated the annual mean maximum flow rate from data collected at five stations over the period 1971–2010 (n=40). To do this, the maximum flow rates observed at each of the five stations in the study were extracted, and these values were averaged to obtain a single representative value for the annual maximum flow rate across all stations. The Average Standardized Absolute Error (ASAE) was calculated to assess the performance of the methods.
Table 3Comparison of the performance of methods for estimating average annual flow rates at the five stations. The values shown in bold correspond to the lowest ASAE values and therefore identify the best estimation method.
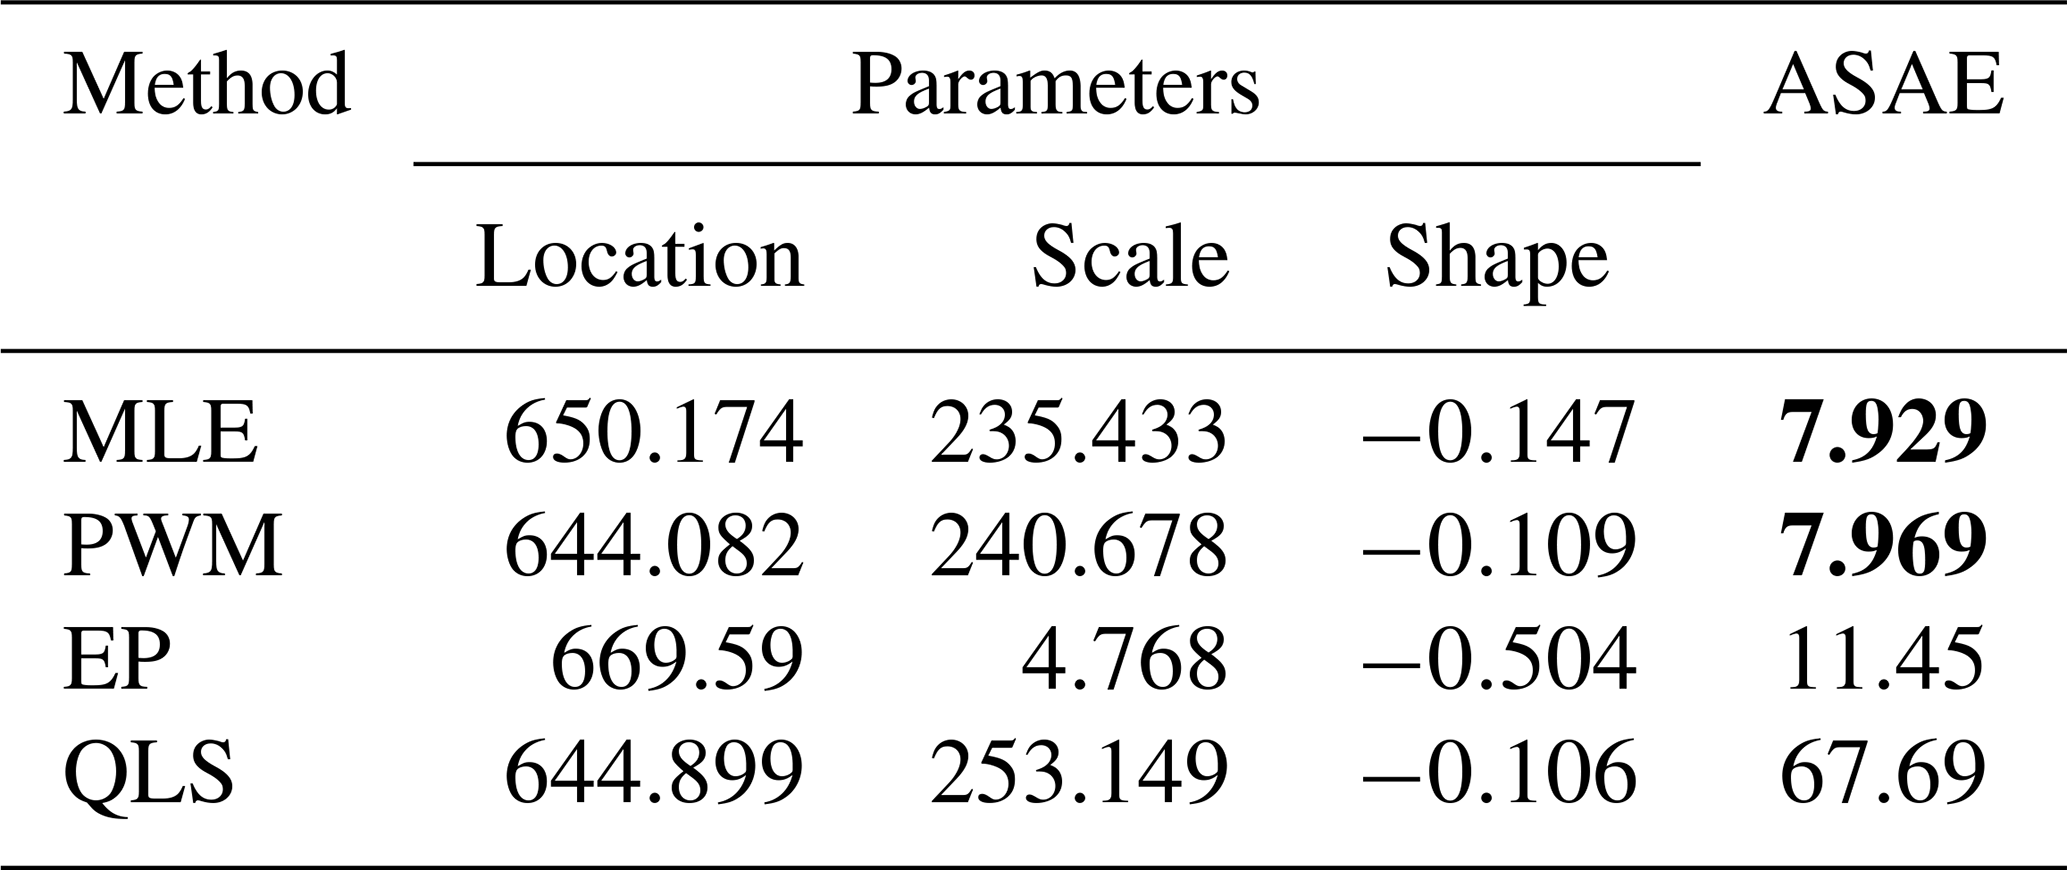
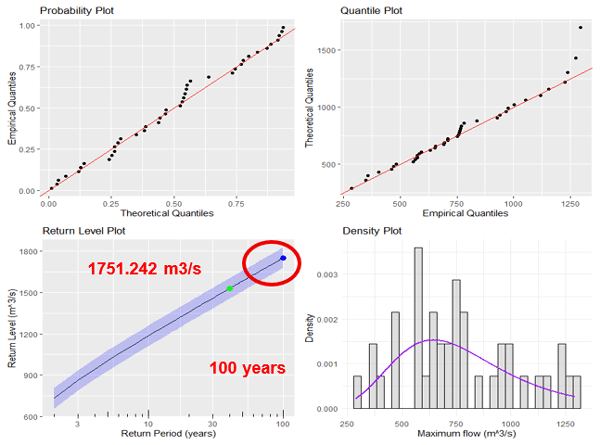
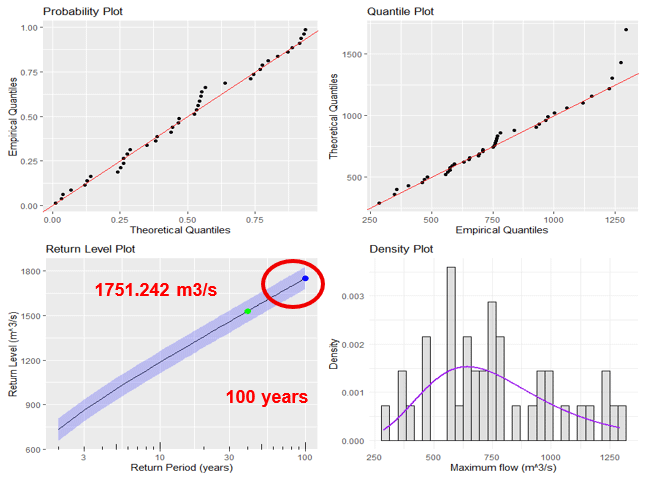
Calculating the annual mean maximum flow rates from data from the five stations, from 1971 to 2010, shows that the MLE and PWM methods are the most reliable, with respective ASAE values of 7.929 and 7.969 (see Table 3), highlighting their similar performance for estimating annual mean flow rates. Furthermore, the QQ plots (see Fig. 4) indicate that the most linear trend is obtained with the PWM method. Therefore, the PWM method is more suitable than the others.
3.2.2 Attraction of the data domain (Fréchet, Weibull or Gumbel distribution)
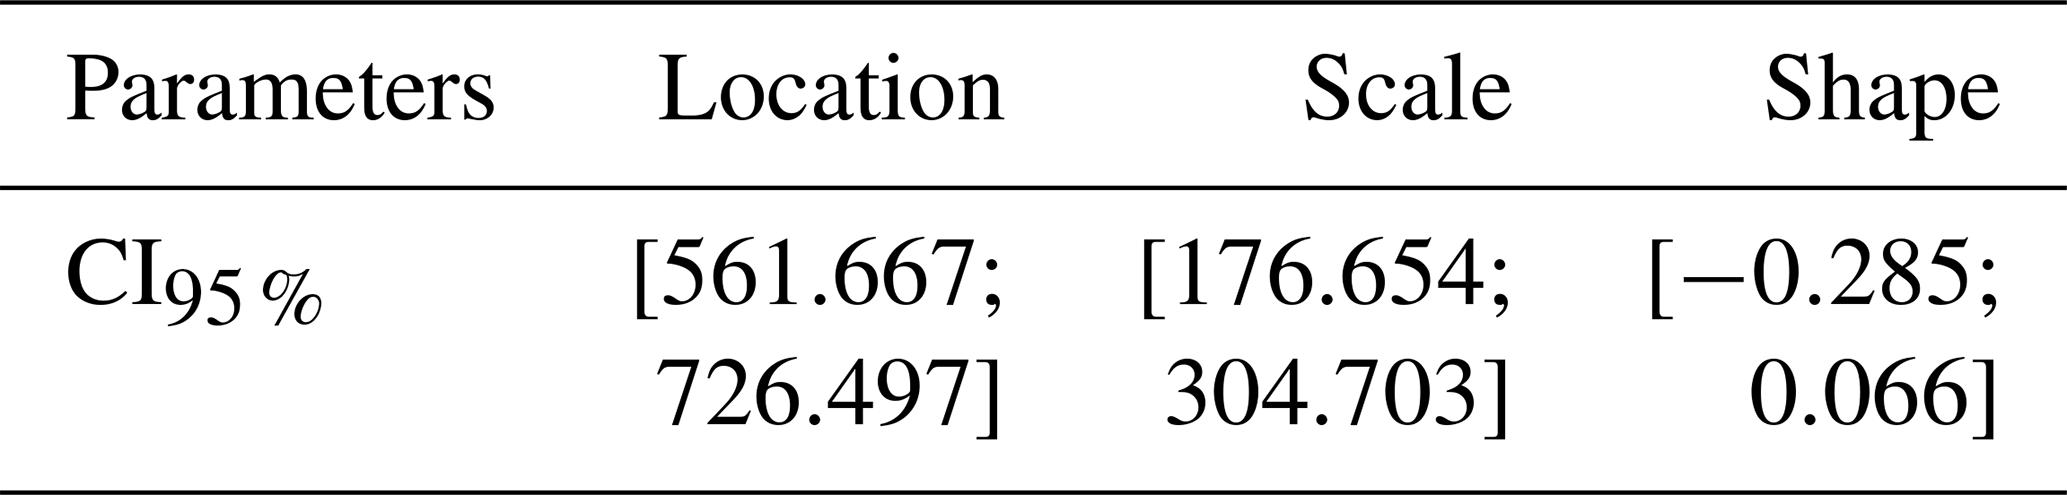
Table 4 reveals the 95 % confidence interval (CI) for the shape parameter. The interval includes zero (), indicating that the null hypothesis γ=0 cannot be rejected at the 5 % significance level. This result suggests that the Gumbel distribution, corresponding to a zero-shape parameter, is statistically plausible. However, the confidence interval alone is not sufficient to discriminate conclusively between Fréchet, Weibull, and Gumbel distribution. Therefore, formal goodness of fit test was employed.
The results of the LR* hypothesis tests, applied to the maximum flow data, are presented in Table 5. With 40 observations, the estimated shape parameter γ is −0.109. The logarithmic ratio (LR) test yields a value of 1.082 with a p-value of 0.298, while the modified LR* test shows a value of 1.074. Compared to the critical value of 3.84, the LR* test value is 1.082 and the p-value = 0.298 greater than 0.05. Therefore, there is no significant difference, and we accept the null hypothesis.
H0, concluding that the distribution of maximum flow data is of the Gumbel type.
Table 5GEV probability density function of maximum flow data (MF data) for the period 1971–2010.

3.2.3 Goodness-of-fit tests
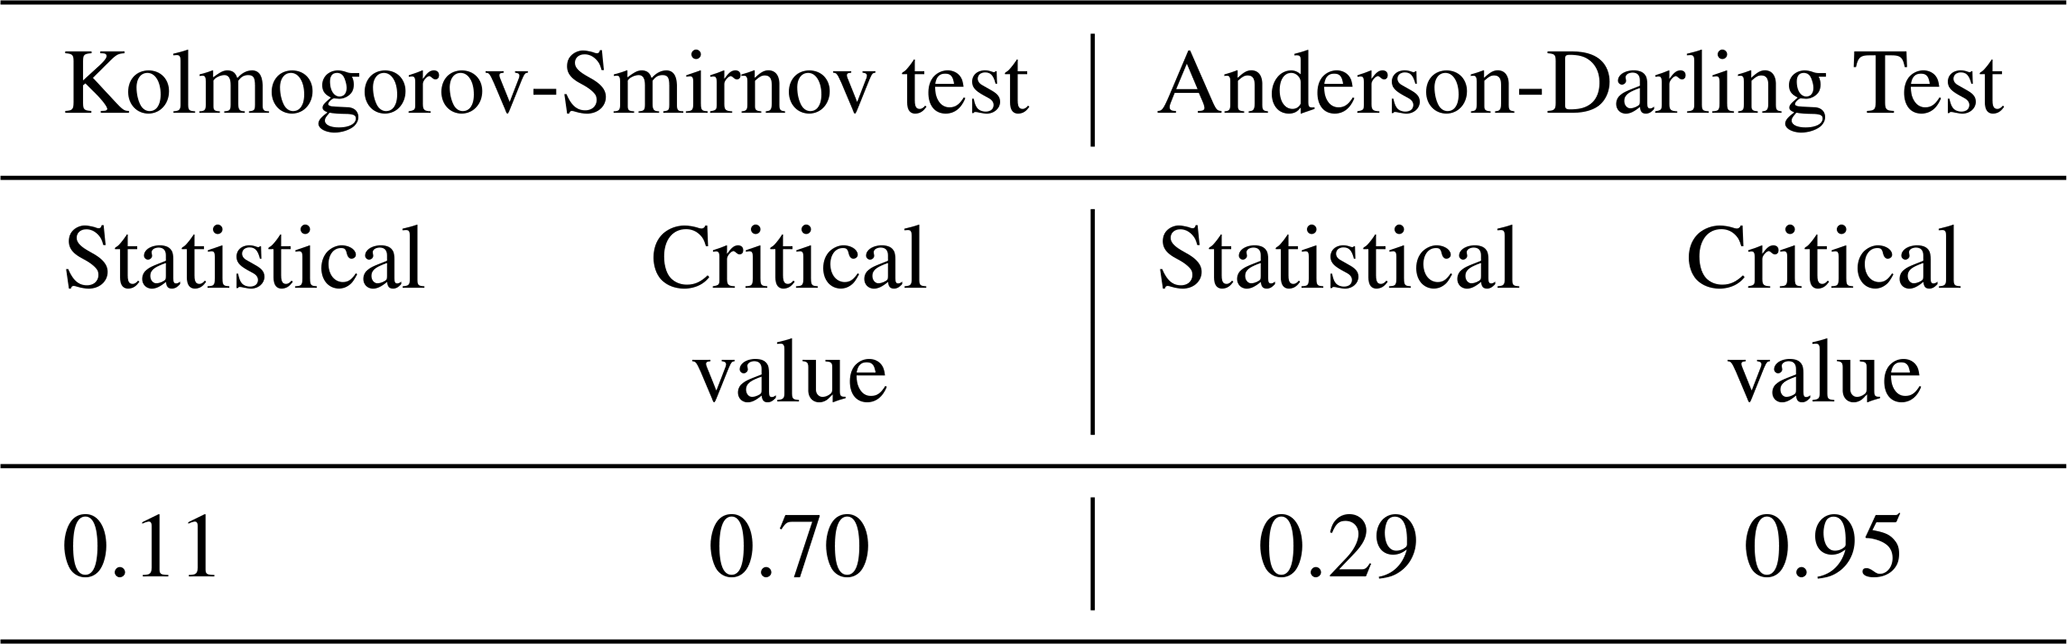
The results of the Anderson-Darling and Kolmogorov-Smirnov tests indicate that the test statistics are below their respective critical values (Table 6). Therefore, we do not reject the null hypothesis. This confirms that the Gumbel distribution, fitted to the extreme precipitation data using the PWM method, is appropriate.
Table 6Results of the Kolmogorov-Smirnov and Anderson-Darling tests.
3.3 Prediction of maximum flow levels and return period
Consider Eq. (6) and the values of each parameter (location, scale, shape) estimated by the PWM method. By calculating, using the R software, we obtain the return level xP:
Based on the return period formula see Eq. (3), we obtain T=100 years. Therefore, the return period, which represents the average time required for an extreme event to occur, allows us to predict that maximum flows 1 751 242 m3 s−1 will occur on average once every 100 years.
Analysis of hydrometric data from 1971 to 2010 reveals marked variability in maximum annual flowsat the studied stations, reflecting the combined influence of climatic conditions and regional hydrological dynamics. At the Dakka-Saïdou station, maximum flows exhibit significant fluctuations, characterized by a decrease between 1972 and 1985, followed by a period of increase until the early 2000s, before another decline and then a recovery around 2010. Contrasting patterns are also observed in the Kidira and Oualia basins, where occasional decreases in maximum flows coexist with a relatively stable overall trend. These spatial differences reflect the hydro-climatic heterogeneity of eastern and southern Senegal, as already highlighted in several previous studies, which emphasize the diversity of hydrological regimes in the Senegalese basins (Mballo et al., 2019). They confirm the need to adopt statistical approaches adapted to the analysis of extreme events, rather than classical methods based solely on averages. In this context, the use of the GEV (Geometric Efficiency Value) appears relevant for modeling annual maximum flows. The systematic comparison of several methods for estimating the parameters MLE, PWM, EP, and QLS shows that the probability-weighted moments (PWM) method offers the best performance, particularly in terms of Average Standardized Absolute Error (ASAE) and graphical fit. This superiority of PWM is explained by its robustness with respect to moderately sized samples and by its ability to give greater weight to extreme values, as also shown by several studies conducted in West Africa (Faye et al., 2021). The analysis of the shape parameter and the associated hypothesis tests (LR and LR*) indicate that the Gumbel distribution constitutes a suitable model for representing the average maximum annual flowsfrom the stations considered. The Kolmogorov-Smirnov and Anderson-Darling goodness-of-fit tests confirm the quality of the fit, thus strengthening the reliability of the estimates. These results are consistent with previous work demonstrating the suitability of the Gumbel distribution for modeling annual peak flows in similar hydrological contexts (Habibi et al., 2013). Other research has also demonstrated the effectiveness of other statistical approaches (Kouassi et al., 2019). Estimating a 100-year return level 1 751 242 m3 s−1 is an important operational result for hydrological planning and risk management. This return level corresponds to a rare event, characterized by an annual probability of exceedance of 1 %, and provides key information for the sizing of hydraulic infrastructure and flood prevention. Despite these results, certain limitations must be highlighted. First, the study relies on a limited number of hydrometric stations that do not provide uniform coverage across the entire Senegalese territory. The results should be interpreted as primarily representative of eastern and southern Senegal, and not of the country as a whole. Secondly, the analyzed time series (1971–2010) remains relatively short for estimating high return levels, which introduces inherent uncertainty when extrapolating to longer return periods. Finally, the stationarity assumption adopted in this study does not explicitly account for the potential effects of climate change on the future evolution of hydrological extremes. Future work could incorporate a larger number of stations, more recent data, and models of non-stationary extreme values to better capture the influence of climate trends on extreme flows.
This study analyzed the annual maximum flow from five hydrometric stations located primarily in eastern and southern Senegal over the period 1971–2010 using the generalized extreme value (GEV) distribution. Comparison of several estimation methods showed that the probability weighted moments (PWM) method offers the best performance for fitting the data. Statistical tests confirmed the suitability of the Gumbel distribution for modeling the annual maximum flows. Estimating a 100-year return level 1 751 242 m3 s−1 provides essential information for water resource management, reducing hydraulic risks, and developing adaptation strategies to extreme events. Future research incorporating more extensive data and non-stationary approaches will further improve the robustness of the estimates and their applicability in a climate change context.
The analyses were conducted using R software. The scripts used to perform the statistical analyses and generate the figures are available from the corresponding author upon reasonable request.
The hydrometric data used in this study were obtained from the relevant national hydrological services and consist of annual maximum flow records from five stations in south-east Senegal for the period 1971–2010. The datasets are not publicly available because they are subject to institutional access restrictions, but they can be obtained from the corresponding author upon reasonable request and with permission from the data provider.
Conceptualization: MRH, AD; formal analysis: MRH, AD; methodology: MRH; software: MRH, AD; writing – review and corrections: MRH, AAVDO, AD; writing – first draft: MRH. All authors have read and approved the final version of the manuscript.
At least one of the (co-)authors is a guest member of the editorial board of Proceedings of the International Association of Hydrological Sciences for the special issue “Circular Economy and Technological Innovations for Resilient Water and Sanitation Systems in Africa”. The peer-review process was guided by an independent editor, and the authors also have no other competing interests to declare.
Publisher's note: Copernicus Publications remains neutral with regard to jurisdictional claims made in the text, published maps, institutional affiliations, or any other geographical representation in this paper. The authors bear the ultimate responsibility for providing appropriate place names. Views expressed in the text are those of the authors and do not necessarily reflect the views of the publisher.
This article is part of the special issue “Circular Economy and Technological Innovations for Resilient Water and Sanitation Systems in Africa”. It is a result of the 1st Edition of the C2EA Water and Sanitation Week on the Circular Economy and Technological Innovations, Cotonou, Benin, 3–6 December 2024.
The first author wishes to express her gratitude to the African Institute for Mathematical Sciences (AIMS/Senegal) for its continued support. We thank the organizers of the Water Week in Benin.
This paper was edited by Lawin Agnidé Emmanuel and reviewed by Jean Hounkpe and one anonymous referee.
Ashoori, F., Ebrahimpour, M., and Bozorgnia, A.: Modeling of maximum precipitation using maximal generalized extreme value distribution, Commun. Stat. Theory, 46, 3025–3033, https://doi.org/10.1080/03610926.2015.1034325, 2017.
Bates, B. C., Kundzewicz, Z. W., Wu, S., and Palutikof, J. P. (Eds.): Climate Change and Water. Technical Paper of the Intergovernmental Panel on Climate Change, IPCC Secretariat, Geneva, 210 pp., https://archive.ipcc.ch/pdf/technical-papers/ccw/frontmatter.pdf (last access: June 2026), 2008.
Bodian, A., Dezetter, A., and Dacosta, H.: Apport de la modélisation pluie-débit pour la connaissance de la ressource en eau: application en haut bassin du fleuve Sénégal, Climatologie, 9, 109–125, https://doi.org/10.4267/climatologie.223, 2012.
Chikobvu, D. and Chifurira, R.: Modelling of extreme minimum rainfall using generalised extreme value distribution for Zimbabwe, S. Afr. J. Sci., 111, 01–08, https://doi.org/10.17159/sajs.2015/20140271, 2015.
Douglas, E. M. and Barros, A. P.: Probable maximum precipitation estimation using multifractals: Application in the eastern United States, J. Hydrometeorol., 4, 1012–1024, https://doi.org/10.1175/1525-7541(2003)004<1012:PMPEUM>2.0.CO;2, 2003.
Faye, A., Camara, I., Noblet, M., and Mboup, S.: Evaluation de la vulnérabilité du secteur de l'agriculture à la variabilité et aux changements climatiques dans la région de Fatick, Report produced under the project, Projet d'Appui Scientifique aux processus de Plans Nationaux d'Adaptation dans les pays francophones les moins avancés d'Afrique subsaharienne, Climate Analytics GmbH, Berlin, https://www.climateanalytics.org/publications (last access: June 2026), 2021.
Faye, C.: Variability and trends in observed average monthly, seasonal and annual flows in the Falémé basin, Senegal, Hydrolog. Sci. J., 62, 259–269, https://doi.org/10.1080/02626667.2014.990967, 2017.
Habibi, B., Meddi, M., and Boucefiane, A.: Analyse fréquentielle des pluies journalières maximales Cas du Bassin Chott-Chergui, Revue Nature et Technologie, 5, 41–48, 2013.
Hosking, J. R. M.: Testing whether the shape parameter is zero in the generalized extreme-value distribution, Biometrika, 71, 367–374, https://doi.org/10.2307/2336254, 1984.
Jenkinson, A. F.: The frequency distribution of the annual maximum (or minimum) values of meteorological elements, Q. J. Roy. Meteorol. Soc., 81, 158–171, https://doi.org/10.1002/qj.49708134804, 1955.
Kagalwala, A.: kpsstest: A command that implements the Kwiatkowski, Phillips, Schmidt, and Shin test with sample-specific critical values and reports p-values, Stata J., 22, 269–292, https://doi.org/10.1177/1536867X221106371, 2022.
Kouassi, K. M., Meledje, N. H., Koffi, Y. B., Kouassi, K. L., Ahoussi, K. E., Oga, Y. M. S., Biemi, J., and Soro, N.: Modélisation statistique des extrêmes de pluies à différentes échelles de temps: comparaison des approches théorique et pratique, Revue Ivoirienne des Sciences et Technologies, 34, 368-388, 2019.
Mahé, G.: Variabilité pluie-débit en Afrique de l'Ouest et Centrale au 20ème siècle: changements hydro-climatiques, occupation du sol et modélisation hydrologique, Université de Montpellier II, Montpellier, France, 2, 160, https://doi.org/10.13140/2.1.1041.1046, 2006.
Martins, E. S. and Stedinger, J. R.: Generalized maximum-likelihood generalized extreme-value quantile estimators for hydrologic data, Water Resour. Res., 36, 737–744, https://doi.org/10.1029/1999WR900330, 2000.
Mballo, I., Sy, O., and Faye, C.: Variabilité climatique et productions vivrières en Haute Casamance (Sud-Sénégal), Espace Géographique et Société Marocaine, 28/29, https://hal.science/hal-02432388v1 (last access: June 2026), 2019.
Onyeka-Ubaka, J. N. and Ogundeji, R. K.: Optimal stochastic forecast models of rainfall in South-West region of Nigeria, International Journal of Mathematical Sciences and Optimization: Theory and Applications, 7, 1–20, https://doi.org/10.52968/28306097, 2021.
Sakli, L.: Modélisation et évaluation des vulnérabilités et des risques dans les chaînes logistiques, Doctoral dissertation, Aix Marseille Universitè, https://hal.science/tel-03527511v1 (last access: June 2026), 2016.
Sanogo, S.: Observations et modélisation des extrêmes de précipitation aux échelles saisonnière à interannuelle au Sahel, Doctoral dissertation, Institut National Polytechnique de Toulouse-INPT, https://hal.science/tel-04124637v2 (last access: June 2026), 2022.
Sarr, M. A., Seidou, O., Tramblay, Y., and El Adlouni, S.: Comparison of downscaling methods for mean and extreme precipitation in Senegal, J. Hydrol., 4, 369–385, https://doi.org/10.1016/j.ejrh.2015.06.005, 2015.
Seidou, S., Ouassa, P., Atchade, G., and Vissin, E. W.: Caractérisation des risques hydroclimatiques dans la Basse Vallée de l'Oueme Au Benin (Afrique de l'Ouest) [Characterization of hydroclimatic risks in the Lower Valley of the Oueme in Benin (West Africa)], International Journal of Progressive Sciences and Technologies, 25, 334–348, 2021.
Touré, I., Sarr, M., Leye, I., Sambou, S., and Sané, M. L.: Caractérisation et modélisation par GEV de la variabilité climatique sur les ressources en eau dans la région de Kaolack au Sénégal, Int. J. Water Sci. Environ. Technol., 8, 35–47, 2023.
Yousfi, N.: Modélisation bayésienne non-stationnaire des évènements hydrométéorologiques extrêmes au Nouveau-Brunswick, Université de Moncton, https://hdl.handle.net/20.500.14658/6521 (last access: June 2026), 2016.
Westra, S., Alexander, L. V., and Zwiers, F. W.: Global increasing trends in annual maximum daily precipitation, J. Climate, 26, 3904–3918, https://doi.org/10.1175/JCLI-D-12-00502.1, 2013.