the Creative Commons Attribution 4.0 License.
the Creative Commons Attribution 4.0 License.
Backwater effect in lowland regions due to bridge structure: a case study of Shreekhandapur, Kavre, Nepal
Rizbi Buddhacharya
Sailesh Maharjan
Rupesh Choudhary
Shyam Sundar Khadka
Santosh Chaudhary
The backwater effect can be caused by a number of factors, including the bridge's pier width and deck level. In lowland regions, the backwater effect can be particularly problematic, as it can lead to flooding and inundation of farmlands and houses. This study examines the impact of bridge structure on the backwater effect in the lowland region of Shreekhandapur, Kavre, Nepal. The study area is characterized by a hill slope and inner river valley, with a gentle river profile that results in low flow velocity and increased deposition. The study compares the backwater effect of an old demolished bridge with four piers of 1.2 m width and abutments on both sides to a new bridge with a single pier of 0.4 m width and a deck level that is 1 m higher. HEC-RAS software was used to analyse the steady flow and create a flood hazard map. The results show that the new bridge with a reduced pier width and increased deck level significantly reduces the backwater effect. The flood hazard map shows that the new bridge along with floodwalls reduces the potential hazard-prone areas by up to 50 %. The findings of this study can be applied to disaster mitigation and bridge design in lowland regions. By reducing pier width and increasing deck level, bridges can be designed to minimize the backwater effect and reduce the risk of flooding.
- Article
(4953 KB) - Full-text XML
- BibTeX
- EndNote
Bridges are remarkable engineering structures that play a crucial role in connecting two separate landmasses or crossing obstacles such as rivers, valleys, or other physical barriers. These bridges have been a part of human history for thousands of years, evolving from simple wooden or stone structures to intricate, modern designs made of steel, concrete, and other advanced materials.
Flooding is the most common natural catastrophe in Nepal. In addition to river flooding during the monsoon, other flood hazards include flash floods caused by excessive rainfall in high areas, glacial lake outburst floods (GLOFs), landslide-induced flooding, and infrastructure flooding (such as embankment failure). Nepal is considered to be the second-highest South Asian nation vulnerable to flood risks. Floods in Nepal between 1954 and 2018 resulted in 7599 fatalities, 6.1 million impacted, and USD 10.6 billion in losses to the economy (EmDAT, 2019). In 2017, 179 people died, more than 75 people were injured, 42 individuals went missing, and the impact extended to 15 303 households (Sharma et al., 2019). Flash flooding can happen in hilly and mid-hill areas when heavy rain falls in a brief period of time, causing high levels of surface water to flow into existing streams and rivers.
Backwater means the increase in water surface level immediately upstream from bridges caused by the resulting reduction in the conveyance area. In a study of the causes of failure of 143 bridges worldwide, it was found that 70 % failed due to flood events (Shamkhi and Salim, 2018). This highlights the importance of understanding the interaction of water flow with bridge structures, rather than considering the bridge structure in isolation.
Therefore, understanding the backwater effect and its implications is crucial for the selection of safe and efficient design of bridges.
Urban flooding is brought about by heavy rain falling on built-up surfaces with limited drain capacity. Urban flooding can be summed up as “excessive runoff in developed urban areas, where the storm water has nowhere to go due to low drainage system capacity, creating inundations.”
An increase in the frequency of urban flood events is becoming a global phenomenon, posing a significant challenge to planners worldwide. The size of these flood events can vary, ranging from a small neighbourhood occurrence to a major catastrophe that submerges urban areas for several hours to multiple days.
Urban floods are a non-natural disaster brought on by overworked drainage systems, haphazard construction, and a disrespect for hydrogeomorphology and natural terrain. Flooding in urban areas is induced not only by unusually heavy rains but also by our cities' misguided approach to urbanization (Shrestha, 2022).
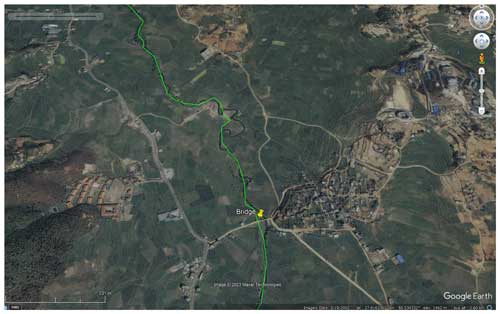
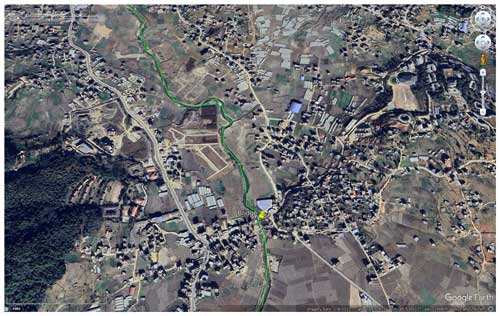
Figures 1 and 2 indicate the unplanned haphazard urbanization in which inundation may cause various problems.
2.1 Study area
Every year the monsoon flood inundates the study area, i.e. the Shreekhandapur area. The Punyamata Khola bridge is situated across the Punyamata River in Shreekhandapur, Kavre. The study area is located in Panauti Municipality, Ward no. 2, Kavrepalanchok District, in Bagmati Province, Nepal. The study area is characterized by a hill slope and inner river valley, with a gentle river profile of 1 % that results in low flow velocity and increased deposition of soil sediments. Every monsoon, due to heavy rainfall and cloudburst in the Nala area, there is flash flooding of the Punyamata River. Every year, homes and agricultural areas are submerged as a result of flash flooding. This results in loss of life and property. In the Pulbazar region of Banepa, the flooding results in traffic jams, halting the traffic for several hours till the water level resides. It is estimated that approximately NPR 50 lakh1 financial loss is incurred if the traffic is disrupted for an hour (Shrestha, 2022). Floods also swept away cooking gas cylinders from Sagarmatha Gas Udhyog, Surya Gas Udhyog, and Chandeshwori Gas Udhyog in 2016.
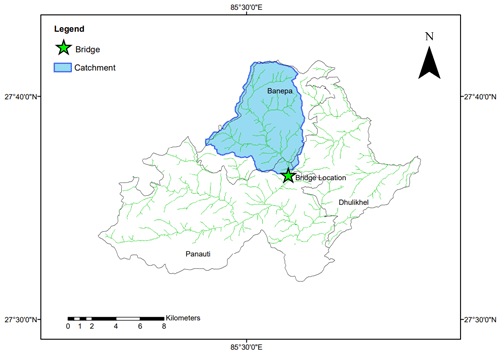
Figure 3 indicates the Punyamata bridge site location and the catchment area.
2.2 Input data
2.2.1 Bridge description
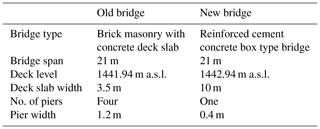
The salient features of the old and new bridge are given in Table 1.
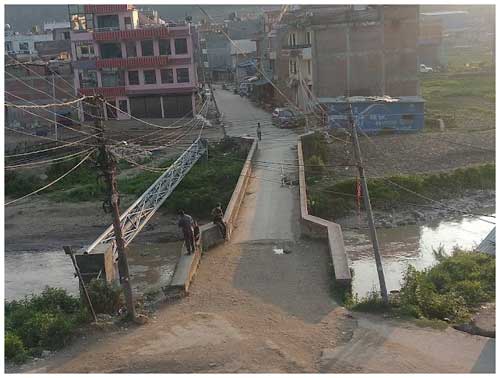
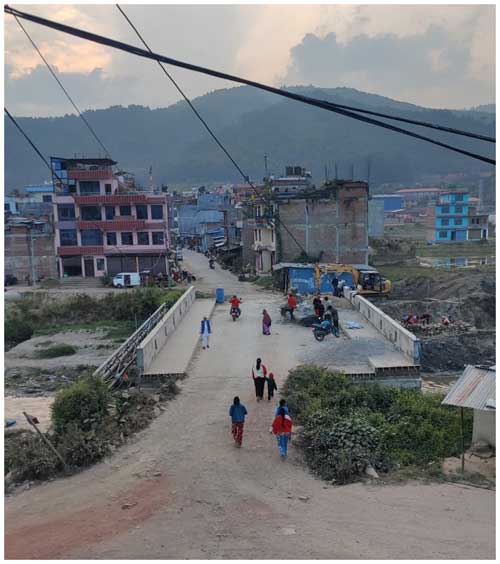
The old Punyamata Khola bridge and the new Punyamata Khola bridge are shown in Figs. 4 and 5, respectively, and their salient features are shown in Table 1. From these salient features, we can clearly see that for the new bridge, a design with fewer piers (i.e. one) than the old bridge (i.e. four) was adopted. Also, the pier width was reduced to 0.4 m in the new bridge from 1.2 m in the old bridge.
2.2.2 Survey data
The survey data of the study area were provided by Dhulikhel Municipality at a resolution of 3.5 m. The digital elevation model (DEM) of the study area was generated with help of the survey data.
2.2.3 Hydrologic and hydraulic data
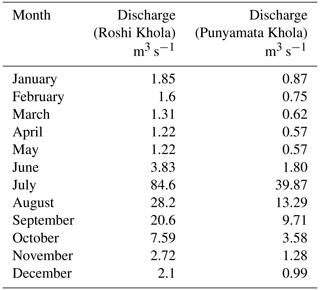
Table 2 gives the catchment area of the Punyamata bridge site location along with the catchment area of Roshi Khola.
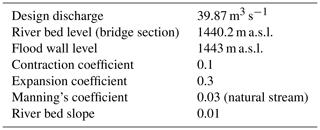
Table 3 shows the maximum monthly river discharge for 1975, and Table 4 shows the hydraulic data of the bridge site location.
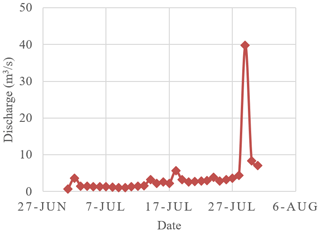
Figure 6 shows the daily discharge for July 1975.
2.3 Methodology
2.3.1 Flood calculation methodology
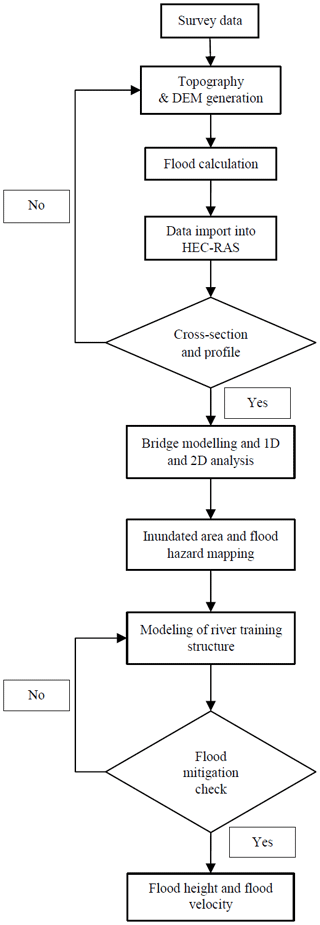
A DEM generated from survey data was used in HEC-RAS topography, and then data from Table 4 were used to model the bridge in HEC-RAS. Flow data from Table 3 and the method by Betram Darell Richards (hereafter B. D. Richards) were used to estimate the high flood level for the old and new bridge. Using the DEM, cross sections were modelled along the river path. Analysis of flood data was done in four different ways: 1D and 2D analysis, each with the old bridge and the new bridge.
As no stations were available in the catchment area for the precipitation calculation, data from the Roshi Khola catchment area were used to calculate flood discharge as a reference for our site.
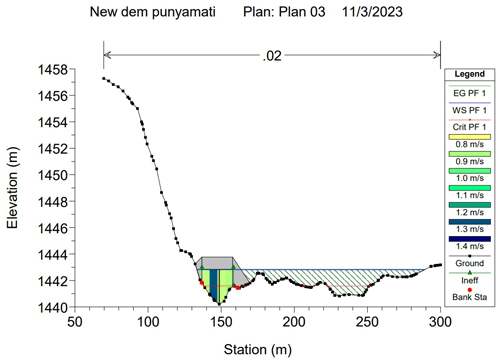
For 1D analysis, different discharge levels were measured, as shown in Table 3 and as calculated by B. D. Richards' method. The piers and the wing wall were modelled as shown in Figs. 8 and 9. Ineffective flood areas were also assigned to the left and right side of the bridge. The backwater effect was observed for 100 m upstream of the bridge, which showed supercritical flow approaching the bridge.
As the catchment was ungauged, we used the B. D. Richards method to validate the discharge obtained by the catchment area ratio (CAR) method. The meteorological data of four stations near the catchment were recorded to determine the rainfall intensity in the catchment. Using the rainfall data, we determined the flood discharge for a return period of 50 years.
Figure 7 shows the methods used for flood simulation.
2.3.2 Catchment area ratio method
The estimation and the modelling of the availability and quality of water supply and the ecological assessment require reliable estimation of flow. The ratio method is used to estimate flow in an ungauged catchment when a nearby gauged watershed is present for use as a reference. The method estimates flow at an ungauged location by multiplying the measured flow at the nearby reference gauge by the area ratio of the ungauged to gauged watershed. Discharge of an ungauged river is calculated using the following formula:
where Q2 is the discharge of the studied (ungauged) river, Q1 is the discharge of reference (gauged) river, A2 is the area of the studied catchment, and A1 is the area of the reference catchment.
For 2D analysis, flood data from 1 July 1975 to 31 July 1975 were taken as this month recorded the highest rainfall in the region, as shown in Fig. 6. Meshing of the surface was done along the river between the inlet and outlet. For analysis, the bridge and piers were modelled as shown in Figs. 8 and 9.
2.3.3 B. D. Richards' method
B. D. Richards' method may be used for flood estimation using rainfall and basin characteristics. The flood discharge Q in m3 s−1 is calculated using the following equation:
where A is the basin area (in km2), I is the rainfall intensity corresponding to the time of concentration TC, and F is an aerial reduction factor given as follows:
The Thiessen polygon method is used to determine the rainfall intensity of the ungauged catchment. The assessment of flood discharge indicates that the peak discharge increases with an increase in duration of the return period. B. D. Richards' method gave the higher flood discharge for a return period of 50 years, and hence it is used in this study to estimate the flood discharge.
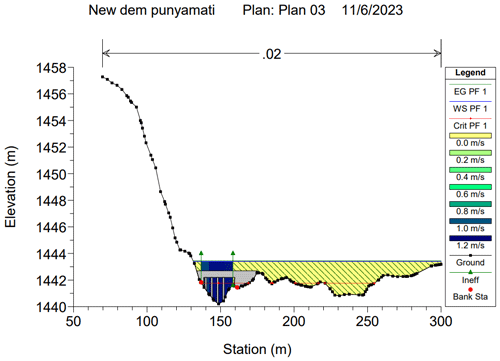
For financial reasons, the bridge is typically situated where the least deck span is present. HEC-RAS was used to model the backwater effect caused by the old bridge. With a high flood level of 1443.46 m a.s.l., it was discovered that the water level would surpass the deck level of the old bridge.
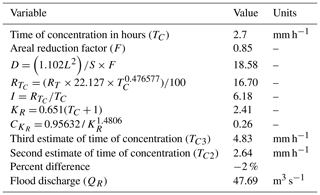
The river discharge calculated by B. D. Richards' method is given in Table 6.
The discharge was calculated to be 47.69 m3 s−1. For the discharge calculation by B. D. Richards, the data from Table 5 have been used.
By simulating a new bridge with a higher deck level and fewer piers, the high flood level was lowered from 1443.46 m a.s.l., as shown in Fig. 8, to 1442.86 m a.s.l., as shown in Fig. 9. The new bridge lowered the flood level by 0.6 m as a result of the backwater effect caused by the previous bridge's piers.
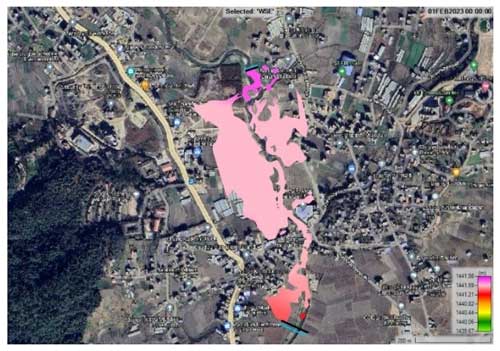
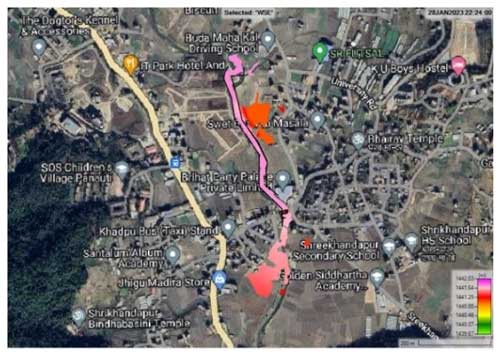
Even though the new bridge passed the maximum flood discharge, there was minimum change in the inundation area, as shown in Fig. 10. Because this study area is a lowland area with a modest slope to the river bed, the bridge's placement created a bottleneck in the terrain, which caused the upstream area to flood.
If not for the piers, supercritical flow would have continued and the flow velocity would have continued to reduce with the new bridge. This can be explained by the reduction in piers in the bridge model, which is in agreement with the analysis by Costabile et al. (2015).
Thus, we modelled a floodwall with a height of 3 m upstream of the bridge to lessen the area that would be flooded. The floodwall model led to more than 50 % reduction in the inundation area, as shown in Fig. 11.
This study focuses on the backwater effect caused by the bridge's pier width and deck level in lowland regions. The practice of constructing pier bridges should be minimized in low-lying areas as they can be susceptible to flooding. The selection of bridge site should be properly analysed considering both the economic and topographical site conditions. River training works, which include measures such as embankments, spurs, and revetments, can indeed be very effective in preventing flooding and inundation in these regions. So, rather than designing bridges in isolation, environmental factors should be considered as well. Using the 3 m floodwalls in our study helped to reduce the flooding by more than 50 %.
Moreover, urban planning plays a crucial role in mitigating such problems. Future urban planning should consider factors such as flood zoning and proper drainage systems to prevent waterlogging. It is important to ensure that infrastructure is resilient and capable of withstanding extreme weather events.
Survey data were provided by Dhulikhel Municipality at a resolution of 3.5 m. The digital elevation model (DEM) of the study area was generated with the help of survey data. The meteorological data were taken from the Department of Hydrology and Meteorology of Nepal and can be provided upon request.
SSK did the conceptualization, methodology, formal analysis, and supervision. SC participated in conceptualization, methodology, and supervision. RB participated in data collection, data analysis, and writing (original draft and review and editing). SM participated in data analysis, interpretation of results, and writing (review and editing). RC participated in data collection and writing (review and editing).
The contact author has declared that none of the authors has any competing interests.
Publisher's note: Copernicus Publications remains neutral with regard to jurisdictional claims made in the text, published maps, institutional affiliations, or any other geographical representation in this paper. While Copernicus Publications makes every effort to include appropriate place names, the final responsibility lies with the authors.
This article is part of the special issue “Mountain Hydrology and Cryosphere”. It is a result of the International Conference on Mountain Hydrology and Cryosphere, Kathmandu and Dhulikhel, Nepal, 9–10 November 2023.
Dipesh Thapa of Zest Engineering Solutions Pvt. Ltd is acknowledged for his guidance on hydraulic modeling.
Costabile, P., Macchione, F., Natale, L., and Petaccia, G.: Comparison of scenarios with and without bridges and analysis of backwater effect in 1-D and 2-D river flood modeling, CMES-Comp. Model. Eng., 109–110, 81–103, 2015.
EmDAT: The CRED/OFDA International disaster Database, https://www.emdat.be/ (last access: 3 October 2023), 2019.
Shakya, D. M.: Guidelines on Hydrologic and Hydraulic Analysis and River Training Works for Bridge Design, Department of Roads, https://dor.gov.np/uploads/publication/publication_1642584636.pdf (last access: 13 October 2023), 2022.
Shamkhi, M. S. and Salim, M.: Experimental study of the effect of contraction ratio on backwater by using bridge pier as flow obstruction, 3rd International Energy & Engineering Congress Proceedings Book, https://www.researchgate.net/publication/328723349_EXPERIMENTALL_STUDY_OF_THE_EFFECT_OF_CONTRACTION_RATIO_ON_BACKWATER_BY_USING_BRIDGE_PIER_AS_FLOW_OBSTRUCTION (last access: 13 October 2023), 2018.
Sharma, T. P., Zhang, J., Koju, U. A., Zhang, S., Bai, Y., and Suwal, M. K.: Review of flood disaster studies in Nepal: A remote sensing perspective, Int. J. Disast. Risk Re., 34, 18–27, 2019.
Shrestha, A.: Framing the Challenges of Urban Flooding on Accessibility, in: Proceedings of 12th IOE Graduate Conference, 19–22 October 2022, Thapathali Campus, IOE, TU, Kathmandu, Nepal, http://conference.ioe.edu.np/publications/ioegc12/IOEGC-12-066-12101.pdf (last access: 15 October 2023), 2022.
1 lakh is equal to 100 000.
Our study examined the backwater effect due to bridge piers in lowland areas. The results showed that replacing the old bridge with a new design featuring fewer and narrower piers, along with a higher deck level, reduced the backwater effect and flood levels. Also, using a 3 m floodwall upstream further decreased inundated area by over 50 %. These findings highlight the consideration of environmental factors in bridge design to mitigate flood risks.
Our study examined the backwater effect due to bridge piers in lowland areas. The...


