the Creative Commons Attribution 4.0 License.
the Creative Commons Attribution 4.0 License.
Assessing the characteristics of extreme floods in Nepal
Aabhash Bhattarai
Utsav Bhattarai
Koshish Raj Maharjan
Laxmi Prasad Devkota
This study examines the characteristics (magnitudes, trends, and frequency of occurrences) of extreme floods in Nepal, a country that is at significant risk from floods. Daily discharge data from 1980 to 2015 of three gauging stations (Chisapani of Karnali Basin, Devghat of Narayani Basin, and Chatara of Koshi Basin) were used to assess the largest 1 % of flows, the annual top five high flows, and floods of different return periods (2-, 5-, 10-, 20-, and 100-year). In addition, temporal trend analysis of the flood peaks was carried out using the Mann–Kendall test and Sen's slope estimates. Results show that the magnitudes of the largest 1 % flows range from 6310 to 17 900, from 6967 to 12 100, and from 6080 to 9610 m3 s−1 at Chisapani, Devghat, and Chatara, respectively. The monsoon, especially from mid-June to early September, consistently witnesses over 90 % of 1 % extreme flows, with August registering more than 51 % of these occurrences. July and August combine for 81 % of the top five flow events, predominantly in August. Despite insignificant flow changes at a 95 % confidence level, extreme floods (2-, 5-, 10-, 20-, and 100-year return periods) are concentrated heavily in July and August, with August's second fortnight recording the most flood events. This assessment emphasizes July and August as critical months for extreme floods, aiding Nepalese authorities in planning dynamic resource allocation, disaster response, and effective flood management.
- Article
(2549 KB) - Full-text XML
- BibTeX
- EndNote
Floods yield catastrophic consequences: casualties, ravaging of infrastructure and property, and uprooting of communities. Astonishingly, of the 11 072 disasters reported globally between 1970 and 2019, a staggering 44 % were attributed to floods leading to 330 000 deaths and economic losses worth USD 3.6 trillion (WMO, 2019). These figures underscore the urgent need to better comprehend flood behavior and implement effective flood management strategies, particularly in vulnerable developing countries.
In the context of Nepal, the recurring specter of floods has ingrained itself as a formidable natural challenge, wreaking extensive devastation throughout its topographically diverse landscape. Nepal is ranked 10th in the world for the highest percentage of its total gross domestic product (GDP) being affected by river floods each year (Luo et al., 2015). For example, the 2017 floods impacted 35 of the country's 77 districts and completely destroyed or partially damaged more than 190 000 houses, displaced tens of thousands of people, and made many homeless (National Planning Commission, 2017).
Past flood-related studies in Nepal delved into different aspects of flood disasters. For instance, Bhattarai et al. (2022) modeled the socioeconomic impacts of floods in the East Rapti River under climate change. Similarly, Devkota et al. (2013) used indicators to analyze people's perceived flood vulnerability in two southern districts. Moreover, the hydrological cycle has been altered due to land use change (Devkota et al., 2023). Thus, a collective analysis of the most extreme flood magnitudes together with their occurrences, temporal variation, and trends needs attention. This study attempts to contribute to these aspects.
While extensive research has focused on assessing the magnitudes of floods (Aryal et al., 2020; Devkota et al., 2020; Gautam and Dulal, 2013), there remains a notable gap in analyzing their temporal distribution. Similarly, most previous studies, such as Adhikari et al. (2023) and Khatiwada et al. (2018), were carried out in specific river basins. Hence, a comprehensive examination of the temporal flood behavior consisting of the major river basins of Nepal is needed. We focus our research on addressing these issues.
Therefore, this study seeks to conduct a comprehensive analysis of extreme flood events considering long-term hydrological data, focusing on the temporal distribution of extreme flood occurrences at the outlets of Nepal's three major river basins. Specifically, it aims to carry out trend analysis of the mean daily flood peaks and to analyze the temporal distribution of the top 1 % of extreme flows, the five highest annual flows, and floods of different return periods at fortnightly resolution.
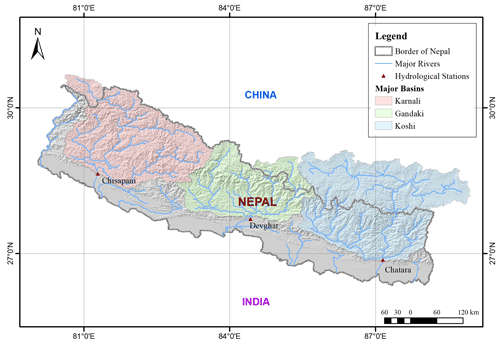
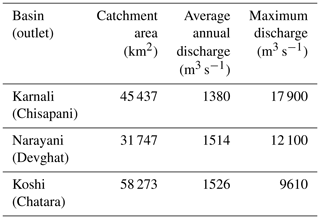
This study was carried out in Nepal, considering the outlets of the three largest river basins: Karnali at Chisapani, Narayani at Devghat, and Koshi at Chatara (Fig. 1). Table 1 shows the characteristics of the study basins.
Daily flow data from 1980 to 2015 of three hydrological stations (Chisapani, Devghat, and Chatara) were obtained from the Department of Hydrology and Meteorology (DHM), Government of Nepal. The top 1 % of the flows for each station were extracted for this duration. Similarly, the five highest flows from the 36 years were also extracted for each station. The counts of extreme flows across each fortnight were calculated. The contribution of each fortnight to the occurrences of these extreme flows was also quantified for the analysis of the temporal distribution of the top 1 % flows and the five highest flows. Trend analysis of the annual maximum of daily flows was carried out using the Mann–Kendall (MK) test and Sen's slope estimates. Since the trend analysis showed that changes in flows are insignificant at a 95 % confidence level, flood frequency analysis of the annual maximum of daily flows was carried out using the stationary approach based on Gumbel's extreme-value distribution method for flood magnitudes of 2-, 5-, 10-, 20-, and 100-year return periods for each of the three stations. The count of the flows exceeding the magnitudes of different return period floods was calculated. The contribution of each fortnight to the occurrences of these extreme flows was also quantified for the analysis of the temporal distribution of extreme flows of varying return periods.
4.1 Temporal distribution of the top 1 % extreme flows
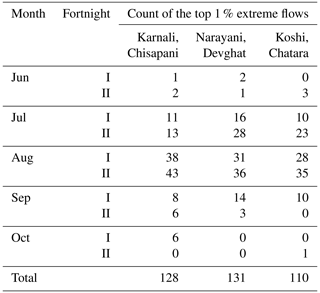
Table 2 shows the extreme flows from 1980 to 2015 across months and fortnights. It is evident that the highest frequencies of extreme flows occur between June and September. Specifically, from the second fortnight of June to the first fortnight of September, the majority of the top 1 % extreme flows are recorded, with 90 % () occurring at Chisapani, 96 % () at Devghat, and 99 % () at Chatara. Among the four months, 63 % (), 51 % (), and 57 % () of the highest 1 % extreme flows occurred in August at Chisapani, Devghat, and Chatara, respectively.
These results reveal several insights. Firstly, the range of magnitudes for the largest 1 % flows at Chisapani, Devghat, and Chatara vary considerably across the stations, which can be attributed to geographical variations and catchment characteristics. In general, the observed concentration of the top 1 % of extreme flows during the monsoon season (June to September) substantiates the widely held notion that the monsoon period is the highest contributor to such events in Nepal. However, a new insight is that the preponderance of extreme flows occurs from the second fortnight of June to the first fortnight of September, which corresponds to the Nepali months of Asadh, Shrawan, and Bhadra rather than the entire 4-month monsoon period. Notably, August emerges as the most pivotal month, accounting for a substantial majority of extreme flood occurrences, possibly due to saturated soil conditions because of sustained heavy rainfall. Given the country's limited infrastructure and technological resources for flood management, our analysis underscores the urgent need for a more dynamic disaster preparedness strategy. Rather than adopting a blanket approach, our findings endorse the allocation of fewer resources in June, increasing in July, peaking in August, and decreasing in September to align with extreme flow patterns.
4.2 Temporal distribution of the five highest flows
Figure 2 depicts the five highest flows from each of the 36 years. Results reveal that July and August account for more than 83 %, 81 %, and 84 % of the top five flows at Chisapani, Devghat, and Chatara, respectively.
Table 4 lists the frequency of occurrences of the five highest flows from 1980 to 2015. Furthermore, it is evident that July and August consistently account for a significant majority of these extremes.
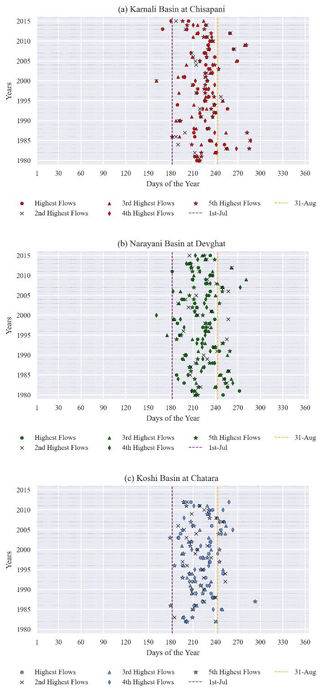
Figure 2Scatterplot of the five highest flows at (a) Chisapani (Karnali), (b) Devghat (Narayani), and (c) Chatara (Koshi).
Similar to the previous analysis, this examination reinforces the need for a dynamic approach to disaster response and preparedness, ensuring that resources and strategies are strategically allocated to coincide with the heightened flood risk during crucial periods.
4.3 Trend analysis of flood peaks
Trend analysis of the annual maximum of daily flows at a 95 % confidence level showed statistically insignificant trends for all the stations (Table 3). Thus, assuming stationarity in the series, Gumbel's distribution (Chow et al., 1988), being simpler and more popular (Adhikari et al., 2023; Aryal et al., 2020; Dhakal et al., 2023; Dingle et al., 2020), was used for flood frequency analysis in this study.
4.4 Temporal distribution of extreme flows of different return periods
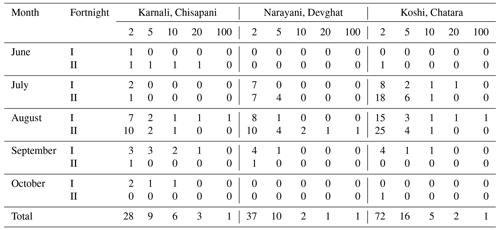
Table 5 lists the distribution of extreme flows by months and fortnights equalling or exceeding floods of different return periods. In the case of Chisapani, a significant proportion of extreme floods, approximately 60 % (), is concentrated in the months of July and August. Notably, August stands as the primary contributor, accounting for 53 % () of these extremes. Moreover, it is evident that the second fortnight contributes more (52 %, ) to the August floods than the first fortnight (48 %, ). Interestingly, floods with higher return periods (20- and 100-year) tend to occur more frequently in the first fortnight of August. Similarly, for Devghat, the majority of extreme floods, approximately 88 % (), are concentrated in the months of July and August. August again contributes most (53 %, ) of these extreme events. Similarly to Chisapani, the second fortnight accounts for 67 % () of August's extreme floods, compared to the first fortnight (33 %, ).
It is notable that the occurrence of floods with higher return periods (20- and 100-year) is more frequent in the second fortnight of August. In the case of Chatara, a remarkable 92 % () of the extreme floods occur in July and August combined, with August accounting for 53 % () of these extreme events. A closer examination reveals that the second fortnight has a larger contribution of 59 % () of the extreme floods. Similar to the case of Chisapani, floods of 20 and 100 years tend to occur more frequently in the first fortnight of August.
These results reveal interesting flood patterns across the three stations. As anticipated, the magnitude of peak floods escalates, while the frequency is reduced with larger return periods. Nevertheless, the most remarkable revelation is the prominence of August, which emerges as the month exhibiting the most concentrated instances of extreme floods. These findings have significant implications for disaster response and preparedness in Nepal, underscoring a greater focus on the month of August.
This study analyzed the temporal distribution of the top 1 % of extreme flows and the five highest flows annually, and it examined the occurrences of extreme flows of different return periods of Nepal at fortnightly resolution.
Our results demonstrate substantial variability in flood magnitudes across Chisapani, Devghat, and Chatara, with a pronounced concentration of extreme flows during the second fortnight of June to the first fortnight of September, with August being the most critical month. Additionally, the temporal trends shown by the flood peaks are not significant. Moreover, the temporal distribution of floods of different return periods emphasizes the pivotal significance of August for effective flood management. We conclude that a dynamic approach to flood disaster preparedness and response is required for Nepal. Under conditions of constrained resources, focus on strategic resource allocation that peaks in August is preferable for enhancing disaster resilience and optimizing flood management efforts. Future studies could benefit from expanding the analysis to include an extended number of gauging stations across the river network for devising localized disaster management strategies.
The flow data were obtained from the Department of Hydrology and Meteorology, Government of Nepal (https://www.dhm.gov.np/, last access: 31 July 2024).
AB did the conceptualization, did the major analysis, and wrote the first draft of the manuscript. UB reviewed the manuscript. KRM supported the analysis. LPD reviewed the final manuscript.
The contact author has declared that none of the authors has any competing interests.
Publisher’s note: Copernicus Publications remains neutral with regard to jurisdictional claims made in the text, published maps, institutional affiliations, or any other geographical representation in this paper. While Copernicus Publications makes every effort to include appropriate place names, the final responsibility lies with the authors.
This article is part of the special issue “Mountain Hydrology and Cryosphere”. It is a result of the International Conference on Mountain Hydrology and Cryosphere, Kathmandu and Dhulikhel, Nepal, 9–10 November 2023.
Adhikari, T. R., Baniya, B., Tang, Q., Talchabhadel, R., Gouli, M. R., Budhathoki, B. R., and Awasthi, R. P.: Evaluation of post extreme floods in high mountain region: A case study of the Melamchi flood 2021 at the Koshi River Basin in Nepal, Nat. Hazards Res., 3, 437–446, https://doi.org/10.1016/j.nhres.2023.07.001, 2023.
Aryal, D., Wang, L., Adhikari, T. R., Zhou, J., Li, X., Shrestha, M., Wang, Y., and Chen, D.: A model-based flood hazard mapping on the southern slope of Himalaya, Water (Switzerland), 12, 540, https://doi.org/10.3390/w12020540, 2020.
Bhattarai, R., Bhattarai, U., Pandey, V. P., and Bhattarai, P. K.: An artificial neural network-hydrodynamic coupled modeling approach to assess the impacts of floods under changing climate in the East Rapti Watershed, Nepal, J. Flood Risk Manag., 15, e12852, https://doi.org/10.1111/jfr3.12852, 2022.
Chow, V. Te, Maidment, D. R., and Mays, L. W.: Applied hydrology, McGraw-Hill, 572 pp., ISBN 0070108102, 1988.
Devkota, P., Dhakal, S., Shrestha, S., and Shrestha, U. B.: Land use land cover changes in the major cities of Nepal from 1990 to 2020, Environ. Sustain. Indic., 17, 100227, https://doi.org/10.1016/j.indic.2023.100227, 2023.
Devkota, R., Bhattarai, U., Devkota, L., and Maraseni, T. N.: Assessing the past and adapting to future floods: a hydro-social analysis, Clim. Change, 163, 1065–1082, https://doi.org/10.1007/s10584-020-02909-w, 2020.
Devkota, R. P. D.: Flood Vulnerability through the Eyes of Vulnerable People in Mid-Western Terai of Nepal, J. Earth Sci. Clim. Change, 4, 132, https://doi.org/10.4172/2157-7617.1000132, 2013.
Dhakal, S., Bhattarai, U., Marahatta, S., and Devkota, P.: Impact of climate change on the full spectrum of future low flows of Budhigandaki River Basin in Nepal using Gumbel distribution, Int. J. Energy Water Resour., 7, 191–203, https://doi.org/10.1007/s42108-022-00214-z, 2023.
Dingle, E. H., Creed, M. J., Sinclair, H. D., Gautam, D., Gourmelen, N., Borthwick, A. G. L., and Attal, M.: Dynamic flood topographies in the Terai region of Nepal, Earth Surf. Proc. Landf., 45, 3092–3102, https://doi.org/10.1002/esp.4953, 2020.
Gautam, D. K. and Dulal, K.: Determination of Threshold Runoff for Flood Warning in Nepalese Rivers, Journal of Integrated Disaster Risk Management, 3, 125–136, https://doi.org/10.5595/idrim.2013.0061, 2013.
Khatiwada, K. R., Panthi, J., Shrestha, M. L., and Nepal, S.: Hydro-climatic variability in the Karnali River Basin of Nepal Himalaya, Climate, 6, 74, https://doi.org/10.3390/cli4020017, 2018.
Luo, T., Maddocks, A., Iceland, C., Ward, P., and Winsemius, H.: World's 15 Countries with the Most People Exposed to River Floods, https://www.wri.org/insights/worlds-15-countries-most-people-exposed-river-floods (last access: 30 July 2024), 2015.
Mann, H. B.: Nonparametric Tests Against Trend, Econometrica, 13, 245–259, 1945.
National Planning Commission: Nepal Flood 2017: Post Flood Recovery Needs Assessment, Government of Nepal, Kathmandu, https://un.org.np/sites/default/files/doc_publication/2018-11/PFRNA_Report_Final.pdf (last access: 30 July 2024), 2017.
World Meteorological Organization: WMO atlas of mortality and economic losses from weather, climate and water extremes, 90 pp., ISBN 9789263112675, 2019.


