the Creative Commons Attribution 4.0 License.
the Creative Commons Attribution 4.0 License.
An integrated design discharge calculation system for small to mid-sized ungauged catchments in Serbia
Nikola Zlatanović
Mamoru Miyamoto
This study deals with the application of freely available datasets on the global and local level coupled with open source GIS software in hydrological modelling, greatly improving cost and time effectiveness of hydrological analyses of ungauged catchments. The automated calculation system was developed as an extremely useful tool for hydrologists for the quick estimation of design discharges. The morphometric module of the calculation system showed excellent results, saving a great deal of time that would otherwise been spent on manual processing of geospatial data. Using the automated calculation system, the methodologies currently in use in hydrological practice in Serbia were evaluated. The distributed velocity method was introduced as a way of calculating hydrograph lag time. The comparison between design discharges calculated by rainfall-runoff analysis and by frequency analysis yielded very good resemblance. Examples of real-world application for over 2500 catchments are shown.
- Article
(2014 KB) - Full-text XML
- BibTeX
- EndNote
In Serbia, catchments with area less than 100 km2 are for the most part ungauged, and a good number of larger catchments remain ungauged. Very often, design discharges are needed for these rivers where no streamflow data is available, for various applications. Examples include river training works for flood protection measures or erosion control, culvert design, small hydropower plants etc.
Current hydrological practice still mainly relies on numerous manual methods of handling data and calculations. This is partly due to the segregation and inadequate form of the necessary data, and partly due to experts lacking the GIS skills needed for the efficient manipulation of spatial data.
The purpose of this study is to: (1) identify datasets that can readily be used for hydrological modelling, to overcome data availability issues, (2) create an integrated design discharge calculation system, to greatly speed up the modelling process, (3) evaluate the existing methodologies used for predicting discharge in ungauged catchments, and (4) introduce modifications to the methodology in order to improve accuracy.
Serbia is located at the crossroads of Central and Southeast Europe, covering the southern part of the Pannonian Plain and the central Balkans. A landlocked country, Serbia borders Hungary to the north; Romania and Bulgaria to the east; Macedonia to the south; and Croatia, Bosnia, and Montenegro to the west; it also borders Albania through the disputed territory of Kosovo.
The study area of this study is the region of Serbia south of the Danube and Sava rivers (Fig. 1). This area is predominantly hilly and mountainous, with a moderately dense network of rainfall and water level gauging stations, making it suitable for rainfall-runoff analysis of small-to-mid sized catchments.
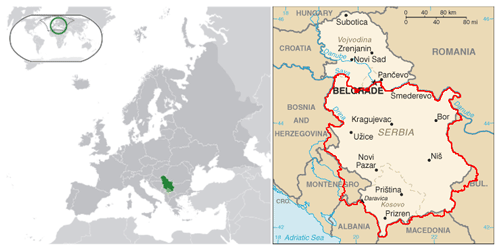
Figure 1Location of Serbia, with study area outlined in red (basemap source: The World Factbook, 2017).
Out of a total of 28 gauged catchments in this region with area less than 500 km2, 21 have been chosen for the study. The criteria for choosing the catchments were: (1) natural catchment hydrology is dominant, (2) the actual catchment area corresponds to topographic catchment area, (3) sufficient time series of data are available, and (4) there have not been major changes in the catchment during the course of observations that influence catchment runoff.
The SRTM DEM (Shuttle Radar Topography Mission Digital Elevation Model) (Rodriguez et al., 2005), with a resolution of 3 arcsec, was downloaded for the entire territory of Serbia, with some margin to account for some transboundary basins. The downloaded original digital elevation model was pre-processed using void-filling interpolation and a combination of sink filling and drainage route deepening techniques in order to obtain a hydrologically correct DEM that is capable of correctly representing riverbeds.
The CORINE (Coordination of Information on the Environment) Land Cover dataset (EEA, 2000), developed by the European Environment Agency (EEA) and made available online, was used in this study. The dataset was downloaded for the entire country and converted to raster form to facilitate calculations.
Soil data was obtained from soil maps. Two different sets of soil maps were used in this study. To represent the currently used methodology, the soil map of scale 1:1 000 000 (developed in 1959 by the Yugoslav Society of Soil Science) was used. As an improvement to the methodology, the soil maps of scale 1:50 000 (developed between 1958 and 1982 by the Soil Institute of Serbia) were introduced. All maps were manually digitized and classified. The implemented datasets are shown in Fig. 2.
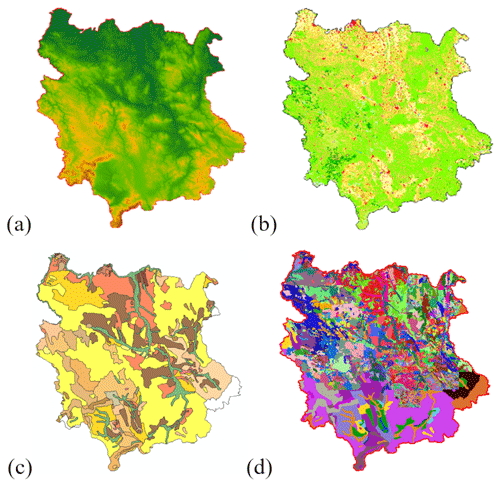
Figure 2Overview of used datasets: (a) Pre-processed DEM, (b) CORINE Land Cover, (c) digitized soil map of scale 1:1 000 000, and (d) digitized soil map of scale 1:50 000.
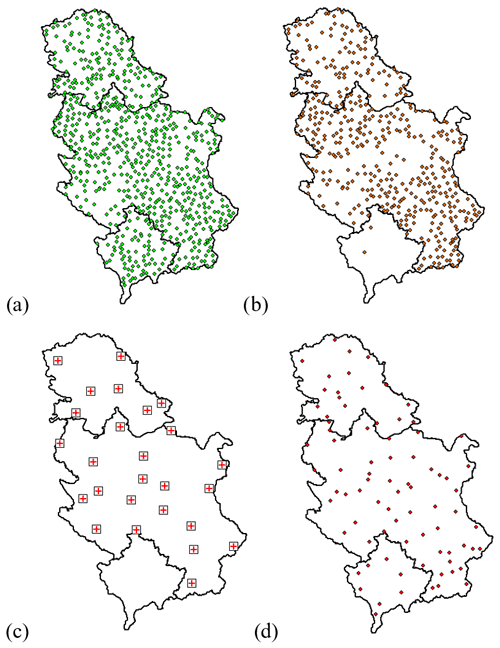
The hydrological and meteorological data used in this study were obtained from the Hydrometeorological Service of Serbia (HMSS). Rainfall data included: mean annual rainfall at 704 rain gauges, maximum daily rainfall at 433 rain gauges, intensity-duration-frequency (IDF) curves at 26 main meteorological stations. Mean annual air temperature data was acquired for 81 stations. Discharge data was acquired in the form of maximum annual instantaneous discharge and mean annual discharge, for the 21 reference catchments, from the beginning of measurement for each discharge station up to 2011. The locations of the used meteorological data are shown in Fig. 3.
4.1 Automation of Currently Used Methodologies
The Soil Conservation Service (now National Resources Conservation Service) Curve Number method, developed at the United States Department of Agriculture (USDA) during the 1950s, is the method most frequently used for estimating direct runoff from storm rainfall in ungauged catchments in Serbia today. The runoff curve number (CN) is based on the hydrologic soil group, land use, treatment and hydrological condition. Once the characteristic land cover description and hydrologic soil group have been defined, runoff curve numbers may be read from provided tables such as in the National Engineering Handbook (NEH) (NRCS, 2002).
The Curve Number (CN) was estimated using the CORINE Land Cover dataset and the digitized soil map of scale 1:1 000 000. The soils were categorized into hydrologic soil groups (A, B, C and D) based on criteria from the Soil Conservation Service and soil characteristics. The classes of the CORINE Land Cover classification system have each been assigned a Curve Number for every hydrologic soil group. The complex Curve Number for the entire catchment was computed using the weighted CN method, following the identification of all hydrologic soil-cover complexes.
The transformation of excess rainfall into direct runoff was simulated using a modified SCS dimensionless unit hydrograph. Jovanović (1989) documented a modification of the SCS synthetic unit hydrograph based on a large number of observed catchments in Yugoslavia, and this method has since grown much in popularity. This method defines the dimensionless unit hydrograph based on the duration of rainfall and certain morphometric characteristics of the catchment (catchment area, longest flow path, flow distance from the catchment centroid to the outlet and the distance-weighted channel slope).The peak discharge for a specific storm event is calculated by approximating the unit hydrograph with an equivalent triangular hydrograph having the same units of time and discharge, thus having the same percent of volume in the rising side of the triangle.
Design rainfall for flood discharge estimation is most often based on the premises that an event with rainfall intensity of a certain probability of occurrence will cause runoff with the same probability of occurrence. These rainfall events were estimated using available IDF (intensity-duration-frequency) curves from the nearest meteorological station for each catchment. When performing calculations, each combination of rainfall duration and intensity (for a certain probability of occurrence) is evaluated, and the combination which yields the highest runoff is chosen.
4.2 Proposal for Improvement of Methodology
In an attempt to improve the results of current methodologies, two modifications were made to the calculations: an update of soil data and the introduction of a distributed velocity method for calculating catchment lag time.
The soil database was updated to include available soil data from soil maps of scale 1:50 000. All available soil maps were digitized and classified into hydrologic soil groups. As soil maps at this scale do not cover the entire study area, the gaps were substituted by previously used soil data (from the smaller scale 1:1 000 000 maps). This way, all of the study area was covered with the best available soil data.
A more hydraulic and deterministic approach was taken to estimate hydrograph lag time, improving upon current empirical methods relating hydrograph lag to longest flow path length and average slope, length of flow path from the catchment centroid and rainfall duration. The motivation to the suggested improvement was to utilize the computing power of GIS to achieve a more process-based, distributed approach that accounts for spatial variability of flow, while still implementing the unit hydrograph methodology (as a lumped model).
The distributed velocity method for estimating hydrograph lag time developed in this work estimates flow velocities on every flow path within a catchment (in this case in every grid cell), then sums travel times along the hydraulically most distant path. Catchment areas were characterized by driving processes into three flow types: sheet flow, shallow concentrated flow, and open channel flow.
Sheet flow is defined as flow over plane surfaces, which usually occurs in the headwaters of a stream near the ridgeline that defines the catchment boundary. Sheet flow was calculated using a simplified version of Manning's kinematic solution. Shallow concentrated flow was defined as flow that follows sheet flow, but lacks a well-defined channel, and was calculated using an empirical relationship between velocity, land cover and slope. Open channel flow, defined as a stream (or river) with a clearly defined channel, was calculated using Manning's equation. The value for Manning's roughness n was estimated using Jarrett's formula, while the hydraulic radius R was estimated based on the assumption of a trapezoidal channel cross section.
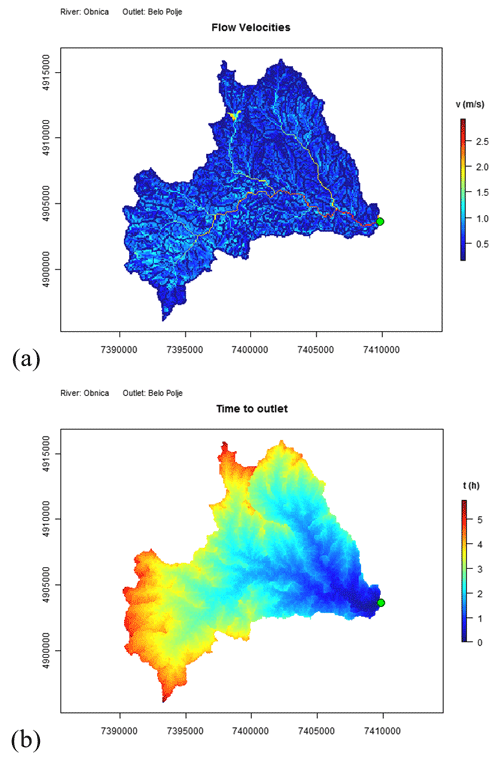
A flow velocity raster is created by calculating the flow velocities in every cell of the catchment based on flow type, slope and estimated roughness. After the flow velocity raster has been calculated, travel times are also computed using the aspect raster. Examples of the flow velocity and time to outlet rasters are shown for the Obnica River in Fig. 4.
4.3 Validation of Flow Prediction in Reference Catchments
To validate discharge prediction methods applied in ungauged catchments in Serbia, 20, 50, 100 and 1000 year return period discharges predicted in 21 reference (gauged) catchments were compared to results obtained by frequency analysis of annual maximum discharge. To test the impact of improved soil data and the distributed velocity estimation of hydrograph lag time, discharges were predicted using both standard and improved methods. Frequency analysis included Generalized Extreme Value (GEV) and Gumbel (Extreme Value Type I) distributions, where parameters were estimated using L-moments.
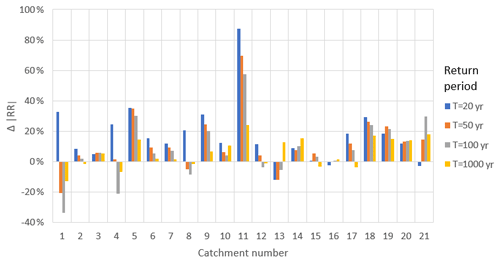
Comparison of predicted discharges and those derived from frequency analysis (Figs. 5 and 6) indicate that the methodology applied is likely acceptable for deriving design discharges for ungauged catchments in Serbia. Improvements of improved soil data and the distributed velocity estimation of hydrograph lag time greatly reduce residuals (Fig. 7), indicating much better model performance. Greater improvements were associated with lower return periods, while the level of improvement for the 1000-year return period was insignificant. No clear link between rate of improvement and geographic characteristics of the catchments was found.
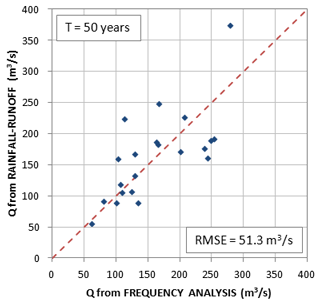
Figure 5Comparison of calculated peak discharges and statistical design discharges, BEFORE methodology improvements, for 50-year return period.
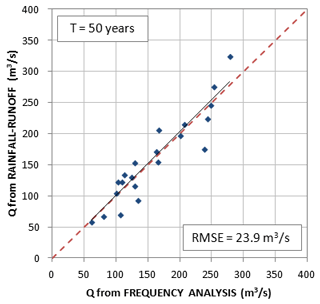
Figure 6Comparison of calculated peak discharges and statistical design discharges, AFTER methodology improvements, for 50-year return period.
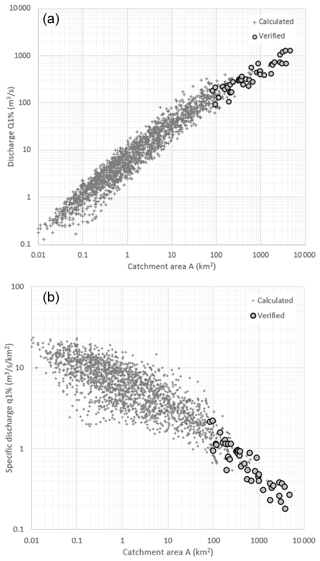
The methodology presented has been successfully applied to calculate design flood flows for over 2500 catchments in Serbia for numerous design projects (roads, railways, pipelines, etc.), with the results shown in Fig. 8 as a plot of specific discharge (defined as the discharge per catchment area) of the 100-year flood and catchment area, comparing calculated results with verified results. The term “verified results” is used for results that correspond to the results of statistical analysis of observed values (where available).
The automated calculation system presented in this study is one way of creating an extremely useful tool for hydrologists for the quick estimation of design discharges. The morphometric module of the calculation system showed excellent results, saving a great deal of time that would otherwise have been spent on manual processing of geospatial data. This type of automated analysis presented in this study will enable a much quicker hydrologic analysis on multiple catchments, while the methodology improvements introduced in this study will help to provide better estimates of predicted runoff.
Further work could include an even more distributed approach to modelling runoff (as opposed to the lumped unit hydrograph method used in this study) to better take into account the spatial variability of runoff. Unfortunately, more accurate datasets are currently unavailable, most notably soil and rainfall data, which are all limiting factors in achieving a closer resemblance of calculated results to observed values.
The methodology presented in this paper has been entirely implemented using open source software, including QGIS (http://qgis.org/, QGIS Development Team, 2022) for data preparation, SAGA GIS (Conrad et al., 2015) for raster analyses and the R programming language (R Core Team, 2021) for running the calculations.
The SRTM Digital Elevation Model (https://doi.org/10.5069/G9445JDF, NASA SRTM, 2013) and CORINE Land Cover dataset (https://doi.org/10.2909/71c95a07-e296-44fc-b22b-415f42acfdf0, EEA, 2020) are open and freely available for download from their respective repositories. Soil maps that were used in this research are available upon request from the Soil Institute of Serbia. Hydrological and Meteorological data are partly available online (Republic Hydrometeorologic Service of Serbia, 2022), while the complete datasets are available upon request due to governmental data policies.
NZ and MM contributed to the design and implementation of the research, to the analysis of the results and to the writing of the manuscript.
At least one of the (co-)authors is a guest member of the editorial board of Proceedings of IAHS for the special issue “ICFM9 – River Basin Disaster Resilience and Sustainability by All”. The peer-review process was guided by an independent editor, and the authors also have no other competing interests to declare.
Publisher's note: Copernicus Publications remains neutral with regard to jurisdictional claims made in the text, published maps, institutional affiliations, or any other geographical representation in this paper. While Copernicus Publications makes every effort to include appropriate place names, the final responsibility lies with the authors.
This article is part of the special issue “ICFM9 – River Basin Disaster Resilience and Sustainability by All”. It is a result of The 9th International Conference on Flood Management, Tsukuba, Japan, 18–22 February 2023.
The completion of this research paper would not have been possible without the guidance of the staff of the International Centre for Water Hazard (ICHARM), and support from the Japan International Cooperation Agency (JICA).
This paper was edited by Kensuke Naito and reviewed by two anonymous referees.
Conrad, O., Bechtel, B., Bock, M., Dietrich, H., Fischer, E., Gerlitz, L., Wehberg, J., Wichmann, V., and Böhner, J.: System for Automated Geoscientific Analyses (SAGA) v. 2.1.4, Geosci. Model Dev., 8, 1991–2007, https://doi.org/10.5194/gmd-8-1991-2015, 2015.
European Environment Agency (EEA):Technical Report No. 40, CORINE land cover technical guide – Addendum 2000, prepared by: Bossard, M., Feranec, J., and Otahel, J., European Environment Agency, Copenhagen, Denmark, 2000.
European Environment Agency (EEA): Copernicus Land Monitoring Service information – CORINE Land Cover 2018 (vector), European Environment Agency [data set], https://doi.org/10.2909/71c95a07-e296-44fc-b22b-415f42acfdf0, 2020.
Jovanović, S.: Hydrology, Građevinski priručnik – tehničar, 6, 11–181, IRO Građevinska knjiga, Beograd, 1989 (in Serbian).
NASA Shuttle Radar Topography Mission (SRTM): Shuttle Radar Topography Mission (SRTM) Global, OpenTopography [data set], https://doi.org/10.5069/G9445JDF, 2013.
Natural Resources Conservation Service (NRCS): National Engineering Handbook: Part 630 Hydrology, United States Department of Agriculture (USDA), Washington, D.C., 2002.
QGIS Development Team: QGIS Geographic Information System. Open Source Geospatial Foundation Project, http://qgis.org/ (last access: 21 October 2022), 2022.
R Core Team: R: A language and environment for statistical computing, R Foundation for Statistical Computing, Vienna, Austria, https://www.R-project.org/ (last access: 21 October 2022), 2021.
Republic Hydrometeorologic Service of Serbia: Republic Hydrometeorologic Service of Serbia website, https://www.hidmet.gov.rs/ (last access: 21 October 2022), 2022.
Rodriguez, E., Morris, C.S., Belz, J.E., Chapin, E., Martin, J., Daffer, W., Hensley, S.: An assessment of the SRTM topographic products, Technical Report JPL D-31639, Jet Propulsion Laboratory, Pasadena, California, 2005
The World Factbook: The World Factbook 2017, Washington, D.C., Central Intelligence Agency, https://www.cia.gov/ (last access: 21 October 2022), 2017.


